 Online Store
Introduction
Over the last several decades, governments have collectively pledged to slow global warming. But despite intensified diplomacy, the world is already facing the consequences of climate…
U.S. Deficits and the National Debt
The Obama administration’s 2013 budget plan has revived debate over the sustainability of U.S. spending. As the United States emerges from a deep recession, it must maintain a tricky policy balance.
Last updated March 2, 2012 7:00 am (EST)
- Backgrounder
- Current political and economic issues succinctly explained.
This publication is now archived. Read CFR's latest backgrounder on the U.S. debt dilemma.
Introduction
Long-term budget projections indicate the United States faces insolvency over the next few decades under the current tax and entitlement regime. Unless appropriate legislative action is taken, many analysts say, the national debt [PDF] will become unsustainable, growing at a faster rate than GDP and commanding a growing percentage of government revenues to pay the interest.
More on:
As the United States emerges from a deep recession, it must maintain a tricky policy balance, experts say. Alongside short-term measures aimed at sustaining the economic recovery, such as the payroll tax cut extension, the government must achieve medium-term fiscal consolidation likely involving higher taxes and lower spending to lessen its massive debt. But gridlock between Democratic and Republican lawmakers, signaled anew since the release of the Obama administration’s fiscal year 2013 budget, risks eroding the international investor goodwill underpinning low U.S. borrowing costs. Economists warn that postponing reforms for too long risks tarnishing the U.S. reputation in the eyes of global investors who have relied on U.S. Treasuries as an essentially riskless, "safe haven" asset.
Historical Trends in U.S. Debt
The national debt reflects three primary variables: prevailing economic conditions, public policy, and demographic changes. The United States has run annual deficits—spending more than the Treasury collects—almost every year since the nation’s founding. The period since World War II, which firmly established the United States as a preeminent global power, provides a good starting point from which to examine modern debt levels.
Ebb and Flow of Debt as a Percentage of GDP, 1940–2009
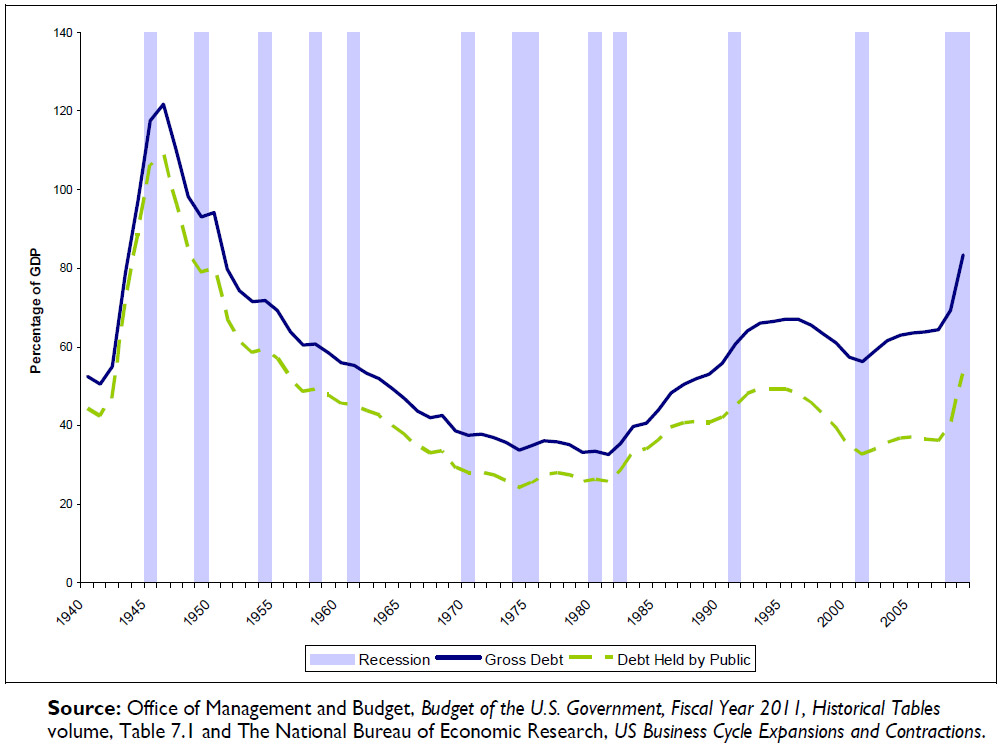
The war led to a period of unprecedented debt accumulation, when defense spending skyrocketed from 1.7 percent of GDP in 1940 to 37.5 percent in 1945. The national debt peaked in 1946 at 122 percent of GDP, exceeding the total output of the U.S. economy. For the next thirty years, a long period of economic growth gradually brought the debt down as a percentage of GDP despite wars in Vietnam and Korea and the establishment of two federal entitlement programs, Medicare and Medicaid. In their first year (FY 1967), spending for both programs amounted to just 0.5 percent of GDP (total U.S. federal health spending for 2011 was more than ten times this number). Overall, debt as a percentage of GDP bottomed out in 1974 at 23.9 percent.
Ballooning defense spending and substantial tax cuts beginning in the 1980s ushered in a new period of rising federal debt. In 1985, lawmakers attempted to address spiraling debt with the passage of the Balanced Budget Act (Gramm-Rudman-Hollings). While the legislation sought to eliminate deficit spending by 1990, the debt continued to climb for most of the following decade.
More on:
Deficits or Surpluses Since 1946
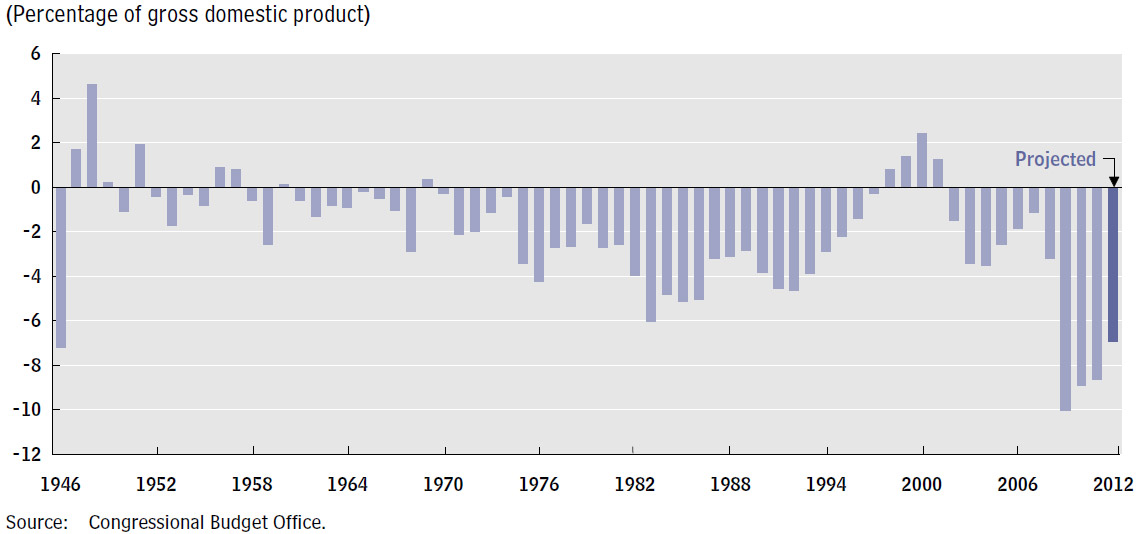
During the 1990s, a combination of tax increases, spending reductions (particularly in defense), and an economic boom reduced the debt as a percentage of GDP and brought four consecutive years of budget surpluses beginning in 1998—the first such streak in forty years.
The Tax and Spending Conundrum
The recent era of budget deficits is a legacy of the Bush-era tax cuts, post-9/11 war spending in Iraq and Afghanistan, new entitlements (Medicare Part D), and the policies pursued during the recent financial crisis and subsequent economic downturn. A major bank bailout (TARP) and stimulus package (Recovery Act) pushed deficits to record levels through the recession. Debt to GDP nearly doubled from 36.2 percent in 2007 to 67.7 percent in 2011.
Many economists say a combination of tax increases and spending reductions is necessary to address a deficit of this size. The bipartisan Fiscal Commission (see below) advocated such a proposal in December 2010, calling for a $4 trillion deficit reduction over the next ten years, achieved through both tax reform (cutting rates and broadening the base) and adjustments to entitlements (Medicare cost-sharing).
The nonpartisan Congressional Budget Office (CBO) projects the deficit will decline to $1.1 trillion for 2012 and then fall dramatically over the next decade. However, these "baseline" projections assume current laws remain unchanged. Many analysts believe political stalemate makes such projections highly unlikely in the foreseeable future. The CBO’s budget scenario would see the Bush tax cuts sunset entirely, the payroll tax cut rise to previous levels, more Americans paying the Alternative Minimum Tax (AMT), reductions in reimbursements to Medicare physicians, and the implementation of roughly $1 trillion in automatic cuts to spending as stipulated in the Budget Control Act of 2011.
Federal Debt Held by the Public Projected in CBO’s Baseline and Under an Alternative Fiscal Scenario
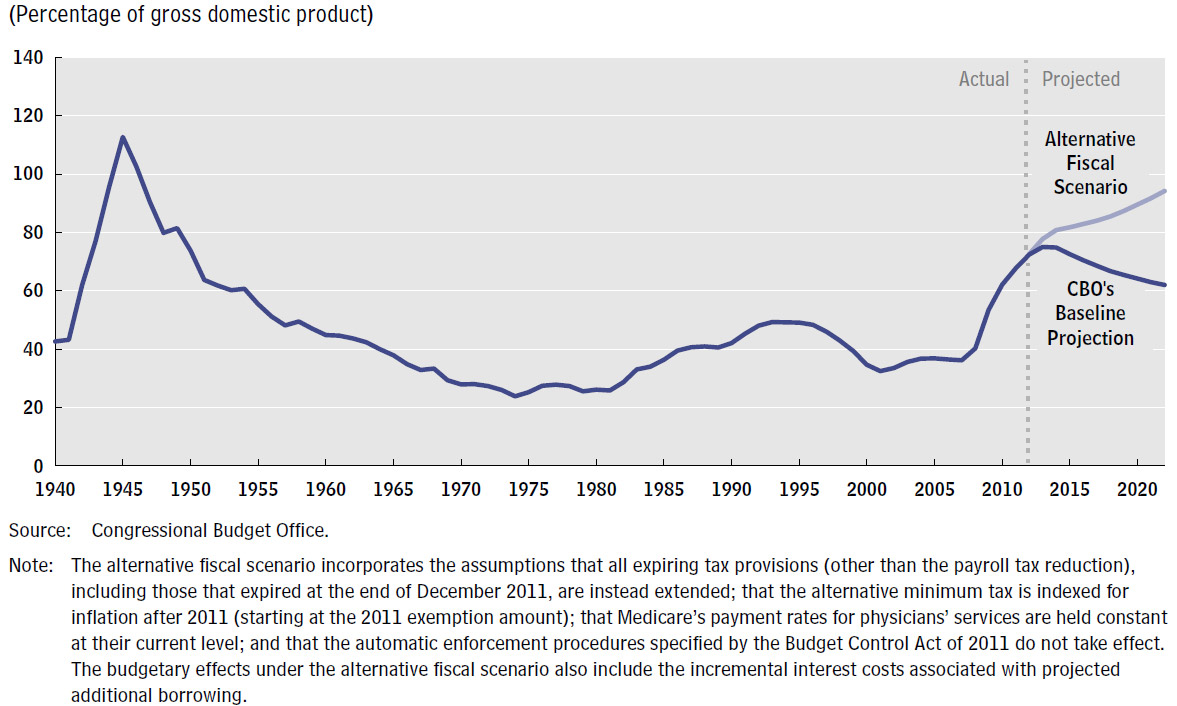
However, as the CBO suggests, the fiscal outcomes assumed in the baseline projections represent a "significant departure from recent policies" that in many cases do not reflect likely future legislation. The CBO provides an "alternative fiscal scenario" to illustrate the consequences associated with more probable fiscal policies. As shown in the chart above, this fiscal trajectory bounds upward, steadily increasing the debt between 5 and 6 percent of GDP each year, from 77.8 percent in 2013 to 94.2 percent in 2022—which would be the largest ratio since 1948.
Demographics and Long-Term Deficits
Unlike modern budget shortfalls, long-term deficits are primarily a function of elevated entitlement spending as a result of shifting U.S. demographics. An aging population, longer life expectancies, and rising health-care costs are projected to fuel large and growing budget deficits over the next several decades—though these projections are extremely sensitive to assumptions about the future rate of health-spending growth. Advances in medical technology have driven up costs considerably in recent years, but could, in the future, provide certain efficiencies that alter this trend.
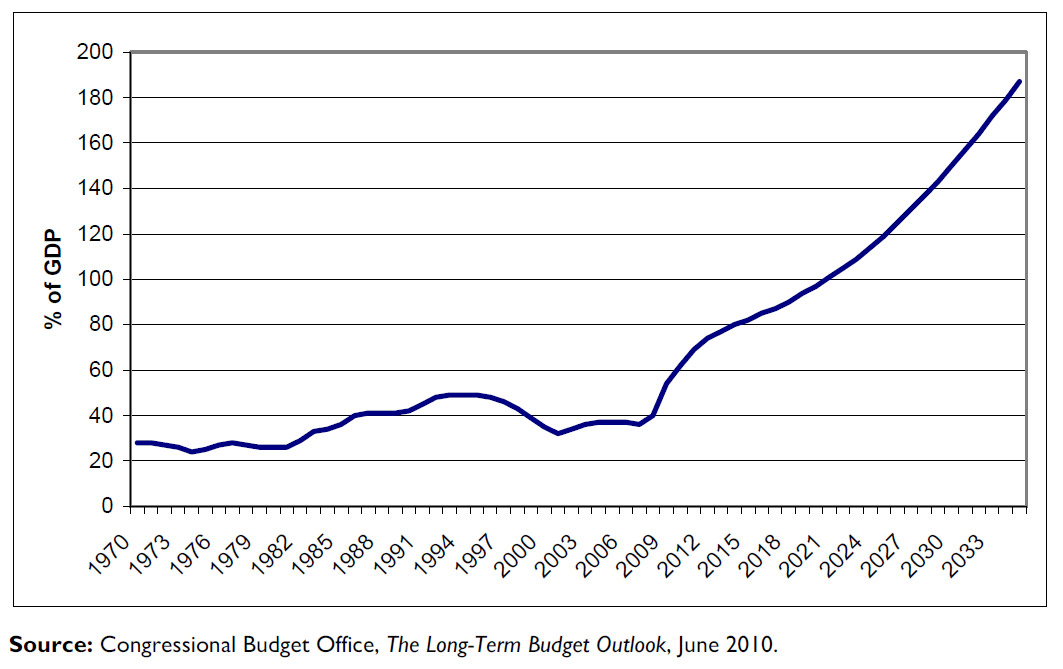
Actual and Projected Primary Federal Spending as a Percentage of GDP (1970–2035)
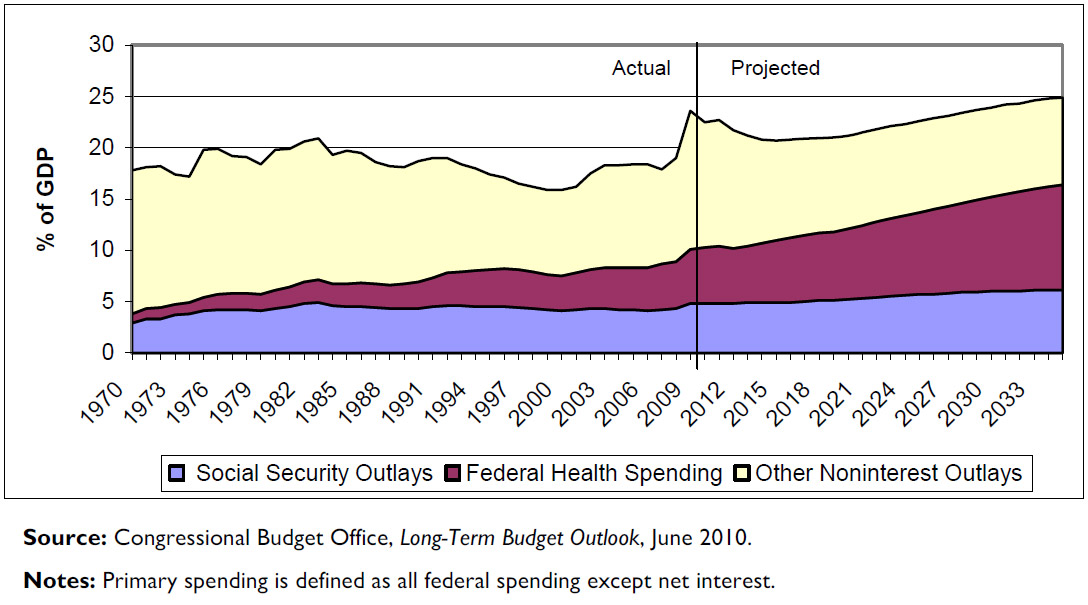
Under current law, the CBO projects that Social Security and federal health spending (Medicare and Medicaid) will climb from 4.8 and 5.6 percent of GDP, respectively, in 2011 to 6.1 and 10.3 percent in 2035. But it also warns of a possibly far gloomier budget scenario, with projected long-term deficits that by the middle of the century would be unsustainable under current law. According to a CBO report, "In essence, the rise in entitlement spending under a scenario with continued excess cost growth is too large and permanent to credibly be financed indefinitely by pushing its cost forward through borrowing."
Historical and Projected Federal Debt as a Share of GDP
Proposed Deficit Reduction Plans
An array of private and public policy groups has proposed more than thirty different deficit reduction approaches. The plans address the major aspects of medium-term fiscal reform (2010–2020): defense and non-defense discretionary spending, social security and health spending, and taxes. Among the most cited are the following:
2022 Spending/Revenue Targets: 22.8 / 20.1 percent of GDP
2022 Debt Target: 76 percent of GDP
Defense: Essentially freezes spending through 2017 in accordance with the new defense strategy; limits war spending to under $450 billion through 2021.
Tax/Revenues: Reduces individual and corporate income tax rates and broadens tax base; ends tax cuts for individuals/couples making over $200/250k; observes "Buffett rule" for households making over $1 million.
- The House Republican Budget Plan (Path to Prosperity):
2020 Spending/Revenue Targets: 20 / 18 percent of GDP
2020/2035 Debt Targets: 70 / 48 percent of GDP
Defense: Adopts security proposals in President’s FY 2012 budget, holding defense spending growth near inflation.
Tax/Revenues: Imposes revenue-neutral tax reform reducing top individual and corporate rate to 25 percent; assumes Bush tax cuts extended for all earners.
2020 Spending/Revenue Targets: 22 / 21.5 percent of GDP
2020 Debt Target: 60 percent of GDP
Defense: Reduces weapon systems; reforms compensation; reforms contracting; covers all war costs beyond 2015 with a war surtax.
Tax/Revenues: Reduces tax expenditures by 10 percent and limits growth; divides the proceeds between lower tax rates and deficit reduction; enacts a broad-based carbon tax; enacts revenue-neutral corporate tax reform.
- The Debt Reduction Task Force Plan (Domenici-Rivlin):
2020 Spending/Revenue Targets: 23 / 21.5 percent of GDP
2020/2040 Debt Targets: 60 / 52 percent of GDP
Defense: Freezes spending for five years through caps, then limits growth to GDP.
Tax/Revenues: Assumes Bush tax cuts under $250,000 extended; introduces a 6.5 percent "Debt Reduction Sales Tax" or VAT; reforms income tax structure.
- The bipartisan Fiscal Commission Plan (Simpson-Bowles):
2020 Spending/Revenue Targets: 22 / 20.5 percent of GDP
2020/2035 Debt Targets: 65 / 40 percent of GDP
Defense: Caps 2012 spending at 2011 levels; returns to 2008 levels in 2013, then limits growth to half the rate of inflation.
Tax/Revenues: Implements comprehensive reform, including reforms or repeals on most tax expenditures; reduces top corporate and individual rate to between 23 percent and 29 percent; shifts to territorial tax system; consolidates tax brackets from six individual rates to three.
In this exclusive HBO/CFR History Makers series video, Erskine Bowles discusses the troubling U.S. fiscal outlook and reflects on his experience as part of the contentious policy negotiations. (Transcript available here.)
Cautionary Tales From Europe
At some point in the not-too-distant future, analysts say, investors may decide the lack of effective governance constitutes an increased risk of default and will no longer be willing to hold U.S. Treasuries at normal interest rates. Standard and Poor’s downgrade of the U.S. debt rating in August 2011 indicated as much: "America’s governance and policymaking [has become] less stable, less effective, and less predictable than what we previously believed." If many investors begin fleeing to alternatives, it may become prohibitively expensive for Washington to attract new buyers of debt, resulting in even larger deficits, increased borrowing, or what is known as a "debt spiral."
Global investors may continue to fund high U.S. deficits for several years, but the recent experiences of several advanced economies in Europe—Greece, Iceland, Ireland, and Portugal—indicate the unpredictability and speed at which fiscal crises can come. Several factors have thus far helped insulate the United States from such a fate—a floating exchange rate, reserve currency status, lower borrowing costs, a higher capacity for growth, and no record of default. But there are also some striking similarities with the situation faced by some European states, including a rising debt to GDP and a reliance on foreign capital to finance debt.
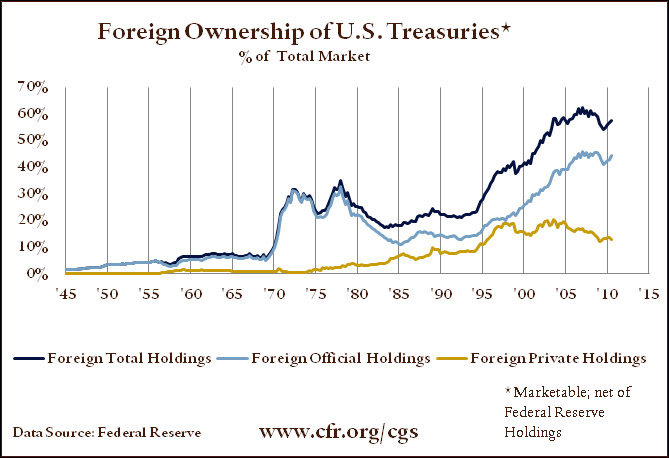
A 2009 report by the nonpartisan Congressional Research Service suggests that a loss of confidence in the debt market could prompt foreign creditors [PDF] to unload large portions of their holdings, thus inducing others to do so, and causing a run on the dollar in international markets and a sudden spike in U.S. interest rates. A study of U.S. Treasury data indicates that Beijing is beginning to diversify away from the dollar. The percentage of China’s foreign exchange reserves held in dollars fell to a decade low of 54 percent for the year ending June 2011, down from 65 percent in 2010. According to the IMF, "Low borrowing costs in Japan and the United States have arguably created a false sense of security [PDF], but should be viewed instead as providing a window of opportunity for policies to address fiscal vulnerabilities."
CFR Adjunct Senior Fellow Francis Warnock writes that the United States came close to the above scenario in late 2009, when the ten-year Treasury yield jumped fifty basis points from 3.25 to 3.75 percent in response to a record U.S. deficit, the end of the Federal Reserve’s quantitative easing program, and an uptick in inflation prospects. However, he says, the onset of the eurozone phase of the global financial crisis staved off an investor backlash. "U.S. policymakers need to understand that this is not a reset, not a new beginning; it is a lucky break," writes Warnock. How lawmakers use this grace period will influence the ability of the United States to borrow in the future and have "broad implications for the sustainability of an active U.S. foreign policy," he says.
Editor’s Note: Plan data drawn directly from sources as well as the Center for a Responsible Federal Budget.