 Online Store
Introduction
Over the last several decades, governments have collectively pledged to slow global warming. But despite intensified diplomacy, the world is already facing the consequences of climate…
Inflows from Private Bond Investors Into the U.S.
More on:
The global capital flows story these days is complex. I wanted to build on Landon Thomas’ article with a set of charts drawing out how I think large surpluses in Asia and Europe are now influencing the TIC data. Obviously, this is a more technical post.
Asia’s surplus is big. In dollar terms, the combined current account surplus of China, Japan, and the NIEs (South Korea, Taiwan, Hong Kong, and Singapore) is back at its pre-crisis levels. China’s surplus is a bit smaller in 2007, but Korea and Taiwan are clearly running bigger surpluses. Yet unlike in the past, very little of Asia’s surplus is going into a reserve buildup. China is obviously selling, and its selling overwhelms intermittent purchases by Korea (Korea sold in q1 2016, but bought in q3) and Taiwan. The outflow of savings from Asia is currently overwhelmingly a private flow.
That is a change. And frankly it makes the impact of Asia’s surplus on global markets harder to trace. The Bank for International Settlement (BIS) data shows that much (I would say most) of the "capital outflow" from China over the last four quarters has actually gone to paying down China’s external bank debt, not to build up assets. It thus just becomes a new source of liquidity for the global banking system (once a dollar loan is repaid, the bank is left with a dollar—which has to be parked somewhere else).
And of course the eurozone and northern Europe also run substantial surpluses. Negative rates and ECB asset purchases in effect work to push investors out of super low-yielding assets in Europe, and into somewhat higher yielding assets outside the eurozone.*
The combined surplus of China, Japan, the NIEs, the eurozone, Sweden, Denmark, and Switzerland was close to $1.2 trillion in 2015. That is a big sum; one that has to leave traces in the global flow data. The U.S. current account deficit isn’t as big as it was prior to the crisis (and it is smaller than the UK’s current account deficit), but it is still financed, in part, by inflows from abroad into the U.S. bond market.
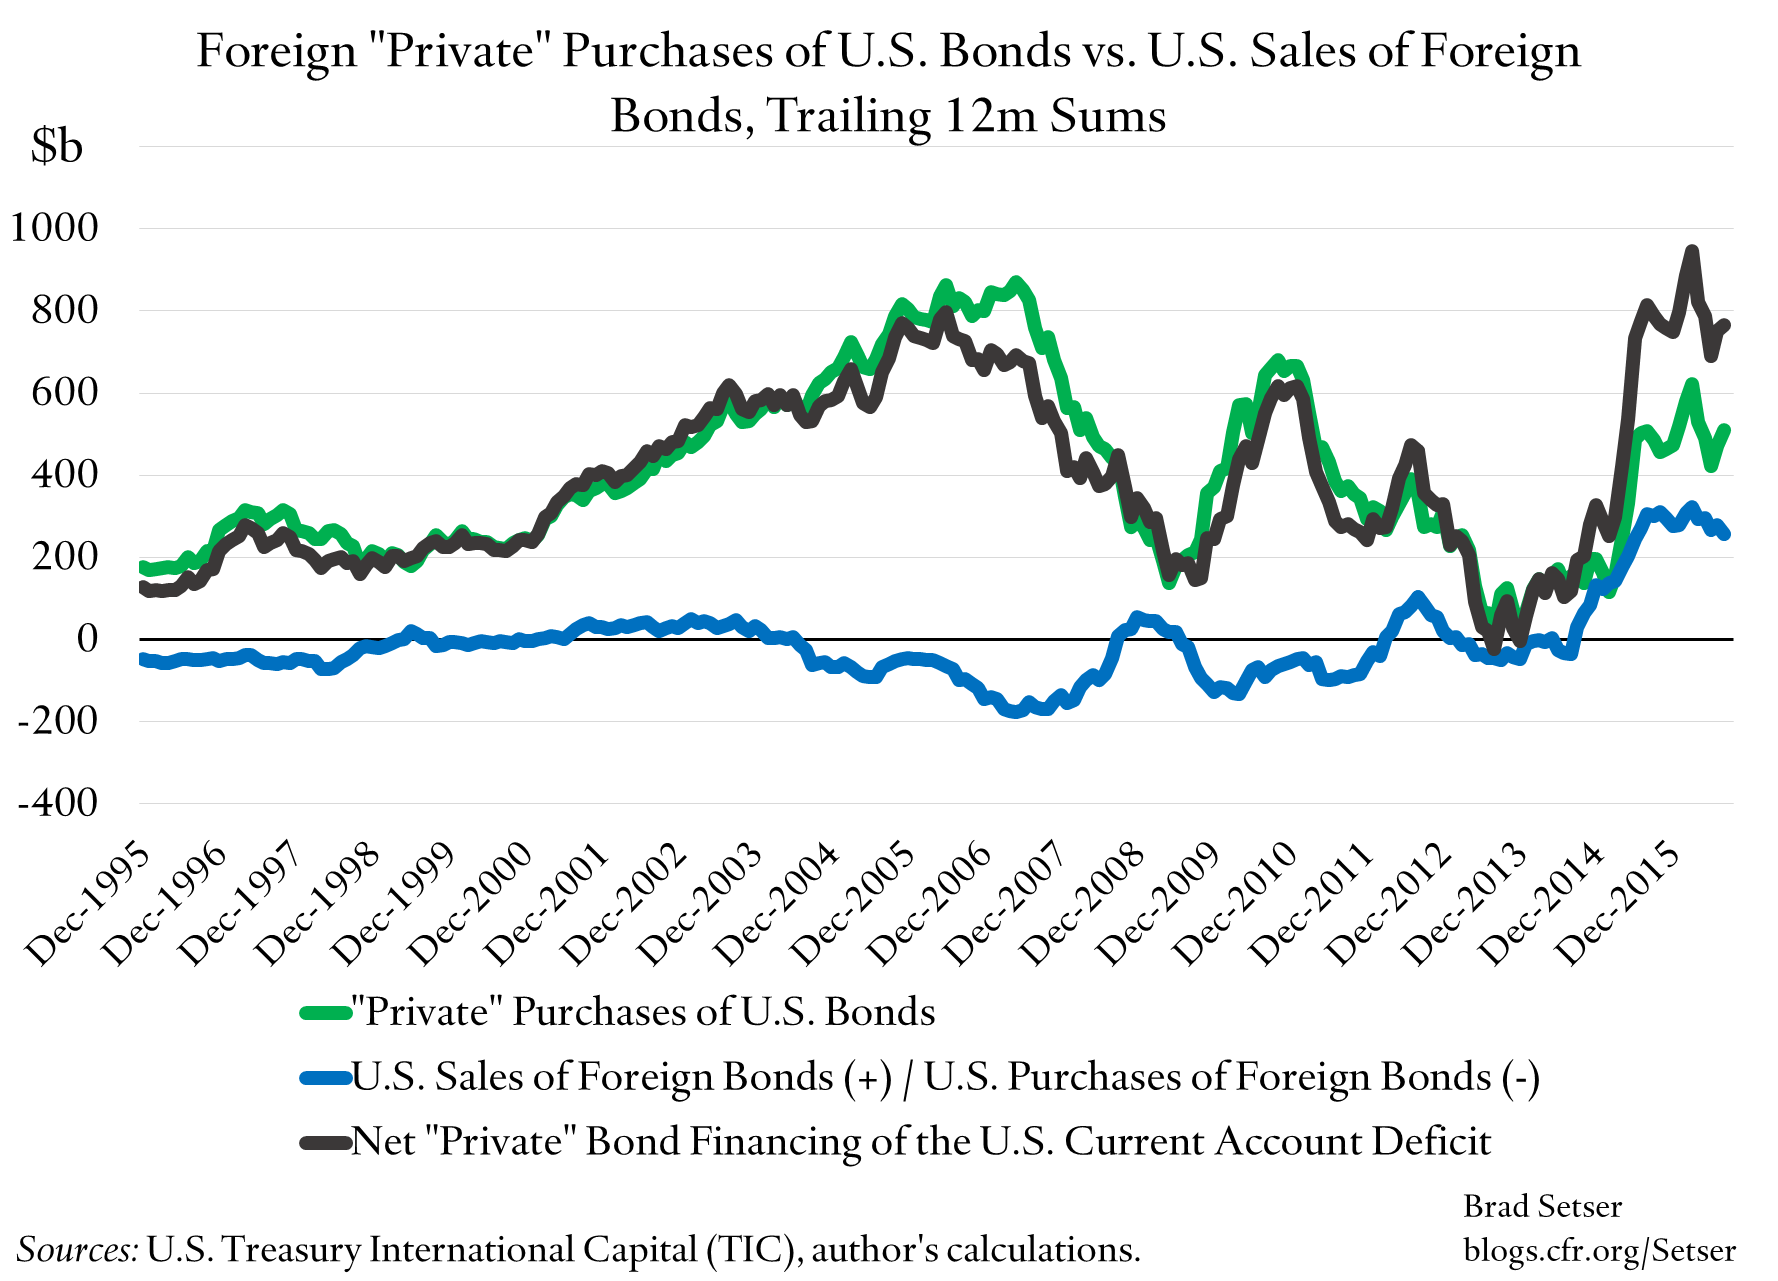
Total inflows from private purchases of U.S. bonds by foreign investors—together with the inflow from American investors selling their existing stock of bonds abroad and bringing the funds home—actually look to be at a record high in the TIC data (in dollar terms, not when scaled to U.S. GDP). $500 billion in inflows from foreign purchases of Treasuries, Agencies, and corporate bonds by private investors abroad, and $250 billion in financing from Americans bringing funds previously invested in foreign bonds home.
The TIC data’s split between private and official investors is notoriously unreliable. Lots of private purchases in the past weren’t really private purchases. But with China and Saudi Arabia selling reserves, and with Japan reducing its reserve holding of long-term securities and building up its deposits, I strongly suspect most of the private inflow is now really private.
Counting official sales, the net inflow from foreign investors—private plus official—are actually on the weak side even as private inflows are are on the strong side. The private inflow data is both important, and not the full story.
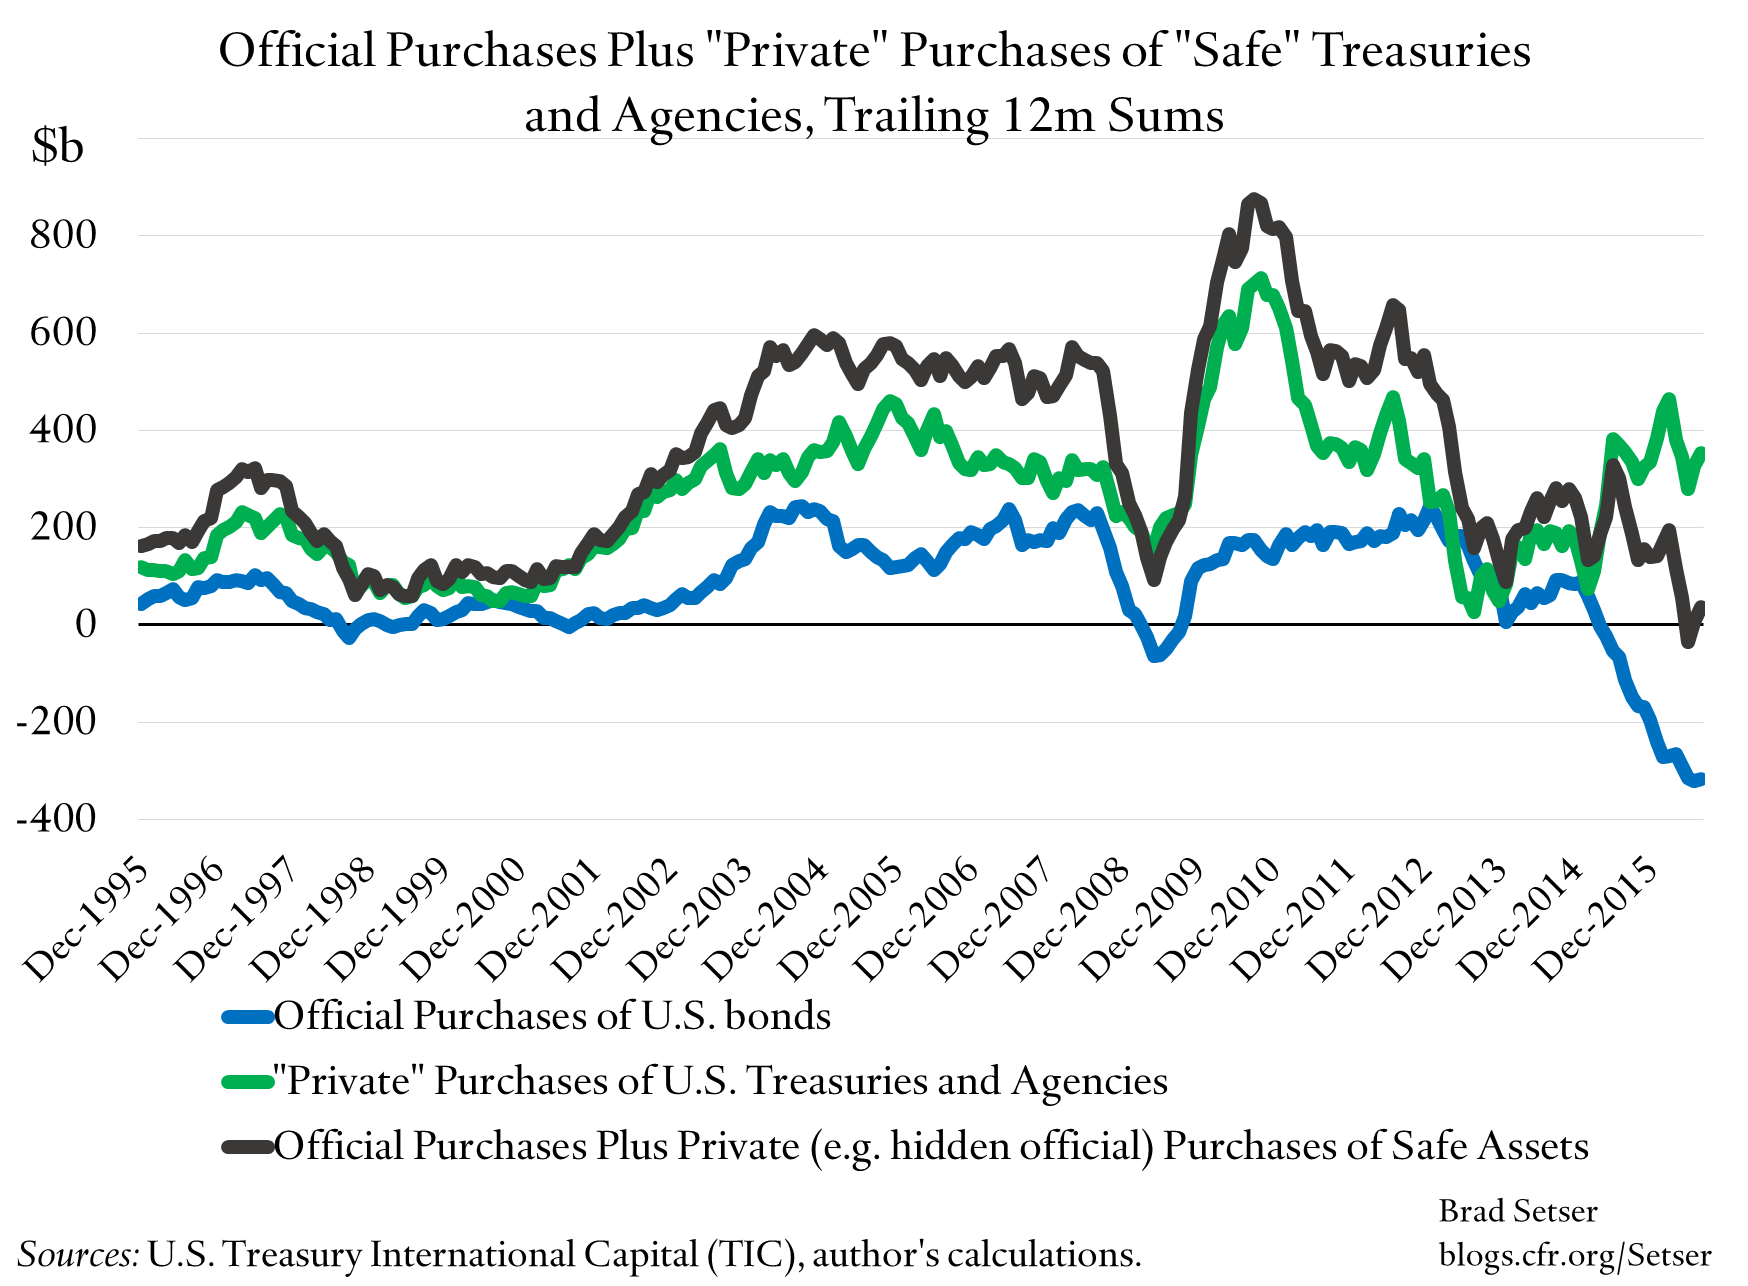
I should note that official inflows into the U.S bond market before the crisis were clearly more than $200 billion a year. The "transactional" TIC data suffers from a lot of problems. It never really registered China, or Gulf, purchases cleanly. They showed up, but as private inflows from Europe (typically) not official inflows from West or East Asia. The custodial data did a better job of capturing the total inflow from China, and, well, it caught a bigger share—but not all—of the inflow from the Gulf. In years past, the best estimate of true official inflows was simply to add all private purchases of Treasuries and Agencies to the official flows in the data. That probably isn’t still the case, but it is still a useful check. (I plotted inflows into Treasuries and Agencies in the TIC data relative to my estimate of reserve growth/ sales here).
There is one other important theme. Before the global crisis there were exceptional inflows from the rest of the world into Treasuries and Agencies. That was—as Ben Bernanke and others have emphasized—a central bank/ reserve accumulation driven flow.
But there was also a large inflow from the rest of the world—and Europe—in particular into U.S. corporate bonds. The "corporate bond" category includes asset backed securities (private label asset backed securities, Agency guarantees are in the "Agency" category). We now know that European banks—and investment vehicles that were based offshore but backed by U.S. banks (SIVs)—accounted for much of this flow. The banks and investment vehicles buying U.S. asset-backed securities didn’t take on much direct currency risk though. The European banks, and various shadow banks, borrowed in dollars, whether from U.S. money market funds or from central bank reserve managers who put dollars on deposit rather than buying in securities, or swapped euros for dollars—to buy U.S. asset-backed securities. They took credit risk, and dollar funding risk. We actually should have been able to figure this out in real time; the BIS data showed the rapid growth of the dollar balance sheets of European banks pre-crisis, and the TIC data showed massive European purchases of corporate bonds. I, among others, didn’t quite put two and two together.
In any case, the massive inflow into corporate bonds in the TIC data from 2005 to 2007 came to an abrupt end well before the global crisis. The flow stopped in the summer of 2007, about a year before "Lehman" and the height of the panic.
And right now there isn’t a massive inflow into any particular segment of the market, at least not judging from the TIC data. Foreigner private investors are buying a mix of Treasuries, Agencies (private investors bought $200 billion in Agencies over the last 12 months, thanks I suspect to Japanese investors) and corporate bonds (real corporate bonds this time, not asset backed securities, data here).
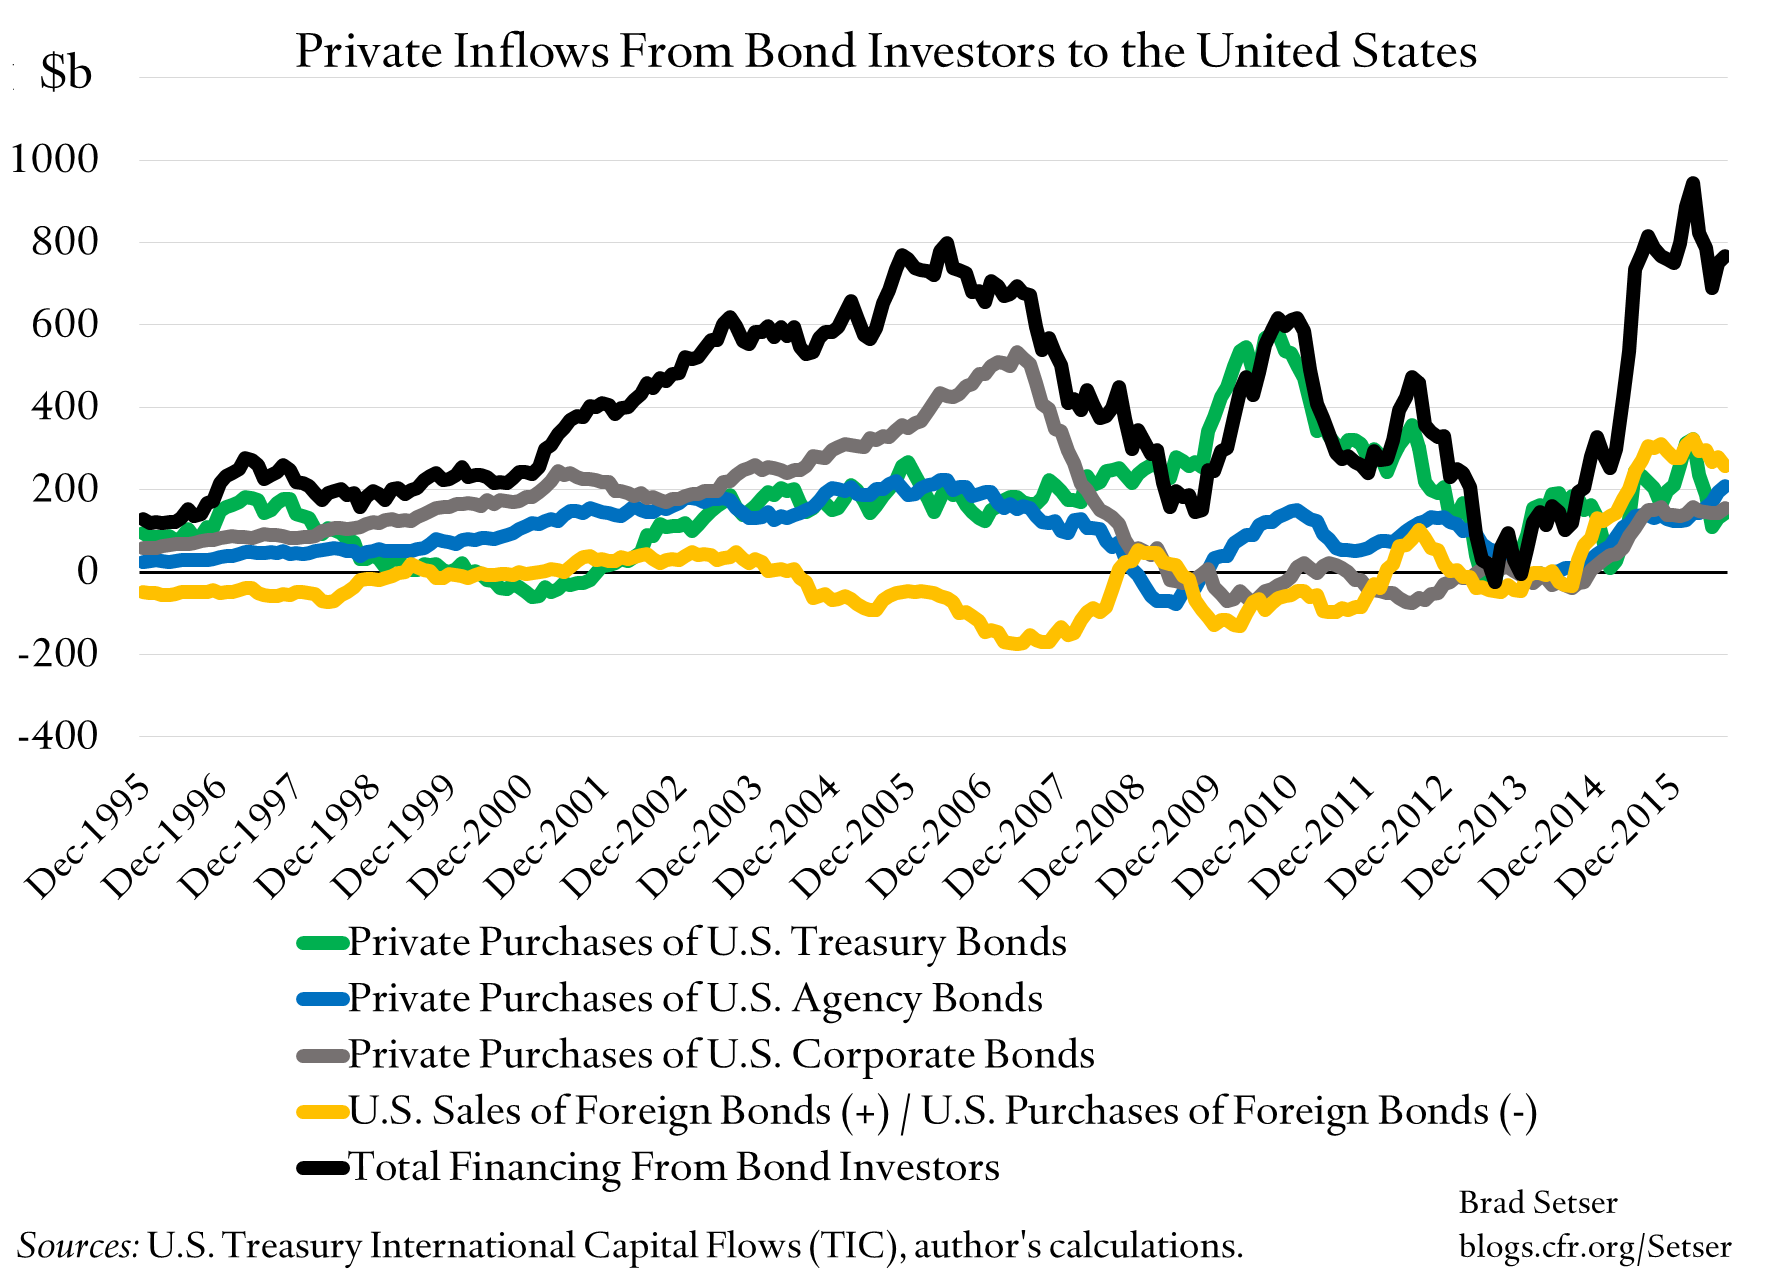
And a big source of net inflows isn’t coming from foreign investors buying U.S. paper, but rather from U.S. investors bringing their money back home. That provided $300 billion of (external) financing at its peak, and has provided about $250 billion in financing over the last 12 months.
The mixed total inflow from private investors is a function of flows into all categories of bonds, not demand for one single type of security.
Mapping the TIC data to underlying imbalances (current account surpluses, which in aggregate need to be offset by external deficits) isn’t straightforward, and it requires a degree of judgement. Chains of risk intermediation can obscure the flow (and yes, create gaps between gross flows and net flows, think of U.S. money market funds lending to European banks to buy U.S. asset-backed securities). But at the end of the day, there usually is something that can be teased out of the data. Right now, it is that a glut of savings in parts of Asia and most of Northern Europe is generating—both directly, and by yield-hungry American investors back home—significant inflows into the U.S. bond market even with relatively low U.S. bond yields.
* Technically private bond inflows can finance equity capital outflows, official bond sales or the buildup of deposits abroad. Gross inflows are equal to gross outflows plus the current account. Saying the inflows finance the current account deficit is this an over-simplification. But it is a reasonable over-simplification in the following sense: the flow over time that has provided the most financing for the the U.S. current account over time has come from the buildup of foreign holdings of bonded debt (portfolio debt securities, in the net international investment position data) -- other flows tend to more or less net out over time. Putting all the needed caveats into a chart label is hard.
More on: