 Online Store
Introduction
Over the last several decades, governments have collectively pledged to slow global warming. But despite intensified diplomacy, the world is already facing the consequences of climate…
Large Scale Central Bank Asset Purchases, Versus Supply
In earlier posts, Emma Smith and I added up central bank purchases of G-4 government bonds. This includes emerging market, Japanese and Swiss purchases for reserve accumulation and purchases by the Fed, Bank of Japan, European Central Bank and Bank of England during periods of quantitative easing (QE).
In this post we compare our estimates of official demand for U.S., Japanese and European bonds with changes in the supply of safe assets—that is, purchases by central banks relative to net new issuance of government bonds.
More on:
If central bank demand for a particular asset is lower than net new issuance, then private sector holdings of government bonds continue to grow but at a slower pace than would otherwise be the case. And if central bank demand for a particular asset exceeds net supply, then private sector investors—such as banks and pension funds—have to reduce their holdings of safe assets, and move into alternative assets.
This is how the portfolio re-balancing transmission channel of asset purchases works: private investors sell to the central bank and are forced to find new places to park their money. Conceptually, it should not matter much if the central bank buying say U.S. assets is the People’s Bank of China or the Fed, at least so long as both are expected to hold on to their purchases for a long-time. When either buys, it reduces the stock of assets in private hands and forces investors to shift into other assets.
Central bank asset purchases aren’t limited to government bonds of course, but, to simplify things, we limited our analysis to new issuance of government bonds. We know this over-simplifies. For example, a lot of “official” demand has gone into Agencies. Before the global crisis Agencies were a favorite of reserve managers globally. But adding in the Agencies to net supply takes a bit (ok, a lot) more work. The Fed also bought Agencies, but Fed holdings of Agencies and Treasuries are reported separately on their balance sheet. The numbers below only count the Fed’s Treasury portfolio.
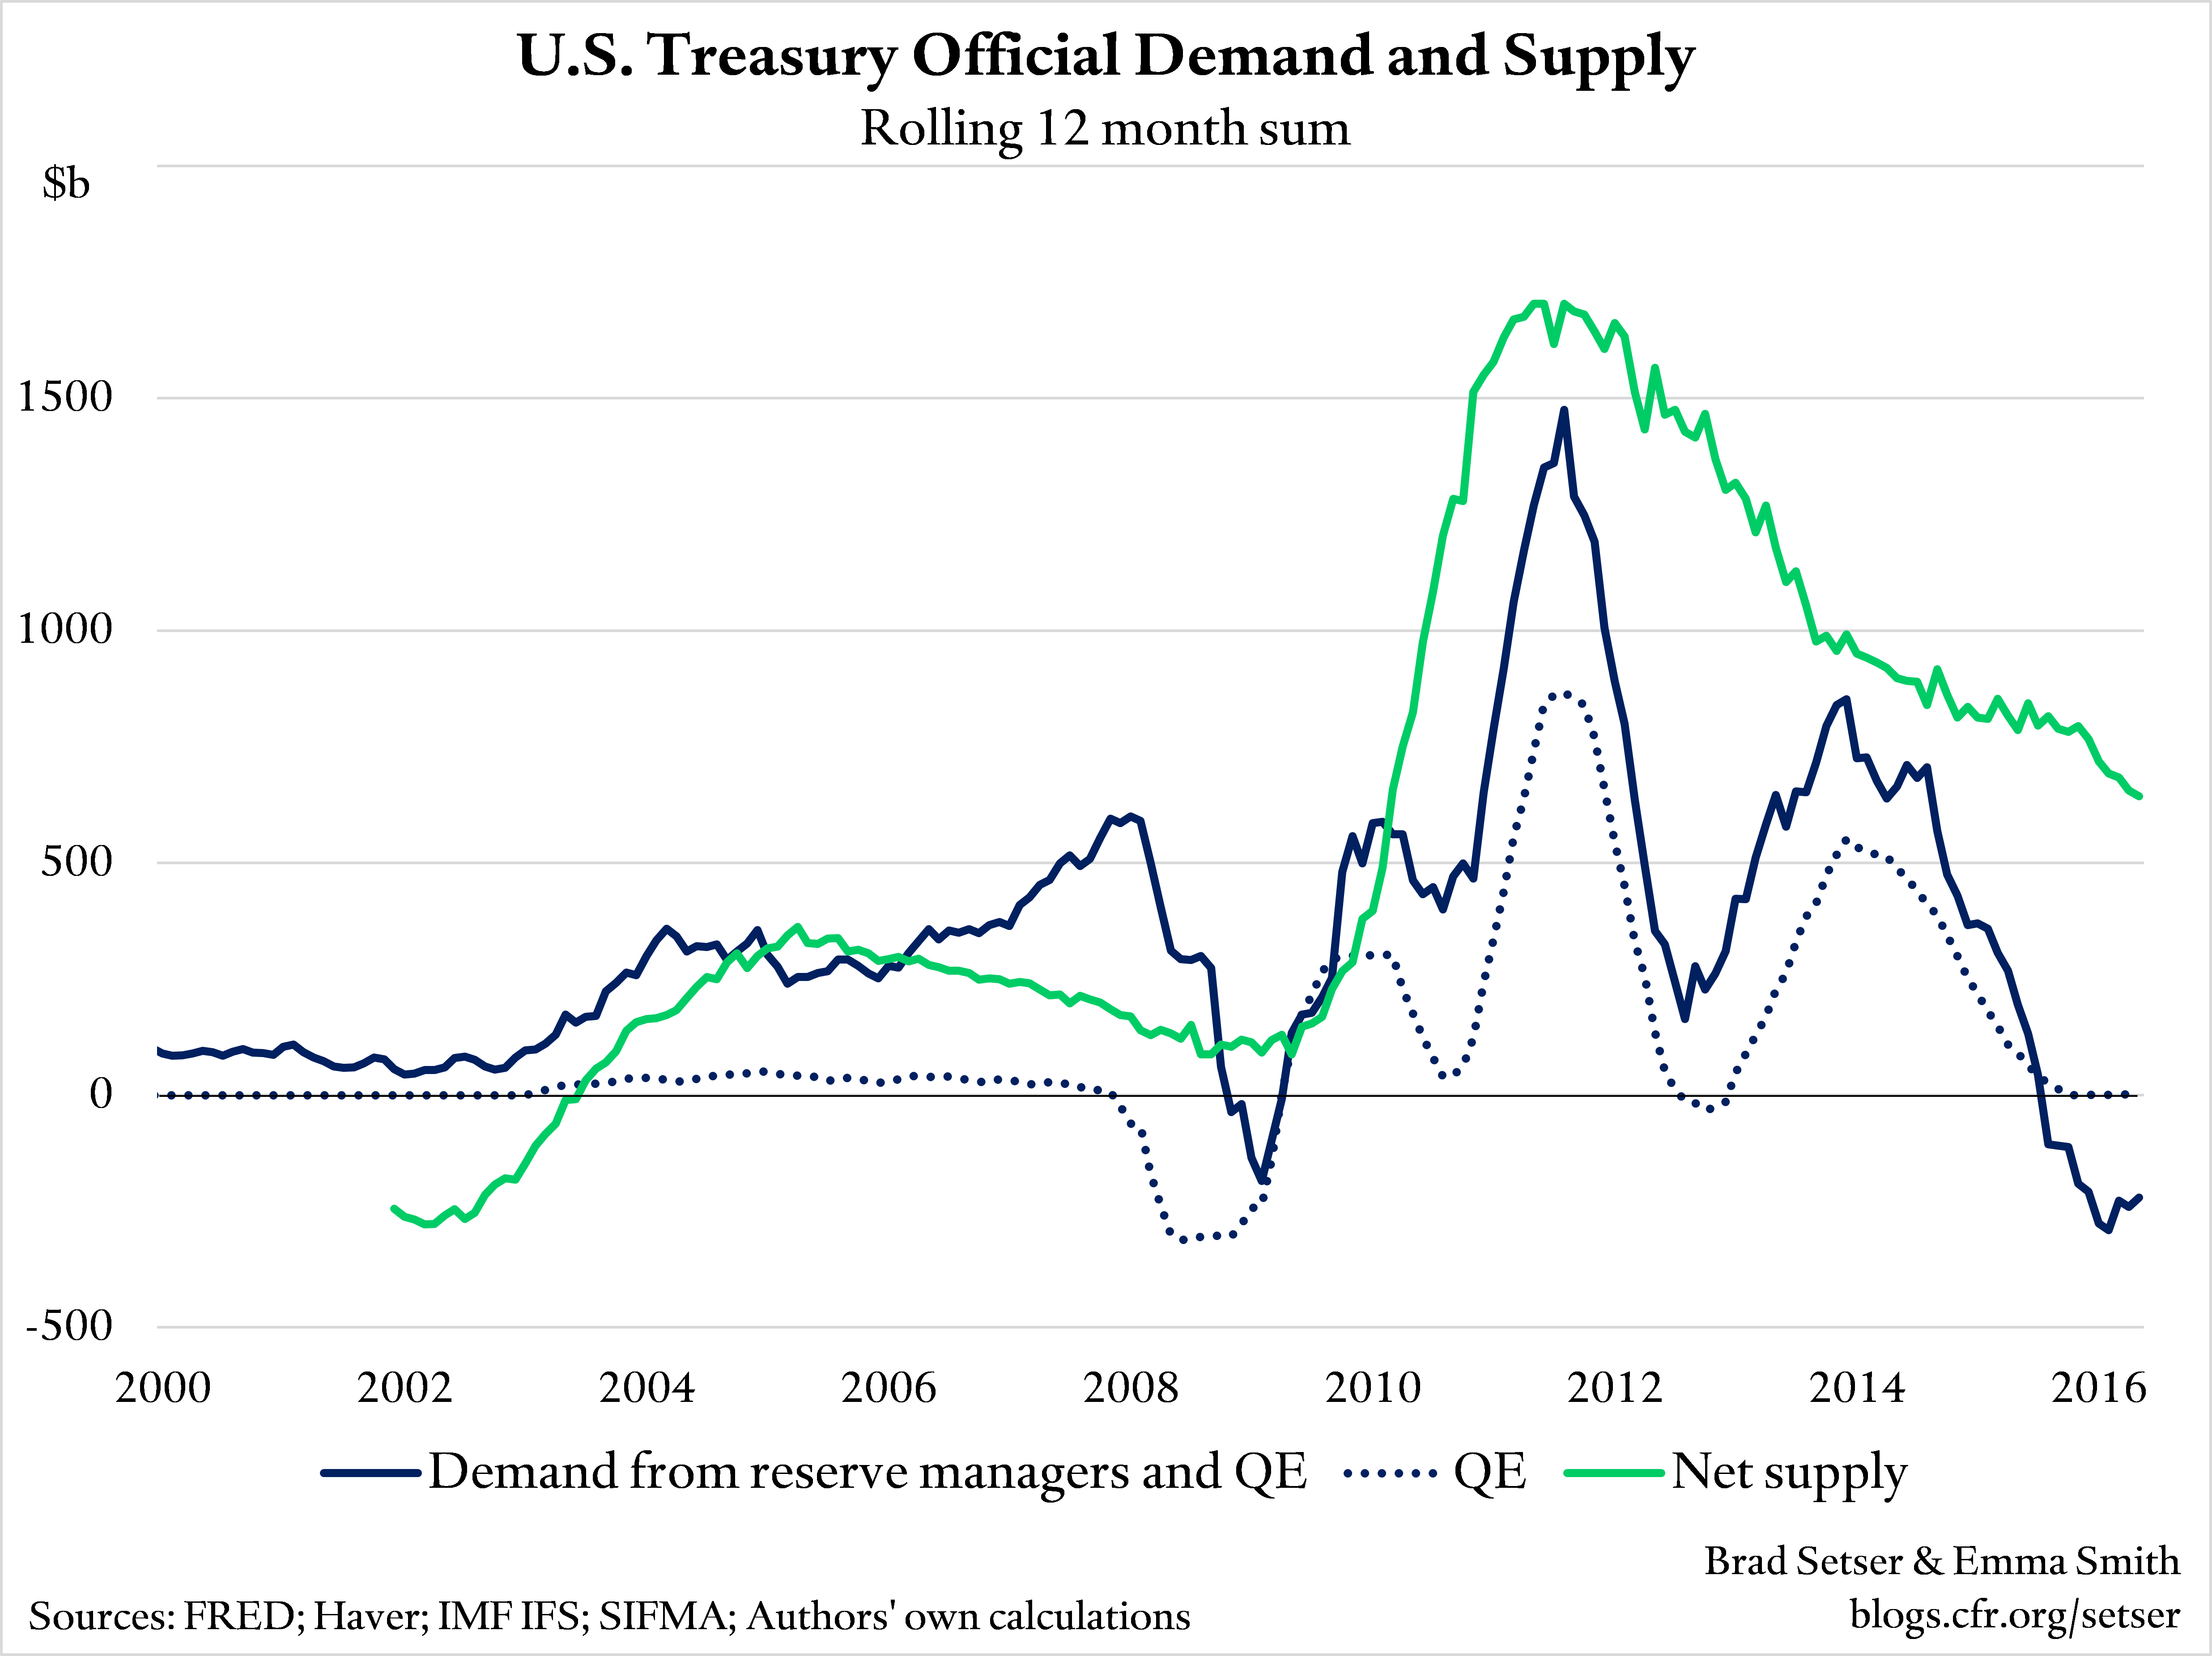
In the U.S., the supply of Treasuries has exceeded central bank demand since 2010. This is largely because the U.S. Treasury ramped up issuance of Treasury securities after the crisis (offsetting, it should be noted, a big fall in private bond issuance). Even as annual net issuance of Treasuries slowed from its peak of around $1.7 trillion to a little over $600 billion, it has remained above official purchases. Right now there isn’t any official bid for U.S. bonds. Reserve managers on net have been selling and the Fed hasn’t been buying.
More on:
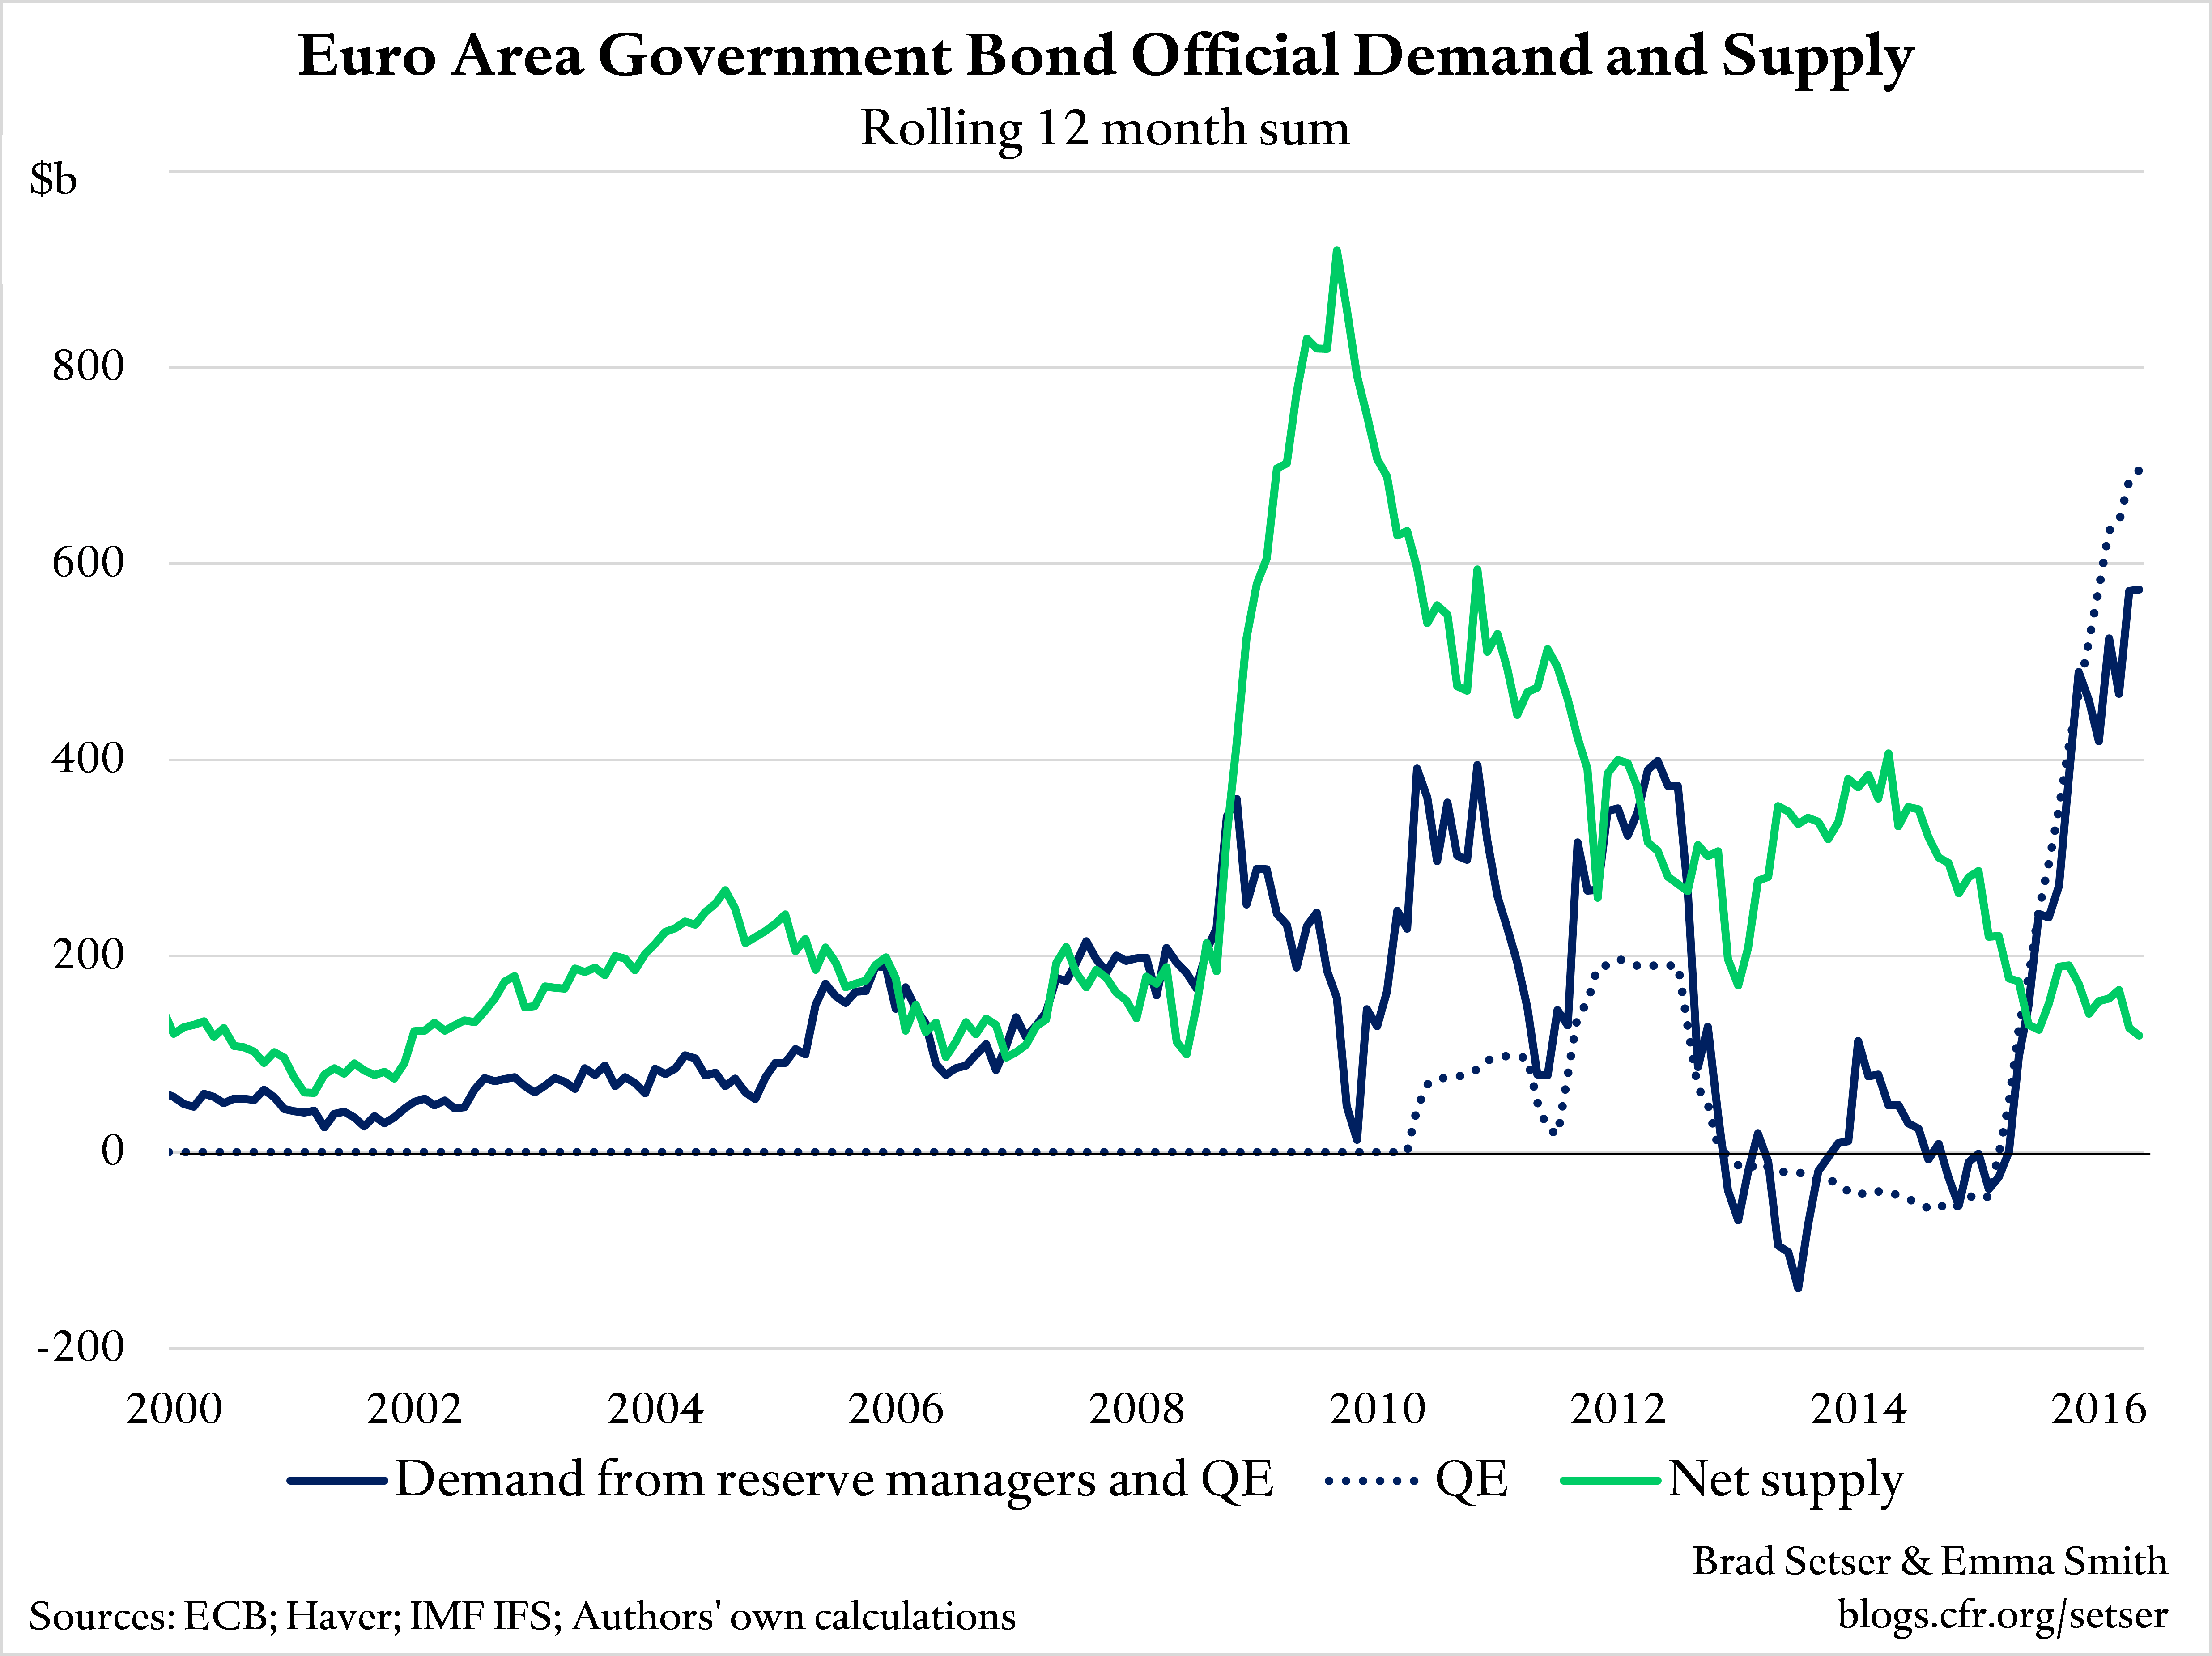
In contrast, official purchases in Europe and Japan during the period of "QE" well exceed net issuance.
Annual net issuance of eurozone government bonds peaked in the second half of 2009 at around $900 billion. It has since fallen by nearly 90 percent, to around $120 billion today. Much of this can be explained by the pursuit of austerity—in aggregate, the eurozone’s government budget deficit has fallen from a peak of 6½ percent of GDP to 2 percent. When only reserve managers were buying eurozone government bonds, the increase in supply exceeded official demand. But that obviously changed with the ECB’s QE program. While there has been renewed talk of fiscal easing in Europe—which would bring with it higher government bond issuance—current plans for 2017 don’t suggest any significant expansion. A modest structural easing in Italy likely will be offset by tightening in Spain and Portugal; Germany’s tiny 2017 easing will likely be offset by tightening in the Netherlands, and France’s fiscal stance is roughly neutral.
Official demand for Japanese bonds overtook supply at the beginning of 2013—just before the BoJ launched its most recent large-scale asset purchase program (“Quantitative and Qualitative Monetary Easing”). And since Japan tightened fiscal policy after QQE ramped up, the gap between the increase in supply and official demand has increased. With purchases of around 15 percent of Japan’s GDP and net issuance down to around 5 percent of GDP, the stock of bonds held in the market is falling fast.
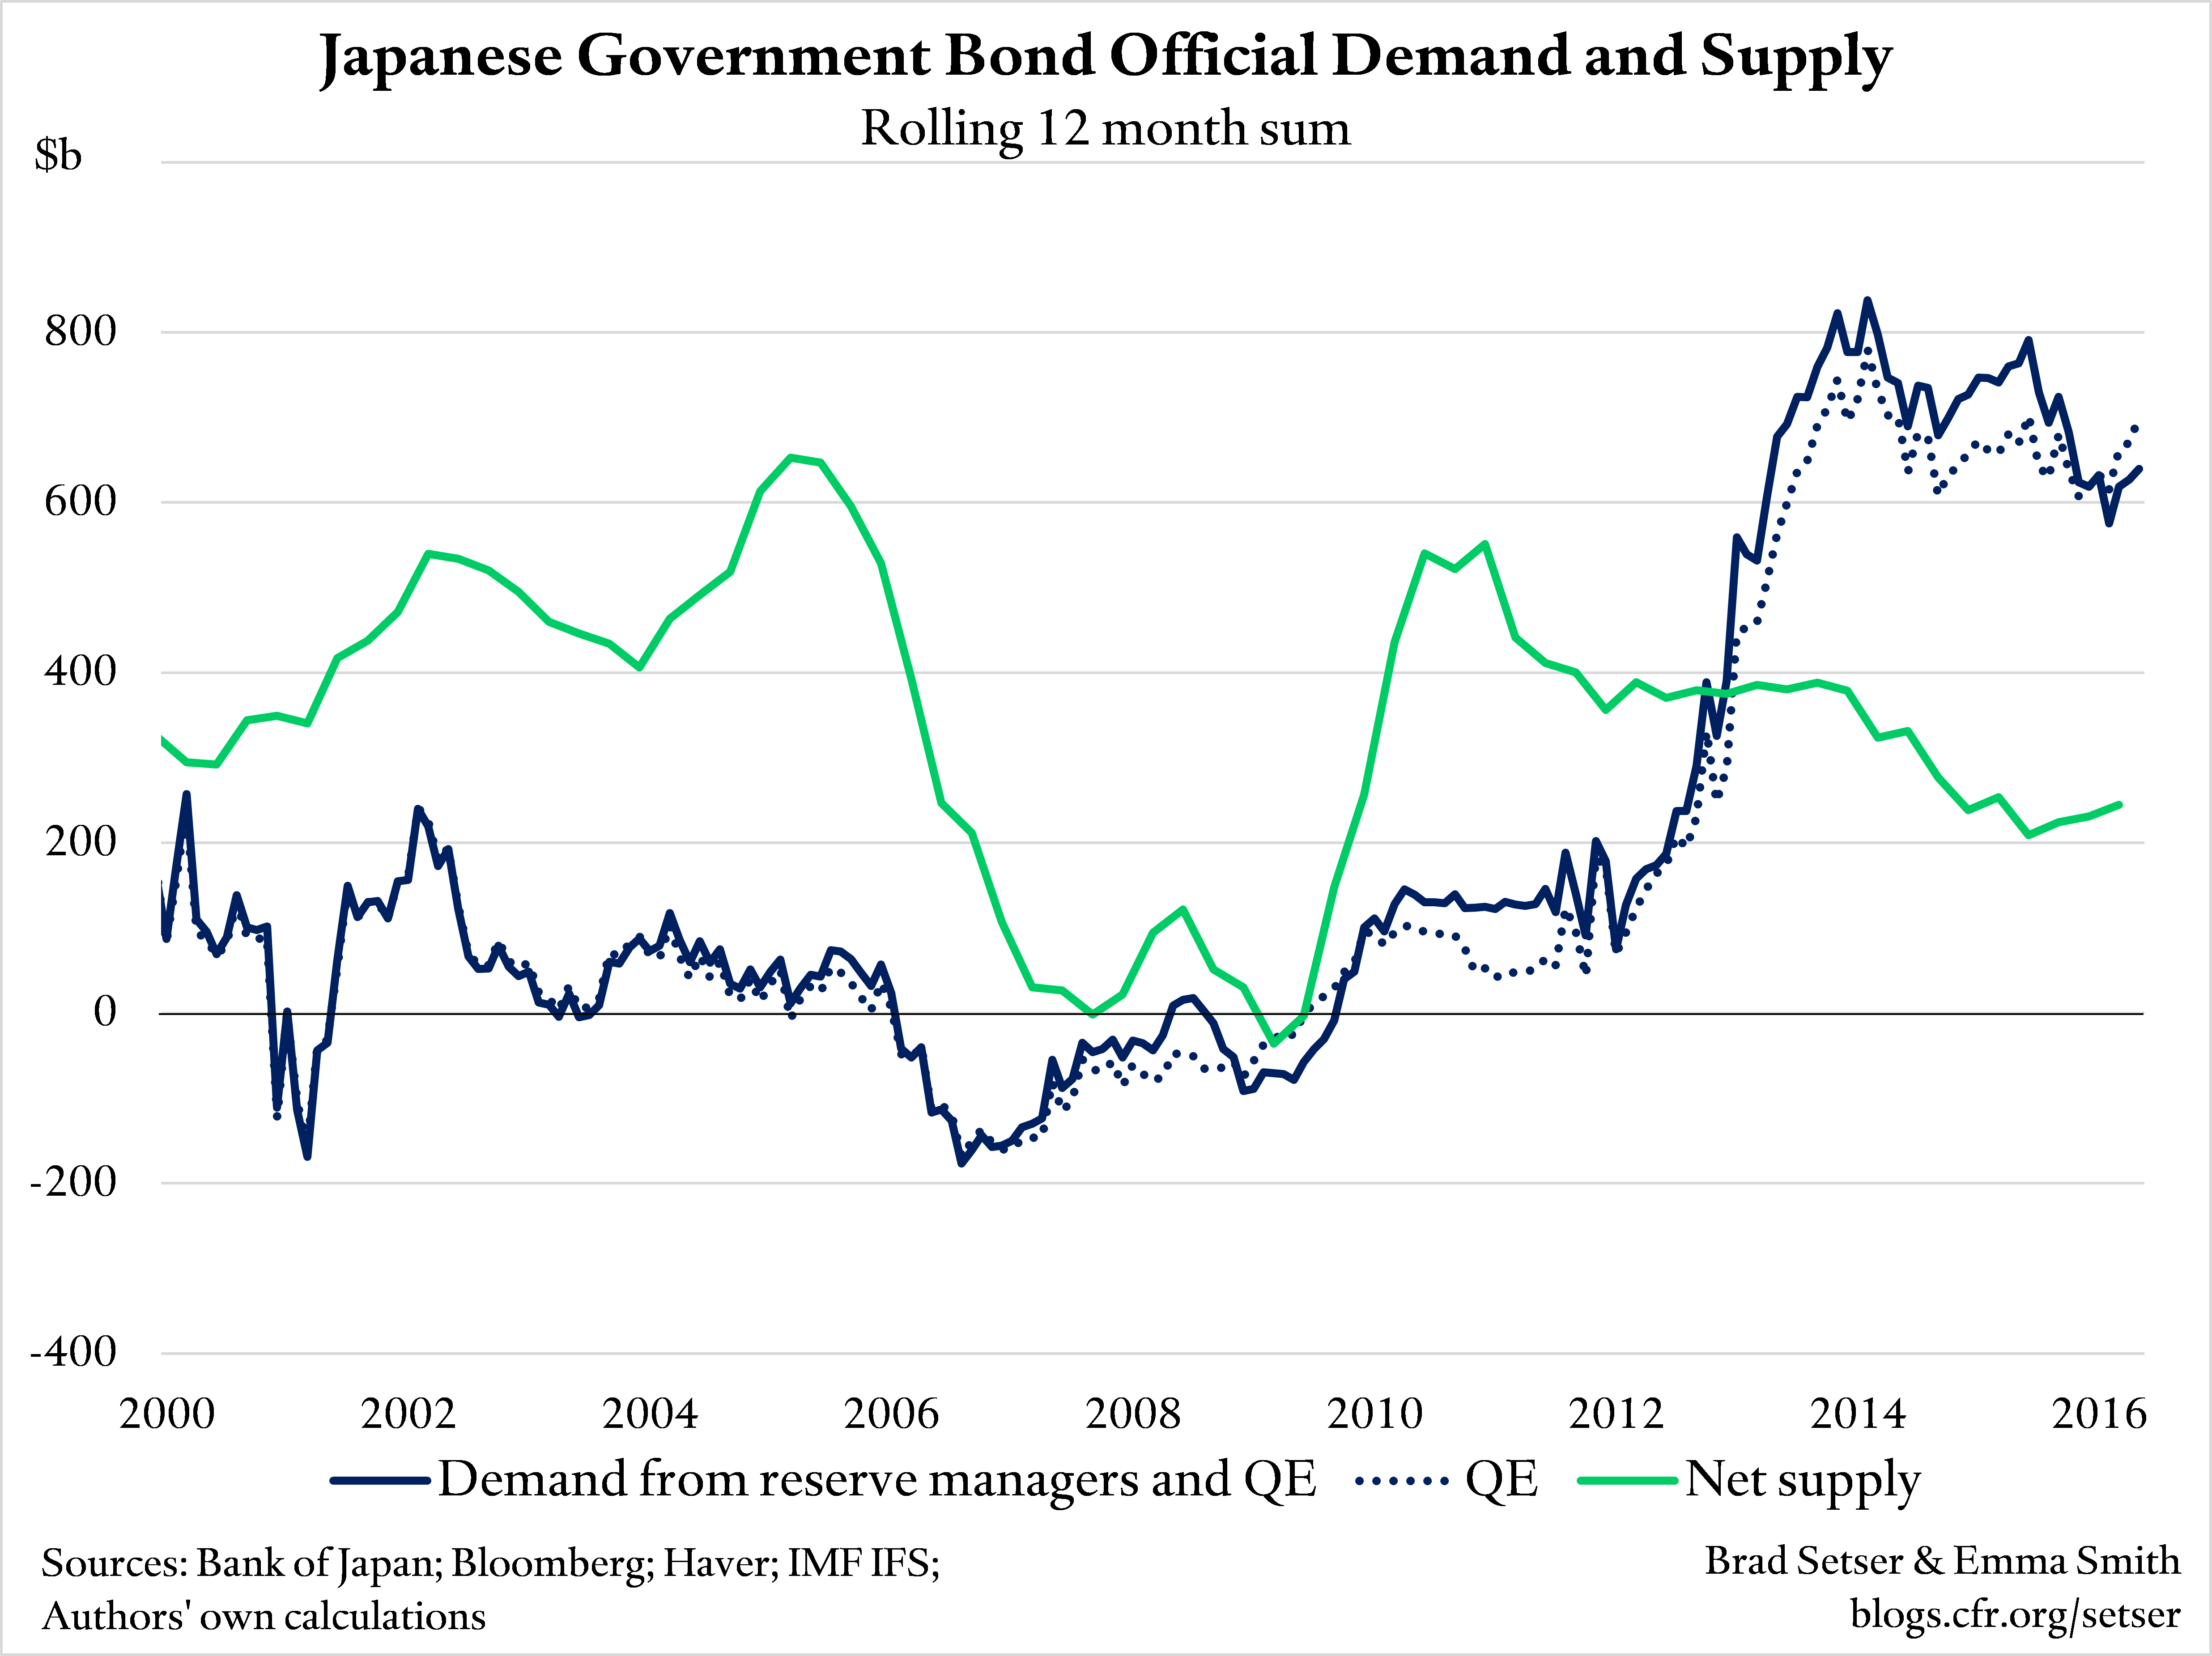
The current pace of official asset purchases implies that private investors need to reduce their holdings of eurozone bonds by about $450 billion a year, and Japanese bonds by about $370 billion a year. Hence concerns that the ECB and BoJ may run out of government bonds to buy.
That is part of the reason why the BoJ and the ECB have expanded the universe of assets they can buy—to include corporate bonds, and ETFs in Japan. And the BoJ has begun to move away from a set quantity of asset purchases to targeting the level of bond yields.
And presumably the absence of more issuance—relative to official purchases—in Europe and Japan has something to do with the dollar’s current relative strength. In a standard macroeconomic model, fiscal expansion helps strengthen the currency—offsetting the impact of monetary easing. And in a flow sense, the investors displaced by the ECB and BoJ have to go somewhere. The yield on U.S. Treasuries is looking relatively attractive at the moment.
We know these estimates are a bit rough. We didn’t include Agencies, or the European analogues to the Agencies (EIB, ESM and the like) in our calculation of net supply of safe assets. We assumed that all reserve demand for foreign assets goes into bonds, when in practice some important reserve managers have a small portion of their portfolio in equities. Our goal was simply to provide a rough cut of how official demand has compared to the straight supply of government bonds once you factor in foreign exchange reserve demand; our suspicion is that the "hydraulics"—the raw sums that the market is either absorbing or coughing up— matter.