 Online Store
Introduction
Over the last several decades, governments have collectively pledged to slow global warming. But despite intensified diplomacy, the world is already facing the consequences of climate…
There Are a Couple of Reason To Think the U.S. Trade Deficit Will Continue to Rise This Year
More on:
The May trade data is out, and, the trade deficit widened.
Imports jumped. Real non-petrol goods imports rose by $2 billion from April. That makes some sense. They had been a bit too soft in the first part of the year for an economy that continues to grow, with both March and April on the weak side.
Exports continue to stall. May’s real non-petrol exports were down about $2 billion from April, but I would not focus on the month to month fall. The underlying trend remains pretty clear: year-over-year non-petrol export volumes are down two to three percent. Weak global growth and the lagged impact of the dollar’s rise in 2014 and all. This is unlikely to change in an real way over the course of the year: the fall in exports to commodity exporters should slow, but Brexit uncertainty will weigh on Europe and the renminbi’s slide will make China a bit more competitive.
And going forward there will be an additional dynamic at play: the improvement in the oil balance is going to (partially) reverse.
The following chart shows all of the trade data as a trailing 3 month sums (see Calculated Risk for the monthly data), and it uses the nominal rather than the real data. March offsets May, so the non-petrol deficit looks to be heading down. As the March and April data points drop out, that is likely to change. But what really stands out—apart from the 2013 to 2015 rise in the non-petrol deficit, is the spectacular fall in the petrol deficit. In the first few quarters the U.S. oil deficit was tiny.
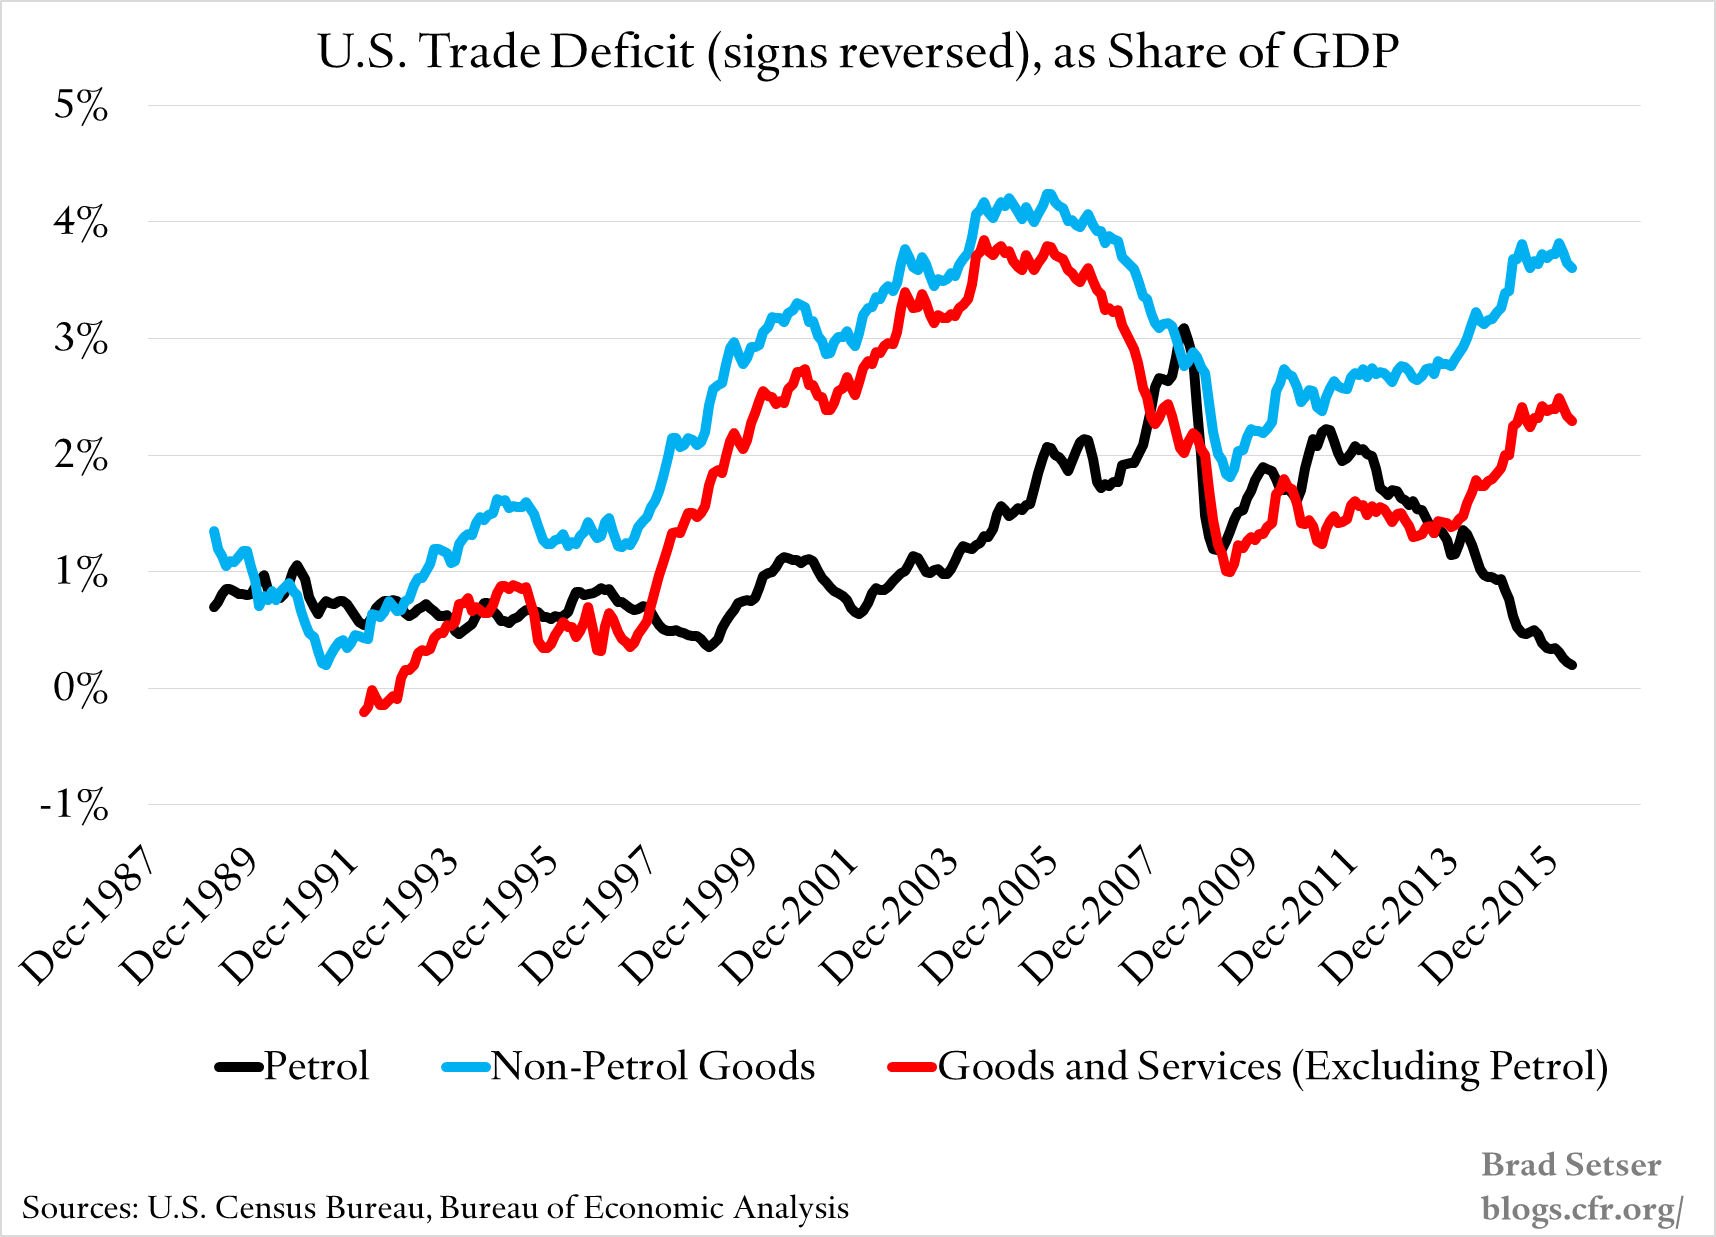
It is safe to project that this will change. The oil import bill is price times quantity. Prices are going to be higher than the $30 a barrel the United States paid on average for imported crude in the first five months of the year. And with U.S. crude production now trending down, import volumes will start inching up. The monthly data actually already shows a rise in June.
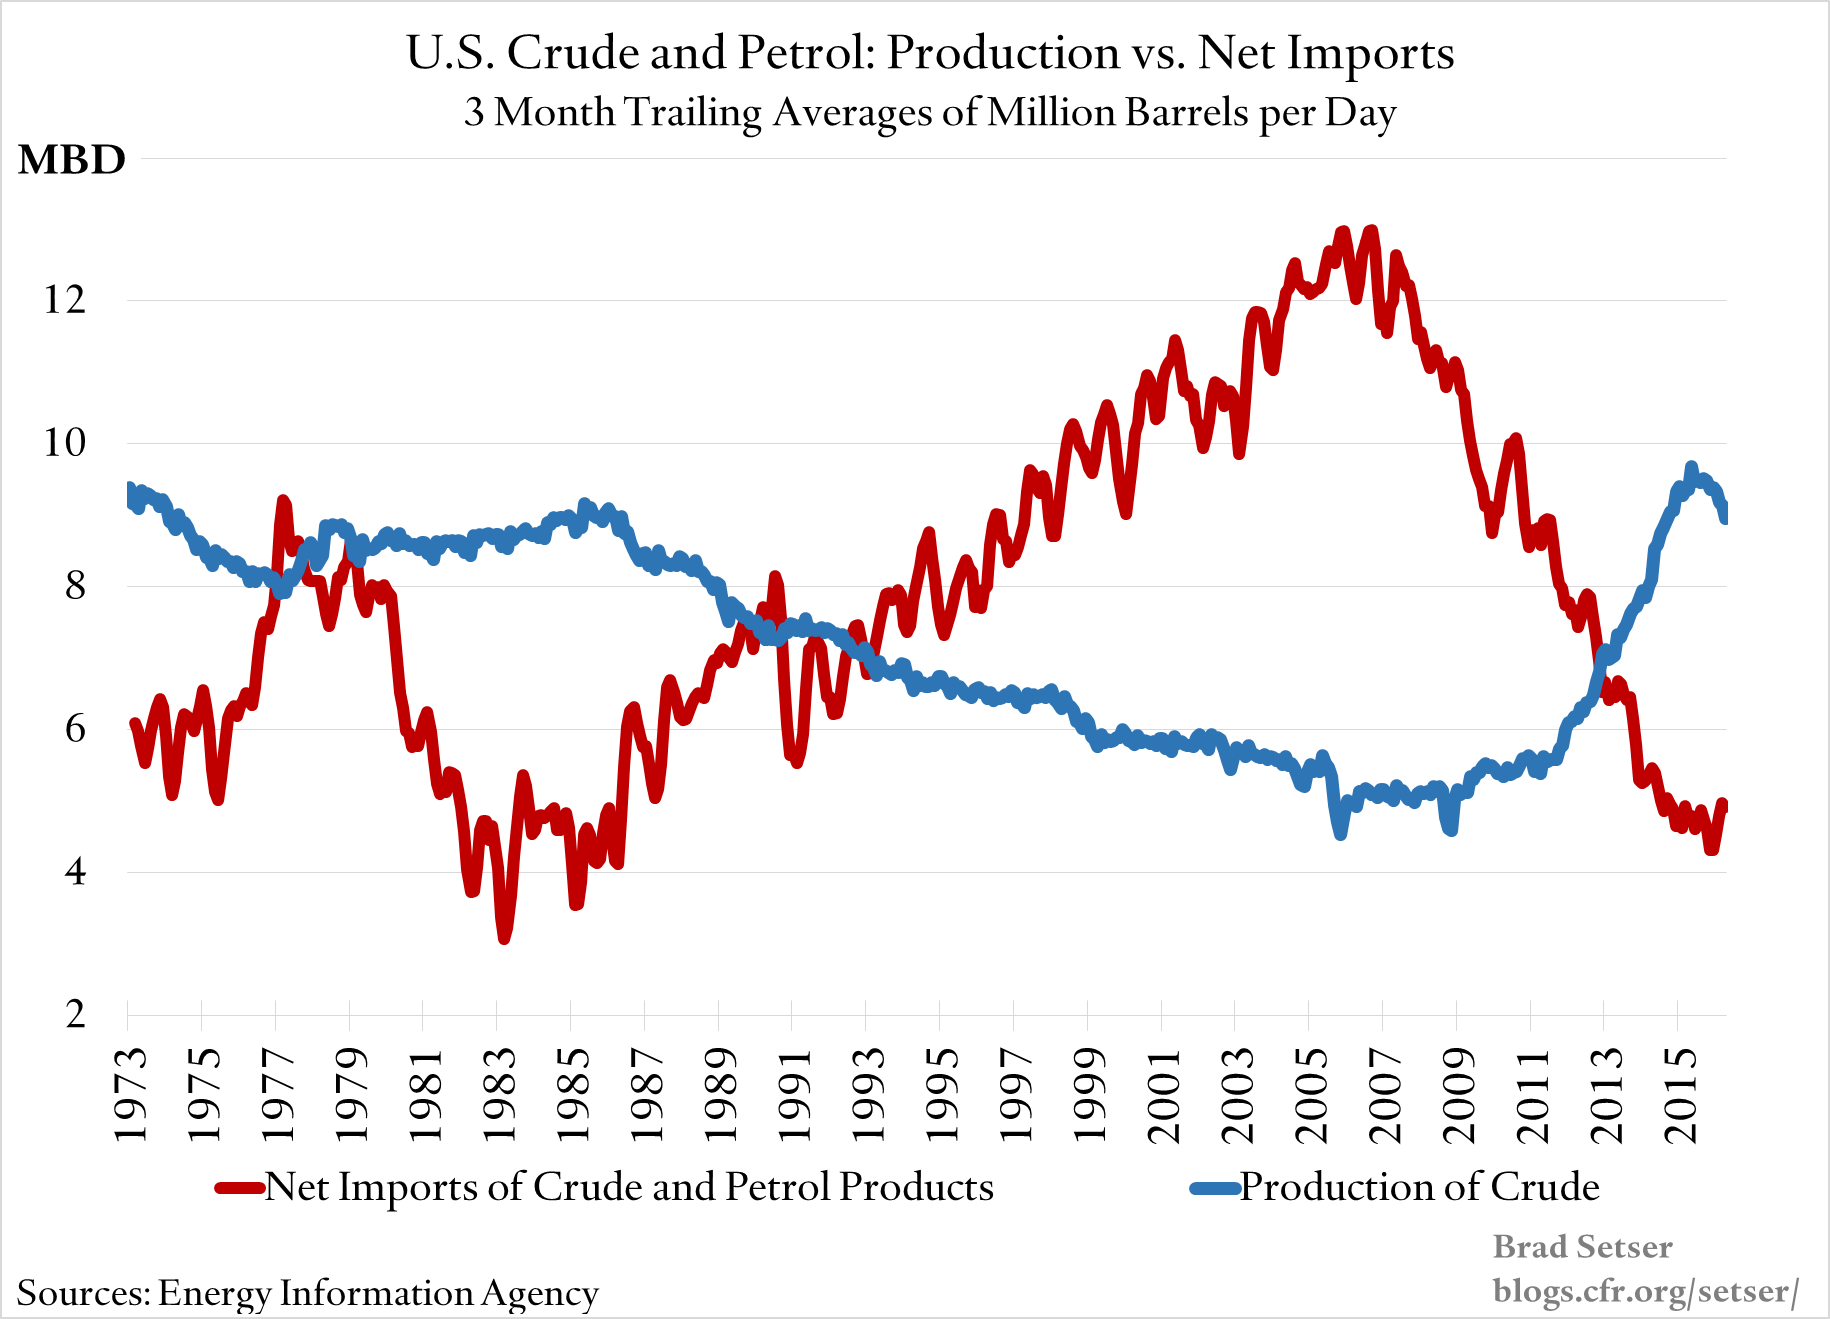
The impact isn’t going to be all that big. The difference between 5 million barrels per day (MBD) at $30-a-barrel and say 7 MBD at $50-a-barrel is about $75 billion a year, or 40 to 50 basis points of GDP. And it will take a bit of time before the United States is importing, on net, 7 MBD. Net imports in the last four weeks of Energy Information Administration data (June) were around 6 MBD.
But it does imply that for the first time in several years changes in the non-oil balance will no longer be masked by steady falls in the U.S. oil import bill.
So far this year, real non-petrol goods imports are about flat year over year, while real goods exports are down almost 3 percentage points. Project that out and the non-petrol goods deficit will grind wider through the rest of the year, and subtract something like 25 basis points off growth in 2016.* And if import growth picks up, that could easily be bigger. May’s real non-petrol deficit (goods) was the first month this year when the real non-petrol goods deficit was clearly larger than its average in the 4th quarter of 2015.
* I am leaving services out for two reasons. The "real" data is only available for goods. And the monthly services data is often heavily revised, as it depends more on estimation than the goods data. Plus nominal service export and imports are more or less flat, so there isn’t much of a story to tell.
More on: