 Online Store
Introduction
Over the last several decades, governments have collectively pledged to slow global warming. But despite intensified diplomacy, the world is already facing the consequences of climate…
When The Trade Data Does Not Add Up
More on:
This is not a post about China, or the various discrepancies in the Chinese data.
It is about a rather puzzling thing that I only noticed as a result of the Brexit debate.
The bulk of the UK’s surplus in services come from trade with non-EU countries (services exports to the EU are large, but so are imports—Tuscan and French vacations?). See this chart (h/t Toby Nangle).
A big part of the non-EU surplus in services comes from the United States. In 2015, the UK reported a 27 billion GBP (just over $40 billion) surplus in services trade with the U.S. and an overall surplus in goods and services with the United States.
The funny thing? The U.S. also thinks it runs a surplus in services trade with the UK. A $14 billion surplus in 2015, for example.
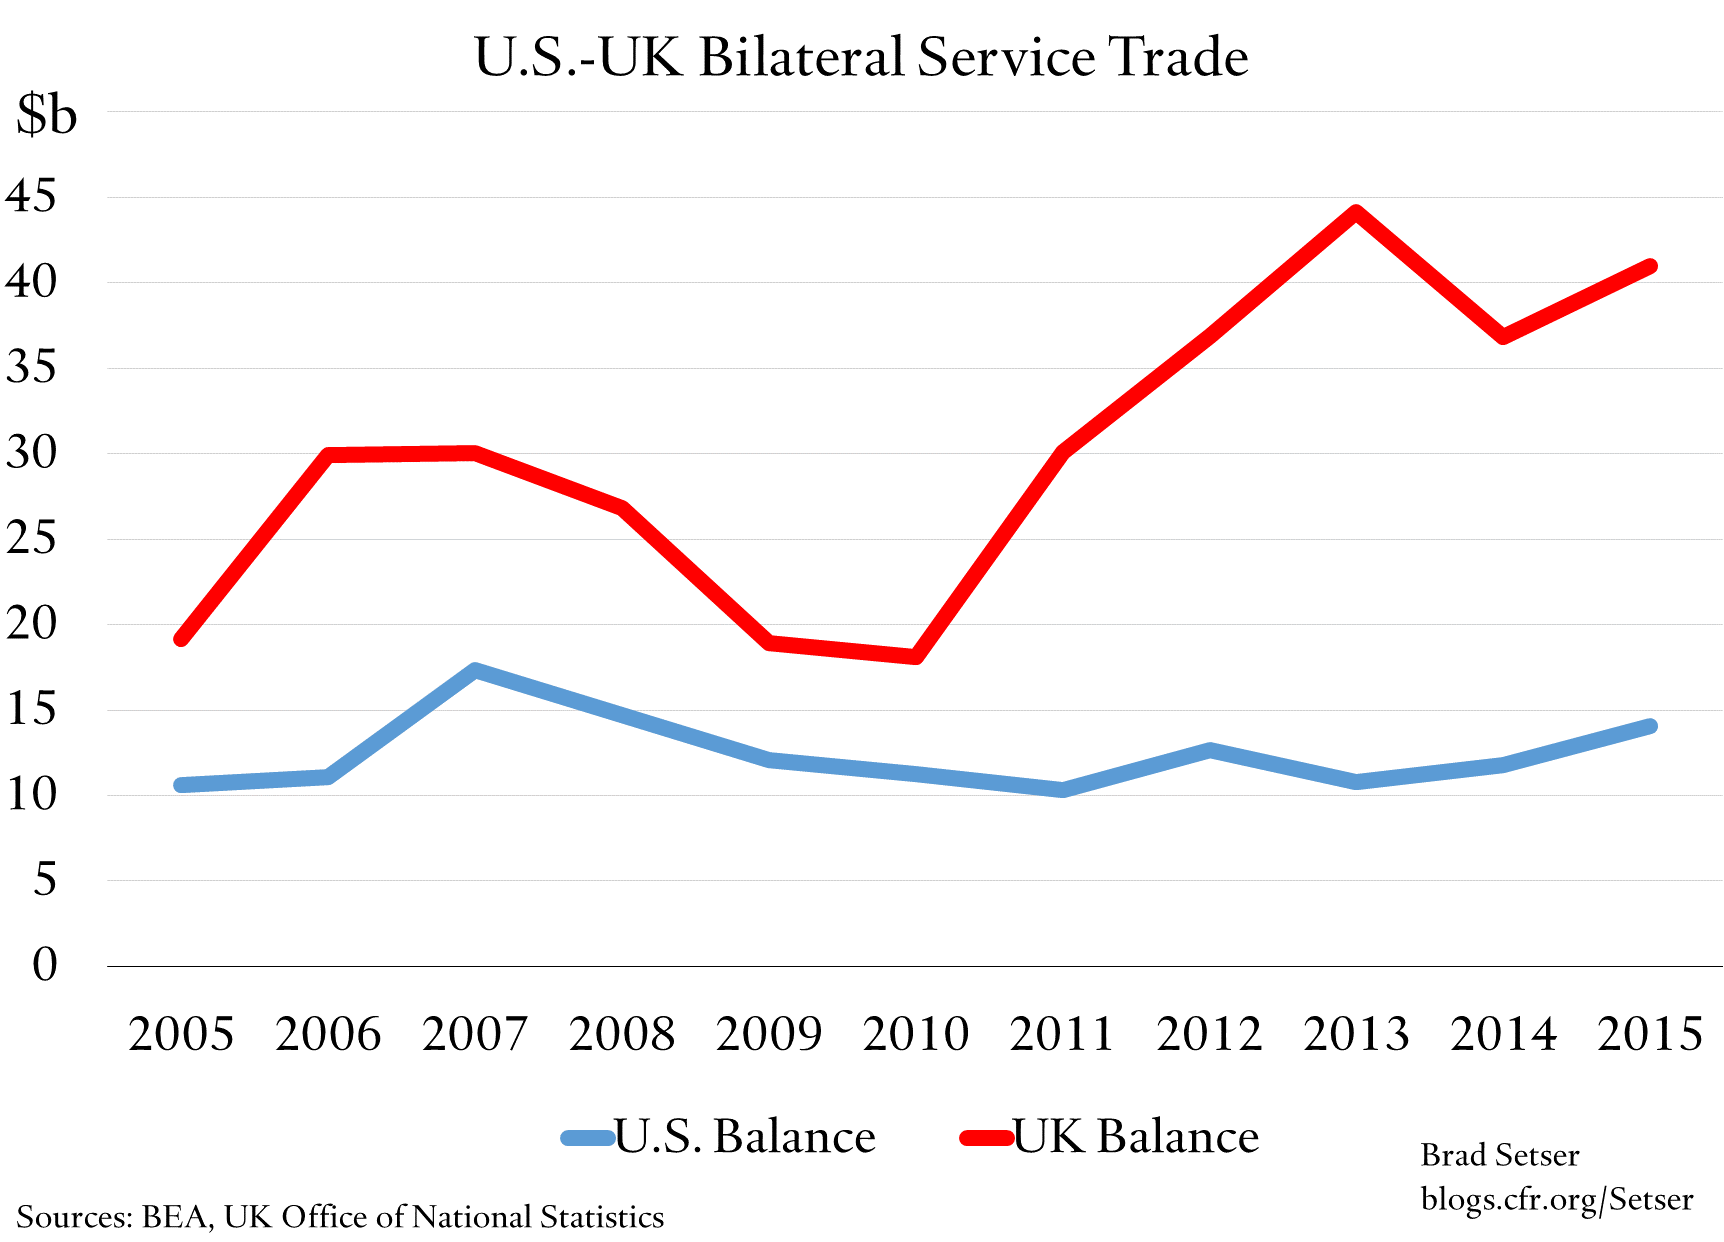
It is pretty hard to square those two data points. UK data is from the Office of National Statistics’ Pink Book, U.S. data is from the Bureau of Economic Analysis (BEA), table 1.3 of the "International Transactions" data set.
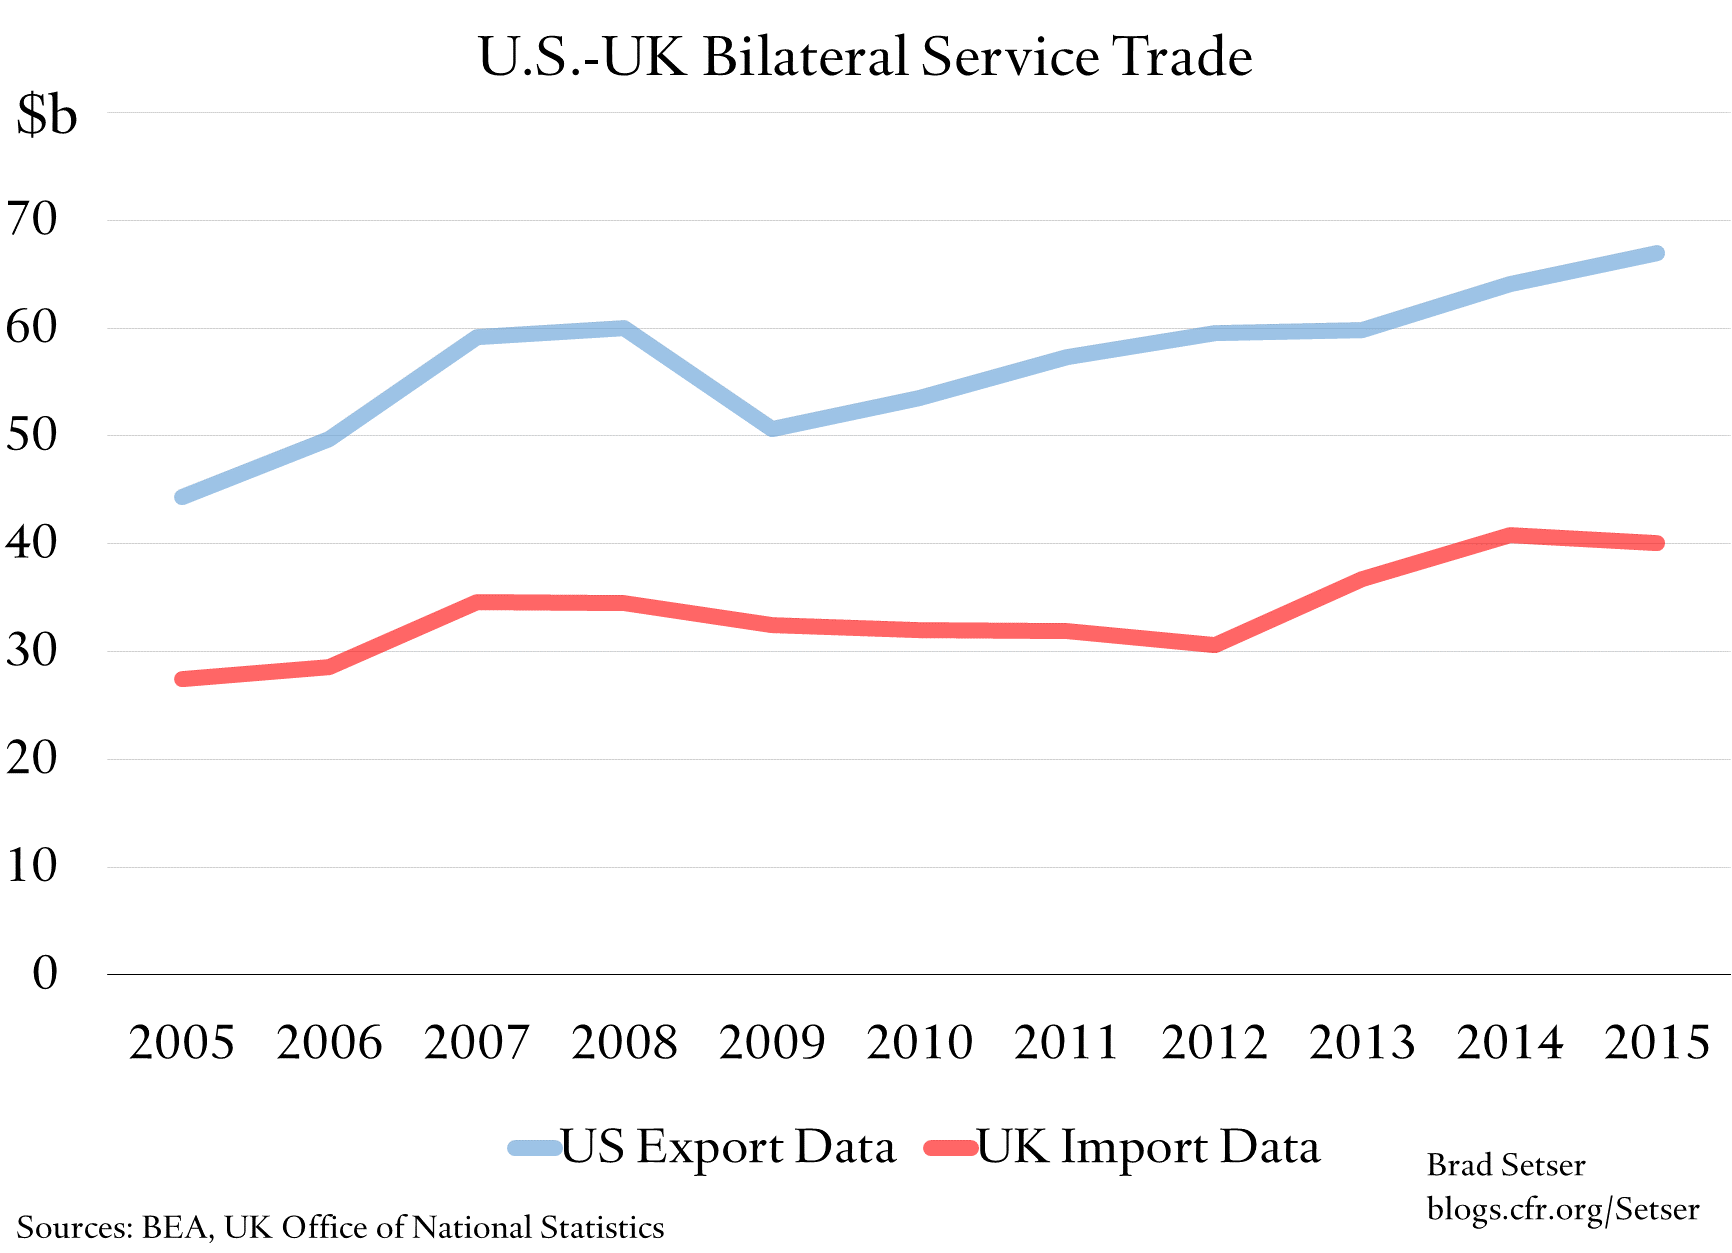
It turns out that the U.S. thinks it sells more services to the UK than the UK thinks it buys:
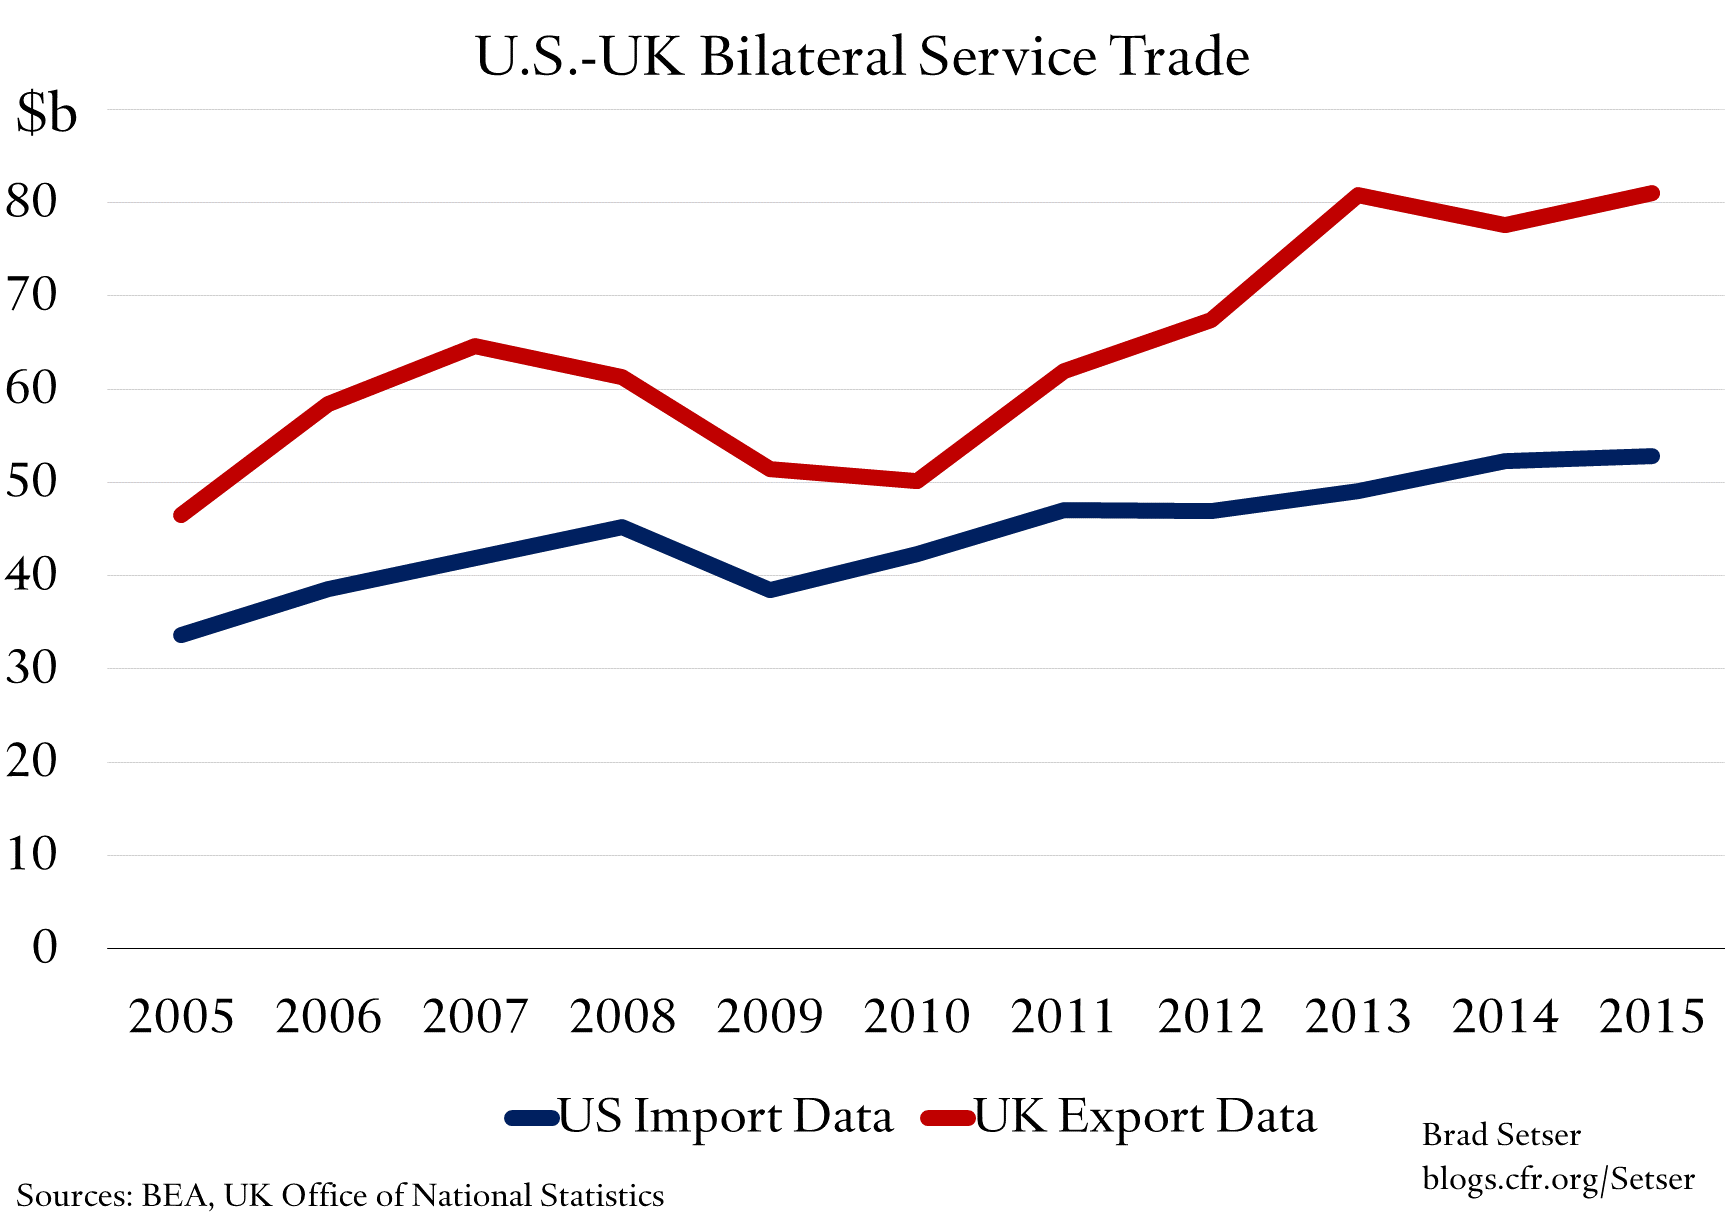
And the UK thinks it sells more services to the U.S. than the U.S. thinks it buys.
My guess is that such discrepancies are actually common in the services trade numbers. Goods trade is calculated by customs bureaus. Lots of the numbers on services trade come from surveys, estimates, and the like.
More on: