Kansas is flat, the world is not …
More on:
To paraphrase the New Economist, the Financial Times must think the world is flat. They just gave Tom Friedman the inaugural Financial Times/ Goldman Sachs book prize last week - for a book based on the metaphor that the world is "flat." That is Friedman-speak for a more level global playing field, and increasing competition from China and India. ...
Tom Friedman is not my preferred globalization guru, I am partial to the FT's own Martin Wolf. And if I had to pick an image for today's world economy, "flat" would not come to mind either.
Some key economic variables certainly have been flat:
- The renminbi/ dollar has been pretty darn flat since the early 90s.
- The riyal/ dollar has been flat for a long-time too (the riyal is the Saudi currency).
- The US yield curve is starting to look a bit like a Kansas wheat field as well. The two year v. ten year Treasury spread is pretty small.
- Median real wages in the US have been pretty darn flat. See the EPI's data, via Kevin Drum.
- Median household income has been flat since roughly 2000 as well. See Kash at the Angry Bear.
- Credit spreads in the US are pretty thin, which is not quite the same as flat. ... But some folks are betting that they will stay thin for some time. Credit spreads have fallen, but some folks are hoping that they will stay flat ..
But many others are anything but flat.
- China's savings rate hasn't been flat - it has been rising. And now it looks a bit like the Himalayas.
- The US savings rate has not been flat either - it is falling.
- Household spending consequently has not been flat, even though wages have been. Paul Kasriel calculates that the in the third quarter, Americans spent about $500 billion more than they earned (on an annualized basis). His calculation includes spending on residential property - it is in some sense a measure of household's need for financing. And the resulting chart (chart 5) consequently looks a bit like the Grand Canyon. Add it together with the federal budget, and you have a pretty good idea of why the US is running a record current account deficit. Hat tip: Gretchen Morgenstern.
- Residential investment as share of GDP has not been flat in the US -- or in Spain, I suspect. Check out the graphs from Paribas that have been reproduced (with English explanations) by Jerome a Paris. Hat tip: Tech Policy. Update: here is the Paribas report in English.
- The US manufacturing sector's share of US GDP has hardly been flat; by most account's the US tradeables sector is shrinking too. An economy that - to quote Patrick Artus - specializes in the production of non-traded services is taking on a ton of external debt. That worries me - and Paul Krugman.
- If Steve Miller gets his way, wages at Delphi won't be flat either. They will fall like the US savings rate ...
- Investment in China hasn't been flat - particularly when measured in dollar terms. Think 40% of 1 trillion in 2000, and 50% of almost two trillion in 2005 ... an increase from $400 b to around $1000 b ...
- China's exports have been anything but flat.
- Same with China's reserves, which are now heading towards $900 billion (including reserves transferred to state banks).
- Oil prices have not been flat.
- That is particularly when oil prices are compared not against a general price index, but against an index of traded goods. One barrel of oil now buys far more computing power than it ever did in the past. It also buys a lot of Chinese made manufactures ... Right now, though now though, the oil windfall is generally being saved, not spent. Oil is being traded for (expensive) US financial assets, not (cheap) Chinese goods. So key macro variables like savings rates have not been flat in the oil exporters.
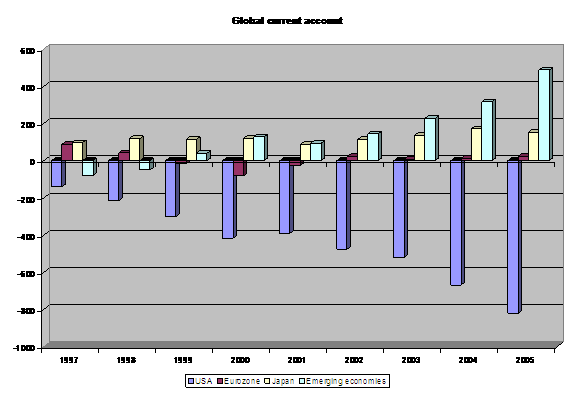
The global flow of funds hardly has been flat - enormous (and growing) pools of savings are being sent from savings rich to savings poor countries. In practice that means savings is flowing from poor countries to one very rich country, the US. Interestingly, the current account surplus of the eurozone has been pretty flat since 1997.
As this graph shows, the US deficit has grown - and the offsetting surpluses are found in the world's emerging and developing economies.
Chart 1
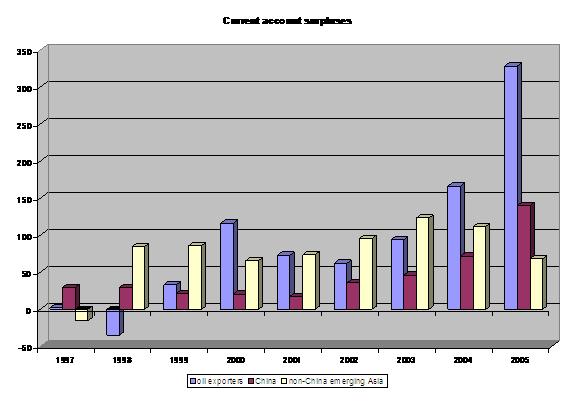
And those surpluses are rising most rapidly in China and the world's oil exporters. Emerging Asia outside of China swung into surplus back in 1998, the recent increase in Asia's surplus is all China.
Chart 2
The funny thing is that China's surplus has been rising at the same time as the surplus of the oil exporters - a rather surprising development given that China, like the rest of Asia, imports a lot of oil. China's oil import bill has more than doubled over the past few years. And since China is an oil intensive economy, its oil import bill is now something like 4% of China's GDP. That compares with a US oil import bill of around 2% of GDP.
Which means that China's non-oil current account surplus has not exactly been flat either.
Mark me down in Cylde Prestowitz's and Stephen Roach's camp on this one. Roach:
"With all due respect to Tom Friedman, there's nothing flat about this unbalanced global economy. The image of a "flat world" is most appropriate for the endgame of globalization. ... In the meantime, the global economy is distinguished far more by its disparities and tensions -- and how the resulting imbalances are likely to be vented in world financial markets."
A world where one major economy consumes something like 70% of its income and another something like 40% of its income is not very flat.
And we should not forget that there remains an enormous chasm between per capital income in China (roughly $1,500 at market exchange rates) and per capita income in the US ($40,000). We may be headed for a flat world, but we are not there yet ...
More on:
 Online Store