 Online Store
International efforts, such as the Paris Agreement, aim to reduce greenhouse gas emissions. But experts say countries aren’t doing enough to limit dangerous global warming.
Latinos May Choose the Next U.S. President

More on:
A recent Pew Hispanic Center report on trends in Latino voter participation counts a record 24 million Latinos as eligible to vote in November’s presidential election (11 percent of all potential voters). It also finds that Latinos are particularly important in several battleground states. Their rising numbers and geographic concentration suggest that if and how Latinos vote on November 6 could determine the race.
While a large voting bloc for several election cycles now, Latinos have yet to fully wield their potential political power. Part of the reason is turnout—few Latinos make it to the polls on Election Day. In 2008 only half of eligible Latino voters cast ballots versus 65 percent of blacks and 66 percent of whites.
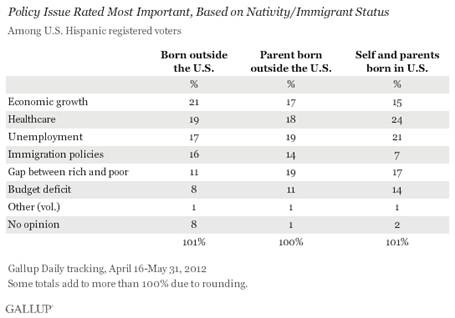
Latinos are also a heterogeneous bunch with vast differences across the population; for instance the priorities of Florida’s conservative Cuban base are vastly different from Arizona’s predominantly Mexican-American constituency. Complicating political appeals even further, a recent Gallup poll shows that Latinos’ political priorities differ by generation. As shown in the chart below, foreign born Latinos care most about economic growth, second generation citizens focus on unemployment, and third generation members prioritize healthcare.
Still, despite these obstacles and divides, 2012 looks to be the year of the Latino voter. In the swing states of Colorado, Nevada, and Florida, Hispanics make up between 13 and 16 percent of the voting population. Looking at past history and current polling preferences, these demographics strongly support the president over his Republican rival. In Nevada a whopping 78 percent of Latinos prefer Obama to Romney, in Colorado it’s 74 percent, and even in more conservative Florida it is 61 percent. Obama’s current lead in these three states (between 1.4 and 3.9 percent) reflects in large part these votes.
These three states matter. As the New York Times interactive electoral map illustrates (you can create your own scenarios here), if Colorado, Nevada, and especially Florida swing to Obama (and assuming he prevails in “solid” and “probable” democratic-leaning states), he wins. By contrast, Romney must triumph in these battleground states to have a chance. The upshot? This may be the year Latinos choose the next U.S. president.
More on: