 Online Store
Introduction
Over the last several decades, governments have collectively pledged to slow global warming. But despite intensified diplomacy, the world is already facing the consequences of climate…
More on the fall in private borrowing and the rise in the fiscal defict
More on:
The chart that supported my previous post attracted a fair bit of attention. But it was cobbled together at home and only looked at data over the past few years. With help from the CFR’s Paul Swartz, I looked at the quarterly data over a longer time period.
The story is clear. Government borrowing has increased dramatically. It topped 15% of GDP in the last two quarters of 2008. In 2007 and early 2008 it was more like 3% of GDP. But private borrowing has fallen equally sharply. Total borrowing by households and firms fell from over 15% of GDP in late 2007 to a negative 1% of GDP in q4 2008.
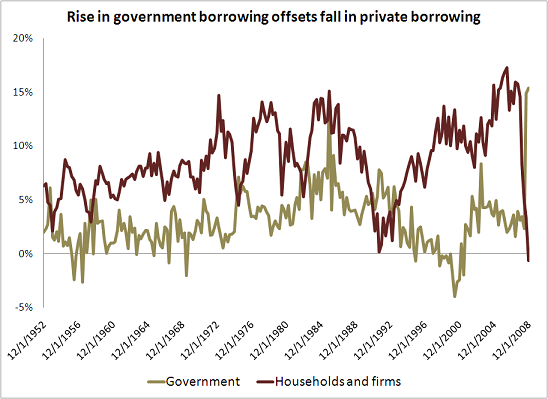
Negative borrowing by households and firms means, I think, that households paid down their debts in the fourth quarter.
It hardly needs to be noted that the fall in borrowing by households and firms in late 2008 was exceptionally rapid. A stronger economic cycle implied that the magnitude of counter-cyclical fiscal policy also needed to be ramped up.
The disaggregated data on borrowing by households and firms is also interesting. Household borrowing rose to record levels in 2003 and remained high through early 2006. Household borrowing fell in 2007, but for a time this fall was offset by a rise in borrowing by private firms. Borrowing by firms actually peaked in the middle of 2007 at a higher level than during the dot come investment boom. Chalk that up to a surge in leveraged buyouts and stock buybacks.

Both charts highlight the risk that worries me the most. In both the early 1980s and the first part of this decade, both the private sector and the government were large borrowers. And in both cases, borrowing rose faster than domestic savings, so the gap was filled by borrowing from the rest of the world. The trade and current account deficit rose. In the early 1980s, the US attracted inflows by offering high yields on its bonds. More recently, it did so by borrowing heavily from Asian central banks, together with the governments of the oil-exporting countries. But now yields are low (even after the recent rise in the yield on the ten year Treasury bond), and need to be low to support a still weak US economy. And China (and others) are visibly uncomfortable with their dollar exposure; banking on their continued willingness to finance a large external deficit seems like a stretch.
The challenge this time around consequently will be to bring down the government’s borrowing as private borrowing resumes.
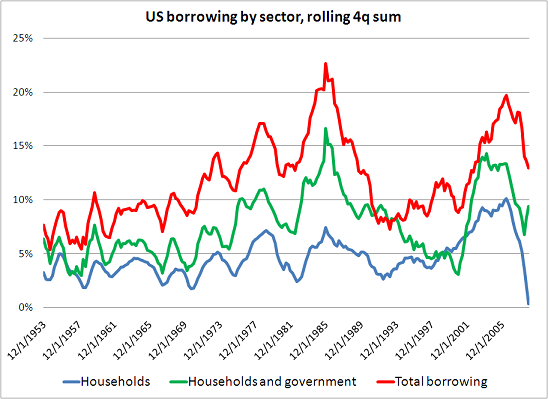
Update: Household, household and government and total borrowing over time on a rolling four quarter basis:
And the quarterly data.
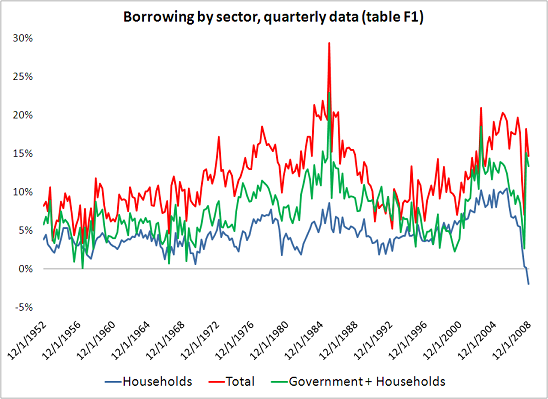
All data comes from table F1 of the flow of funds.
The downturn in total borrowing in the rolling four quarter sum reflects a low level of total borrowing in the second quarter (i.e. before government borrowing ramped up both to fund the fiscal deficit and to finance the financial sector). But even in the fourth quarter of 2008, total borrowing wasn’t up ...
More on: