 Online Store
Introduction
Over the last several decades, governments have collectively pledged to slow global warming. But despite intensified diplomacy, the world is already facing the consequences of climate…
The q2 US current account data
More on:
The q2 US current account data poses two puzzles.
The first is the sharp drop off in official inflows in q2. They fell from $150b in q1 to $70b in q2. That fall was, incidentally, offset – mechanically – by a change in (net) FDI outflows. The large net outflow of q1 disappeared. Net private portfolio flows were more or less constant.
The second is the continued absence of any evidence of deterioration in the income balance. Or, if you prefer, the continued growth of dark matter. I am fairly sure Ricardo Hausmann and Federico Sturzenegger would argue that this the real puzzle is the unwillingness of some others to accept the evidence that the US has a lot of dark matter on its balance sheet. After all, the US seems to be able to continually conjure up additional dark matter whenever it is needed to keep the income balance positive.
The first isn’t really a puzzle. Not in my view. The US data is wrong.
Not wrong in the sense that the BEA made an error in their calculations. But wrong in a deeper sense. The BEA’s quarterly data is based on the TIC data, and the TIC data simply doesn’t capture all official inflows.
Why I am I so confident –
First, the last survey data revised total official inflows up by $130b between q3 05 and q2 2006. I expect a similar revision. The pattern here is very consistent.
Look at the gap between the unrevised data and the revised data in the following graph.
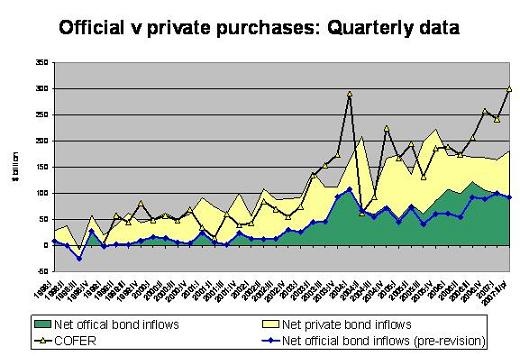
When the data for the last four quarters is revised, I expect that net official purchases will be revised up, and foreign private purchases will be revised down. Indeed, I would be surprised if net private bond inflows (foreign private purchases of US bonds net of US purchases of foreign bonds) are currently about flat. No doubt there has been some true private inflows form abroad, but I would bet the scale of those inflows is about equal to the scale of US purchases of foreign bonds.
Second, different US data sources don’t tell a consistent story. The BEA – using the TIC data – reports a $43.3b increase in foreign official holdings of Treasuries and Agencies in the second quarter. The New York Fed’s custodial holdings of Treasuries and Agencies increased by $90.8b over the same time period – that is a rather significant difference, and the FRBNY data in theory captures a narrower set of holdings (only those at the Fed) than the BEA’s data.
Third, $70b is just too small given the scale of official reserve growth in the second quarter, which I estimate to be close to $300b (The COFER data will offer a more definitive answer at the end of September). You don’t need to take my word for it though. Brazil, Russia, India and China combined to add $250b to their reserves. That total hasn’t been adjusted for valuation changes, but it is indicative.
I don’t think anyone really thinks the world’s central banks put less than a quarter of their reserve growth into dollar assets.
To be honest, China alone almost certainly bought more than $70b of US debt in q2, given it $125b or so in reserve growth.
Sum it all up and I expect that, once the revised data comes in, the overall increase in central bank’s dollar assets over the past four quarters will be close to $700b – only a bit less than the US current account deficit. Last year the revised survey data actually brought the total up to above the total implied by my estimate of dollar reserve growth (which comes from the COFER data, not the BEA data).

The absence of any deterioration in the income balance is, by contrast, a real puzzle. Simple math would suggest that $800b a year more in net debt would tend to – at a 5% average interest rate – lead to a $40b deterioration in the income balance. That though hasn’t happened.
And I don’t really feel like I understand why – in part because I don’t yet have a good feel for the revised data on income payments. It does seem to suggest that the US has bigger gains from financial intermediation, that is borrowing cheaply to buy higher yielding assets abroad, than the previous data set. That supports the “dark matter” hypothesis.
Mechanically, the improvement in the US income balance in the second quarter came from a roughly $2b ($1.9b) improvement in the balance on FDI. The US received $49.6b more on its investment abroad than it paid on direct investment in the US.
Two points are important here –
First, the gain doesn’t come from spectacular reported returns abroad so much as from low returns on direct investment in the US – the reported return on FDI in the US is only 4%. That is less than the return on Treasuries.
Second, almost all of the difference comes from a $37b gap in “reinvested earnings” – that is income that US firms earn abroad and then keep abroad. The US tax code provides US firms with a strong incentive to do this; they don’t have to pay taxes on their overseas earnings until the earnings are repatriated. Foreign firms also have a strong incentive to show profits in a low tax jurisdiction abroad – whether Ireland, Switzerland, the Netherlands or another locale.
Consequently, there is a good reason to think that tax arbitrage is by far the biggest source of “dark matter.” The very low reported earnings of foreign firms operating in the US just don’t make economic sense; why run a business to earn less than you can make investing in US treasuries?
The details of income data also suggest a bit of tax arbitrage. Most reinvested earnings comes not from US manufacturing firms operating abroad but rather from financial firms, holding companies and the mysterious other …
But the real mystery, at least to me, is the fact that net US interest payments didn’t increase (one small caveat – the US quarterly data doesn’t separate out dividends, so technically I should say the balance of interest and dividends on portfolio equities. However, dividends historically have been small relative to interest payments).
The amount of interest the US paid on its external debt is going up – it rose from $134.7b in q1 to $143.1b in q2.
But the interest the US received on its lending rose just as fast – going from $96b to $104.5b. Net interest payments actually fell by a tiny bit ($0.1b).
Since the US has a borrowed a lot more – about $ 5 trillion more -- than it has lent out, mathematically, a constant deficit on the interest balance implies that either that the interest rate on US lending has to be rising faster than the interest rate on US borrowing or that the interest rate on US borrowing has to be falling faster than the interest rate on US lending.
If I did all the calculations correctly, it turns out that the implied interest rate on US lending has been constant (at around 4.7%) while the implied interest rate on US borrowing is actually falling, from a bit under 4.4% in 2006 to 4.25% in the first half 2007.
These numbers all reflect the revised US data on income payments, and thus differ from some numbers I have calculated in the past. They also are calculated by dividing payments by the estimated stock.
I thought I understand the mechanics of this before: the US lends short and borrows long, so a rise in short-term rates feeds into US interest income before it feeds into US payments. But I am no longer quite as confident this is the entire story. I certainly wouldn’t have expected a fall in the average interest rate on US external debt in the first half of 2007. That to me is a real puzzle.
On one point, though, there shouldn’t be much debate. Exchange rate adjustment works. The non-oil US trade balance is heading down.
That reflects the fact that the US economy has slowed relative to other economies.
But it also reflects changes in the exchange rate. Growth in both Europe and China (and thus Asia, given China’s size) have accelerated relative to the US. The US bilateral deficit with Europe is now shrinking rapidly – as the bilateral deficit with Canada. The bilateral deficit with Asia (including China) isn’t.

It does not take a lot of sophisticated economics, at least in my view, to figure out why. Europe has let its exchange rate adjust. Emerging Asia, by contrast, has let the size of its central bank balance sheet adjust. It has, generally speaking, opted to add to its reserves and in the process finance the US deficit rather than allow exchange rate appreciation.
More on: