 Online Store
International efforts, such as the Paris Agreement, aim to reduce greenhouse gas emissions. But experts say countries aren’t doing enough to limit dangerous global warming.
Today’s balance of payments release was overshadowed ...
More on:
Events in Iran (rightly) dominate the headlines, along with the Obama Administration’s plans to revamp the United States’ system of financial regulation.
And it doesn’t take much to overshadow the release of the United States’ balance of payments data, as it largely tells us things that we already know -- whether from the trade data (the trade deficit is way down) or the TIC data (private investors didn’t put much money in the US in q1).
But there are still stories to be found in the balance of payments data. Give the US a bit of credit. No other country releases as much detail about its balance of payments as the United States. Play with the interactive tables for a while; it is hard not to be impressed.
I have a particular reason to pay attention to those details. I have long argued -- actually screamed at the top of my lungs to anyone who would listen -- that central banks and sovereign funds were the main source of financing for the US current account deficit from the start of 2007 to the fourth quarter of 2008. And at long last, I can now point to a genuine official data release to support my argument. The BEA (finally) revised its estimates for official inflows over this period. Guess what? The BEA now thinks that official inflows are a lot higher than they used to be.
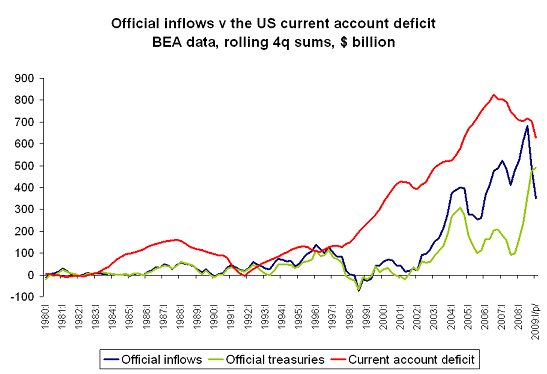
Total inflows -- according to the revised data -- peaked at around $700 billion in third quarter of 2008. That fits what we know about global reserves far better than the unrevised data; the enormous increase in the pace of reserve growth dominated in change in the dollar’s share of total reserves. Studies that use the unrevised data -- essentially any study that works off the monthly TIC data series -- to argue that the fall in central bank inflows after 2004 had no impact on yields so central banks had no impact on the market need to be revised. It turns out that there really was no sustained fall off in central bank demand for US assets. The recent $700 billion peak easily exceeds the $400 billion 2004 peak.
A lot of ink has been spilled analyzing whether the recent crisis has reduced US global power. That framing though misses a key point, namely, that the pre-crisis world -- one where the US relying ever more on a small set of governments to finance a large trade deficit -- wasn’t exactly on a favorable trajectory for the United States.
The same data can be examined as a quarterly series. Central bank and sovereign fund purchases of US financial assets exceeded the current account deficit from q4 2007 to q2 2008.*
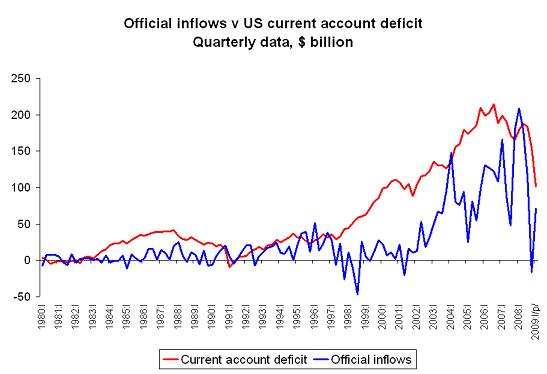
True maestros of reserve tracking know that the sharp fall in central bank demand for US assets in q3 2007 (the first quarter of the crisis) is a bit puzzling, as the IMF’s data doesn’t show any fall off in reserve growth in that quarter.** The big fall in q4 2008 though is no mystery, as it matches the IMF’s data showing a sharp fall in global reserves.
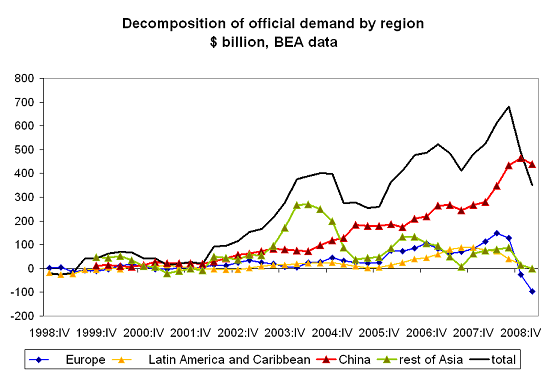
The details of the balance of payments data are also interesting. Take table 5, for example. It provides a regional breakdown of central bank and sovereign fund purchases of US assets. And by playing with the data on China (from Table 12), I can estimate of the US assets purchased by China’s central bank (I subtract clearly private purchases from the total). And by subtracting China’s estimated purchases from Asia’s total purchases of US assets, I can get a number for the rest of Asia as well. This methodology isn’t perfect. But it leaves ittle doubt that China drove the rise in overall reserve growth in late 2007 and early 2008.
And what are central banks buying? Right now, just Treasuries. There was a huge flight out of bank deposits in q4 08 and q1 09, and a big fall in demand for Agencies and risk assets as well.
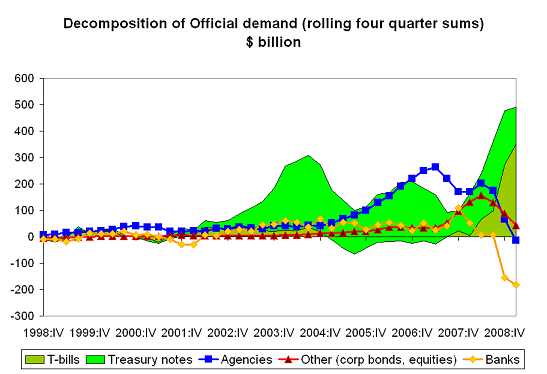
China’s hand -- I suspect -- can be seen in the changing composition of central bank purchase. The sharp rise in demand for Agencies in 2005 and 2006? That is largely a function of China’s attempt to get a bit more yield out of its reserve portfolio. The rise in purchases of corporate bonds and equities (other assets in the US data) from mid 07 to mid 08? That is also China. The Gulf was also buying a lot of equity then, but its purchases don’t really appear in the US data. The Gulf’s sovereign funds makes extensive use of external fund managers; SAFE opted to manage its equity portfolio "in-house."
One other point is worth emphasizing. To my mind, China isn’t taking on any more risk (at the margin) financing the fiscal deficit now than it took financing the household deficit back in 2005, 2006, 2007 and the first part of 2008. Ultimately China is really covering only the portion of both deficits that spills over to the rest of the world -- and the total US external deficit was (obviously) far larger back then.
But the politics have changed.
Why? Part of it, I suspect, is a fairly systematic tendency to underestimate the risks associated with large current account deficits that stem from excesses in the private sector. The fiscal deficit -- and China’s current Treasury purchases -- are a lot more visible than the complex chain of risk taking that allowed Chinese financing to help sustain the excess of the United States’ housing boom. But part of it is that the over the past year or so China has been providing the US with more financing and in some sense getting less in return. For a long-time, the rise in Chinese official financing of the US coincided with a rise in US purchases of Chinese goods.
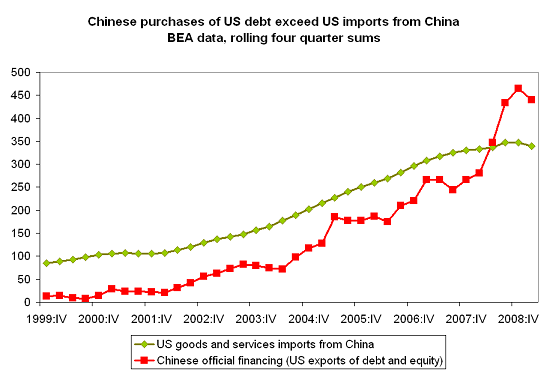
Vendor financing yields obvious benefits, helping to offset its hidden costs. However, over the past year Chinese purchases of US financial assets have far exceeded US purchases of Chinese goods. That may have something to do with the shift in China’s tone. To many in China, the risks associated with financing the US seem to have gone up even as the benefits that China gets in return have gone down.
I didn’t do a graph of the quarterly data. But China can at least take comfort from the fact that Chinese official financing of the US -- according to my estimate derived from the US data -- peaked at $137 billion in q3 2008. By q1 2009, it was more like $75 billion. Annualized that is around $300 billion -- a big number, to be sure, but not quite as big a number as $500 billion. Sustaining that slide, though, ultimately will require a sustained reduction in China’s trade surplus.
* Ted Truman of the Peterson Institute argues -- correctly -- that official inflows really should be compared to the sum of the current account deficit and long-term private outflows, as central bank inflows can finance a capital outflow just as easily as a current account deficit. This important caveat matters a bit less now, though, as the crisis has reduced the scale of private capital outflows.
** The US data shows a shift out of Agencies and Treasuries toward bank deposits -- and my guess is that something similar happened globally. Their also may have been large flows into money market funds. Both flows are ironic in light of subsequent events: in late 2008 central banks moved huge amounts back into Treasuries as they pulled funds out of banks and money market funds.
More on: