 Online Store
Introduction
Over the last several decades, governments have collectively pledged to slow global warming. But despite intensified diplomacy, the world is already facing the consequences of climate…
Trade deficit seems to have stabilized, at least if oil stays at its current levels
More on:
I don’t think the deficit stabilized just because of the headline fall in the trade deficit. The deficit is down $9.6b from its August peak largely because the US oil import bill has fallen by $7.6b since August. The US imported $21.8b in October, down from $29.3b in August as the average price of a barrel of imported crude fell from $66 to $55.5. Oil import volume also aren’t increasing at the same pace as they have in the past – for the year to date, the US is importing about 1% less crude than in 2005.
Oil matters. But so does the non-oil deficit. And the October data suggests that the rise in non-oil imports in the third quarter seem to have ended, if not reversed itself – on the back, one assumes, of a slowing US economy. And a slowdown in the pace of non-oil import growth is essential to the eventual stabilization of the US trade deficit. The charts are below the break.Let’s look at a couple of charts. The first shows US exports and US non-oil imports.
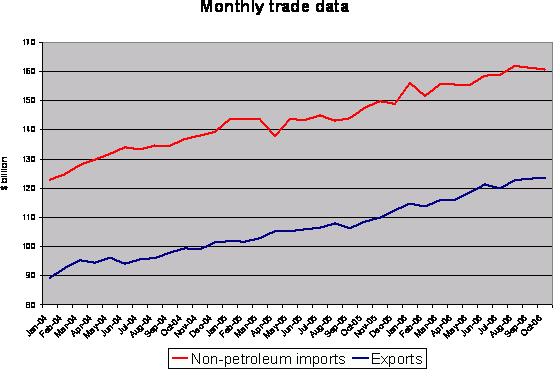
A couple of things are worth highlighting. First, export shave growth quite strongly since early 2004. They did particularly well between say the end of 2004 and mid-2006. However, more recently, the pace of export growth has leveled off. That worried me – and for that matter, it still worries me. Total exports have been stuck below $125b for several months now.
Second – non-oil imports have also been growing. I was particularly concerned by the increase between May 2006 and August 2006 – an increase, that, if sustained, was strong enough to push the overall trade deficit up. However, as the chart shows, non-oil imports have trended down since August.
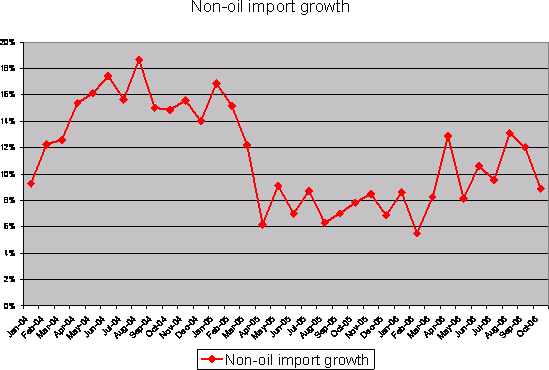
The earlier acceleration and current deceleration in non-oil import growth shows up more clearly in a chart that shows the y/y increase.
How does this all balance out – well, in broad terms, US export growth has been strong enough to offset the growing US non-oil import bill for the last couple of years. The increase in the overall trade deficit has been driven by rising oil prices (This is something Menzie Chinn has highlighted regularly; and something he reinterates in his analysis of today's trade data).
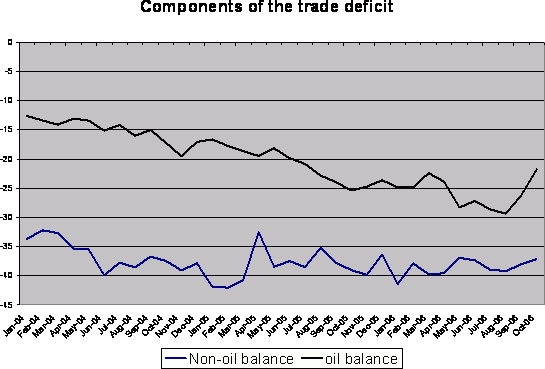
The following chart shows the overall trade balance, divided into a non-oil deficit and an oil deficit.
A couple of other points are worth making.
US bilateral deficits with Europe (at all levels), Canada and Latin America (ex Mexico) has been constant so far in 2006 in nominal terms, which implies the US deficit with these regions is shrinking in real terms. Kash has a nice chart showing increase in US exports and imports to various regions of the world in both percentage and dollar terms over at the Streetlight blog.
It probably isn’t an accident that Europe, Canada and even Latin America have allowed their currencies to appreciate against the dollar from 2002 on.
The US bilateral deficit with the Asian-Pacific region, by contrast, continues to expand. I rather suspect strong US export growth to China is part a counterpart to the relatively weak US export growth elsewhere in Asia. The US presumably is shipping electronic components directly to China for final assembly. Many have noted that some of the increase in China's exports has come at the expense of exports elsewhere in Asia, but the same is also true on the US side.
Overall US imports from all of Asia continue to rise faster than US GDP, indicating that China isn't just taking market share away from other Asian electronics producers. There also is evidence that the deficit with China may be poised to get worse before it gets better. The y/y increase in US imports from China in October (20.2%) and September (18.4%) has been higher than the overall increase for the full year (17.5%) … which suggests that the pace of import growth from China is accelerating even as overall non-oil import is slowing.
What of the future – well, the chart on the non oil trade deficit left me convinced that the most likely outcome is that the US trade deficit stays roughly stable so long as oil prices stay stable. I suspect the US trade balance with Europe will start to improve in 2007 if European growth remains strong, while the US trade balance with Asia will continue to deteriorate. Both import and export growth are likely to slow.
The Q3 goods and services trade deficit was – according to most recent data – over $200b. That should push the q3 current account deficit above $230b (a new record), if, as expected, the transfers balance continues to show a solid deficit and the income balance continues to deteriorate. We will now next week.
The Q4 current account balance, though, should be better. The trade deficit could fall to around $180b, driven by a $15b fall in the oil import bill. Rising income payments will offset some of that decline, but not all.
2007? Let’s assume the trade deficit stabilizes, with exports growing just fast enough to offset ongoing (but slower) growth in non-oil imports. That forecast still worries a bit -- the "momentum" behind US export growth seems to have slowed recently, while Chinese export growth hasn't slowed -- but it seems as good a baseline as any. The current account deficit should still deteriorate significantly.
Why? Rising interest payments on a growing debt stock.
The average interest rate on the United States (large) stock of external debt was around 4% in the first half of 2006. It should rise to about 5% by the end of 2007. The US will also take on an additional $1 trillion or so of new debt in 2007. That will start to add up. At least that is my guess.
More on: