 Online Store
Introduction
Over the last several decades, governments have collectively pledged to slow global warming. But despite intensified diplomacy, the world is already facing the consequences of climate…
The US October trade data
More on:
Today's trade data release wasn't that inspiring -- it wasn't exactly front-page news on a day when the world's central banks indicated that they would jointly intervene to try to unfreeze the world's credit markets (see Felix Salmon, Steve Waldman, and Naked Capitalism -- including the comments).
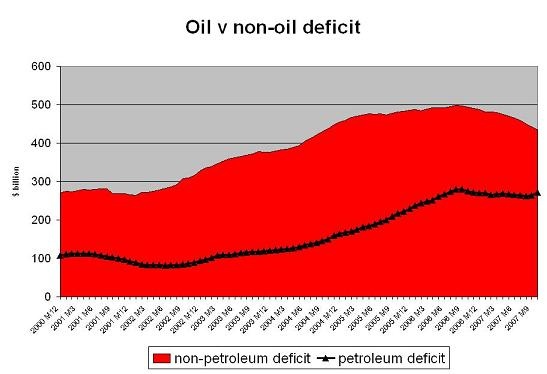
But like China's November trade data, the US October data did confirm recent trends. The non-oil deficit is falling. The oil deficit is starting to head back up. That is to be expected. Oil prices rose significantly this fall. The average import price in October was only $72.5 a barrel. It still has further to rise. The November import price data makes that clear (the FT reports petrol import prices jumped another 10%).
Indeed, the petrol deficit is only now starting to rise on a rolling 12m basis --
The standard narrative explaining the improvement in the United States non-oil trade balance (an improvement that started about 12 months ago) emphasizes the strength of US exports. And no doubt they are strong -- y/y export growth in October was almost 14% (the pace of growth may fall back bit in November and December, as a rise in exports at the end of last year makes the "base" a bit less favorable -- but it should still be around 12% for the year). But export growth has been strong since late 2003.
The improvement in the trade deficit recently stems much more from a slowdown in non-oil import growth than an major acceleration in export growth.
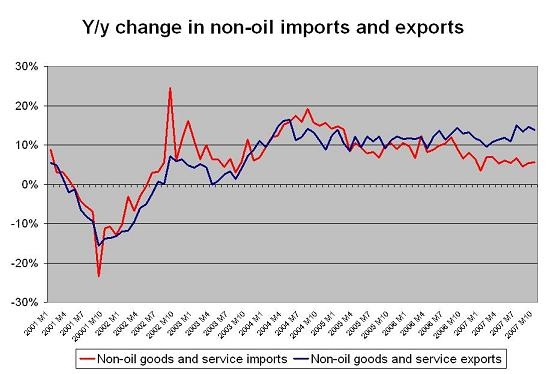
Export growth has basically fluctuated between 10% and 15% ever since the dolla's depreciation against the euro started to influence the trade data.
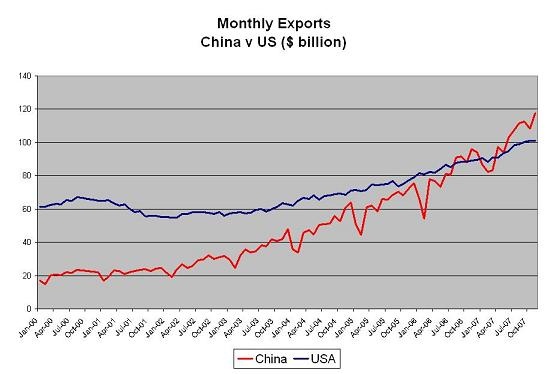
Of course, the US isn't the only country to benefit from the dollar's slide v the euro. China benefited even more, as the RMB followed the dollar down. Chinese goods exports are now far larger than US goods exports. They are also growing more rapidly -- as the following chart comparing US and Chinese goods exports shows.
Reporting on US trade with China often points out that in percentage terms, US exports to China have grown faster than US imports from China. That is true, but it is also irrelevant. The US exports only about 1/5 as much to China as it imports from China, so US exports to China have to grow five times faster than US imports just to keep the deficit with China constant. Moreover, to an extent, US exports to China have traded off with US exports to the rest of Asia, as China has become the epicenter for final assembly of most electronics goods.
To me the real story is that US imports from China are still growing far faster than US non-oil imports (15%, comparing Jan-Oct 2007 v Jan-Oct 2006 v 5% or so). The increase in imports from China is clearly coming at the expense of the imports from the rest of Asia. US imports from the Pacific-rim ex China are actually down 1.1% y/y.
That implies that Asia is getting squeezed. Until 2004, the rise in China's surplus with the US and Europe was offset in large part by a rising Chinese deficit with the rest of Asia. From 2004 on though China's surplus with the US and especially Europe has kept on growing while China's deficit with the rest of Asia has fallen. Chinese import growth hasn't kept pace with Chinese export growth -- in large part because expanded domestic Chinese production has displaced imported components.
The weak RMB isn't just an issue for the US.
And then there is Europe. US exports to Europe (Jan-Oct 07 v Jan-Oct 06) are rising faster than US exports to Asia (16.4% v 9.5%) -- and indeed, slightly faster than US exports to booming China (16.4% v 16.2%). Please explain to me again why exchange rates have no impact on trade! US (and Chinese) exports to Europe aren't growing fast because Europe is enjoying an economic boom like no other the world has ever seen.
US exports to Europe are also growing faster than US imports from Europe (16.4% v 7.4%, comparing Jan-Oct 07 to Jan-Oct 06). But something interesting is going on. In the last two months (September and October), US imports from Europe are growing about as fast (13.0%) as US exports to Europe (13.4%).
Why? Well, the US is probably paying more for some European-made goods. The strong euro and all. A big exchange rate move initially pushes up the price of existing imports, and only starts to reduce the total volume of imports with a lag (the so called J-curve). But that may not be all -- I think I remember that the US also now imports refined petroleum from Europe ...
More on: