China, Not Europe, is the Source of the World’s Imbalances
How Ireland and China’s statistical agency pulled the wool over the eyes of the IMF and OECD.


There is a particular chart that appears in most OECD and IMF publications on imbalances that paints a deceptive picture of the state of today’s world. It shows that Europe’s current account surplus was bigger, as a share of its GDP, than China’s surplus—back in 2024.
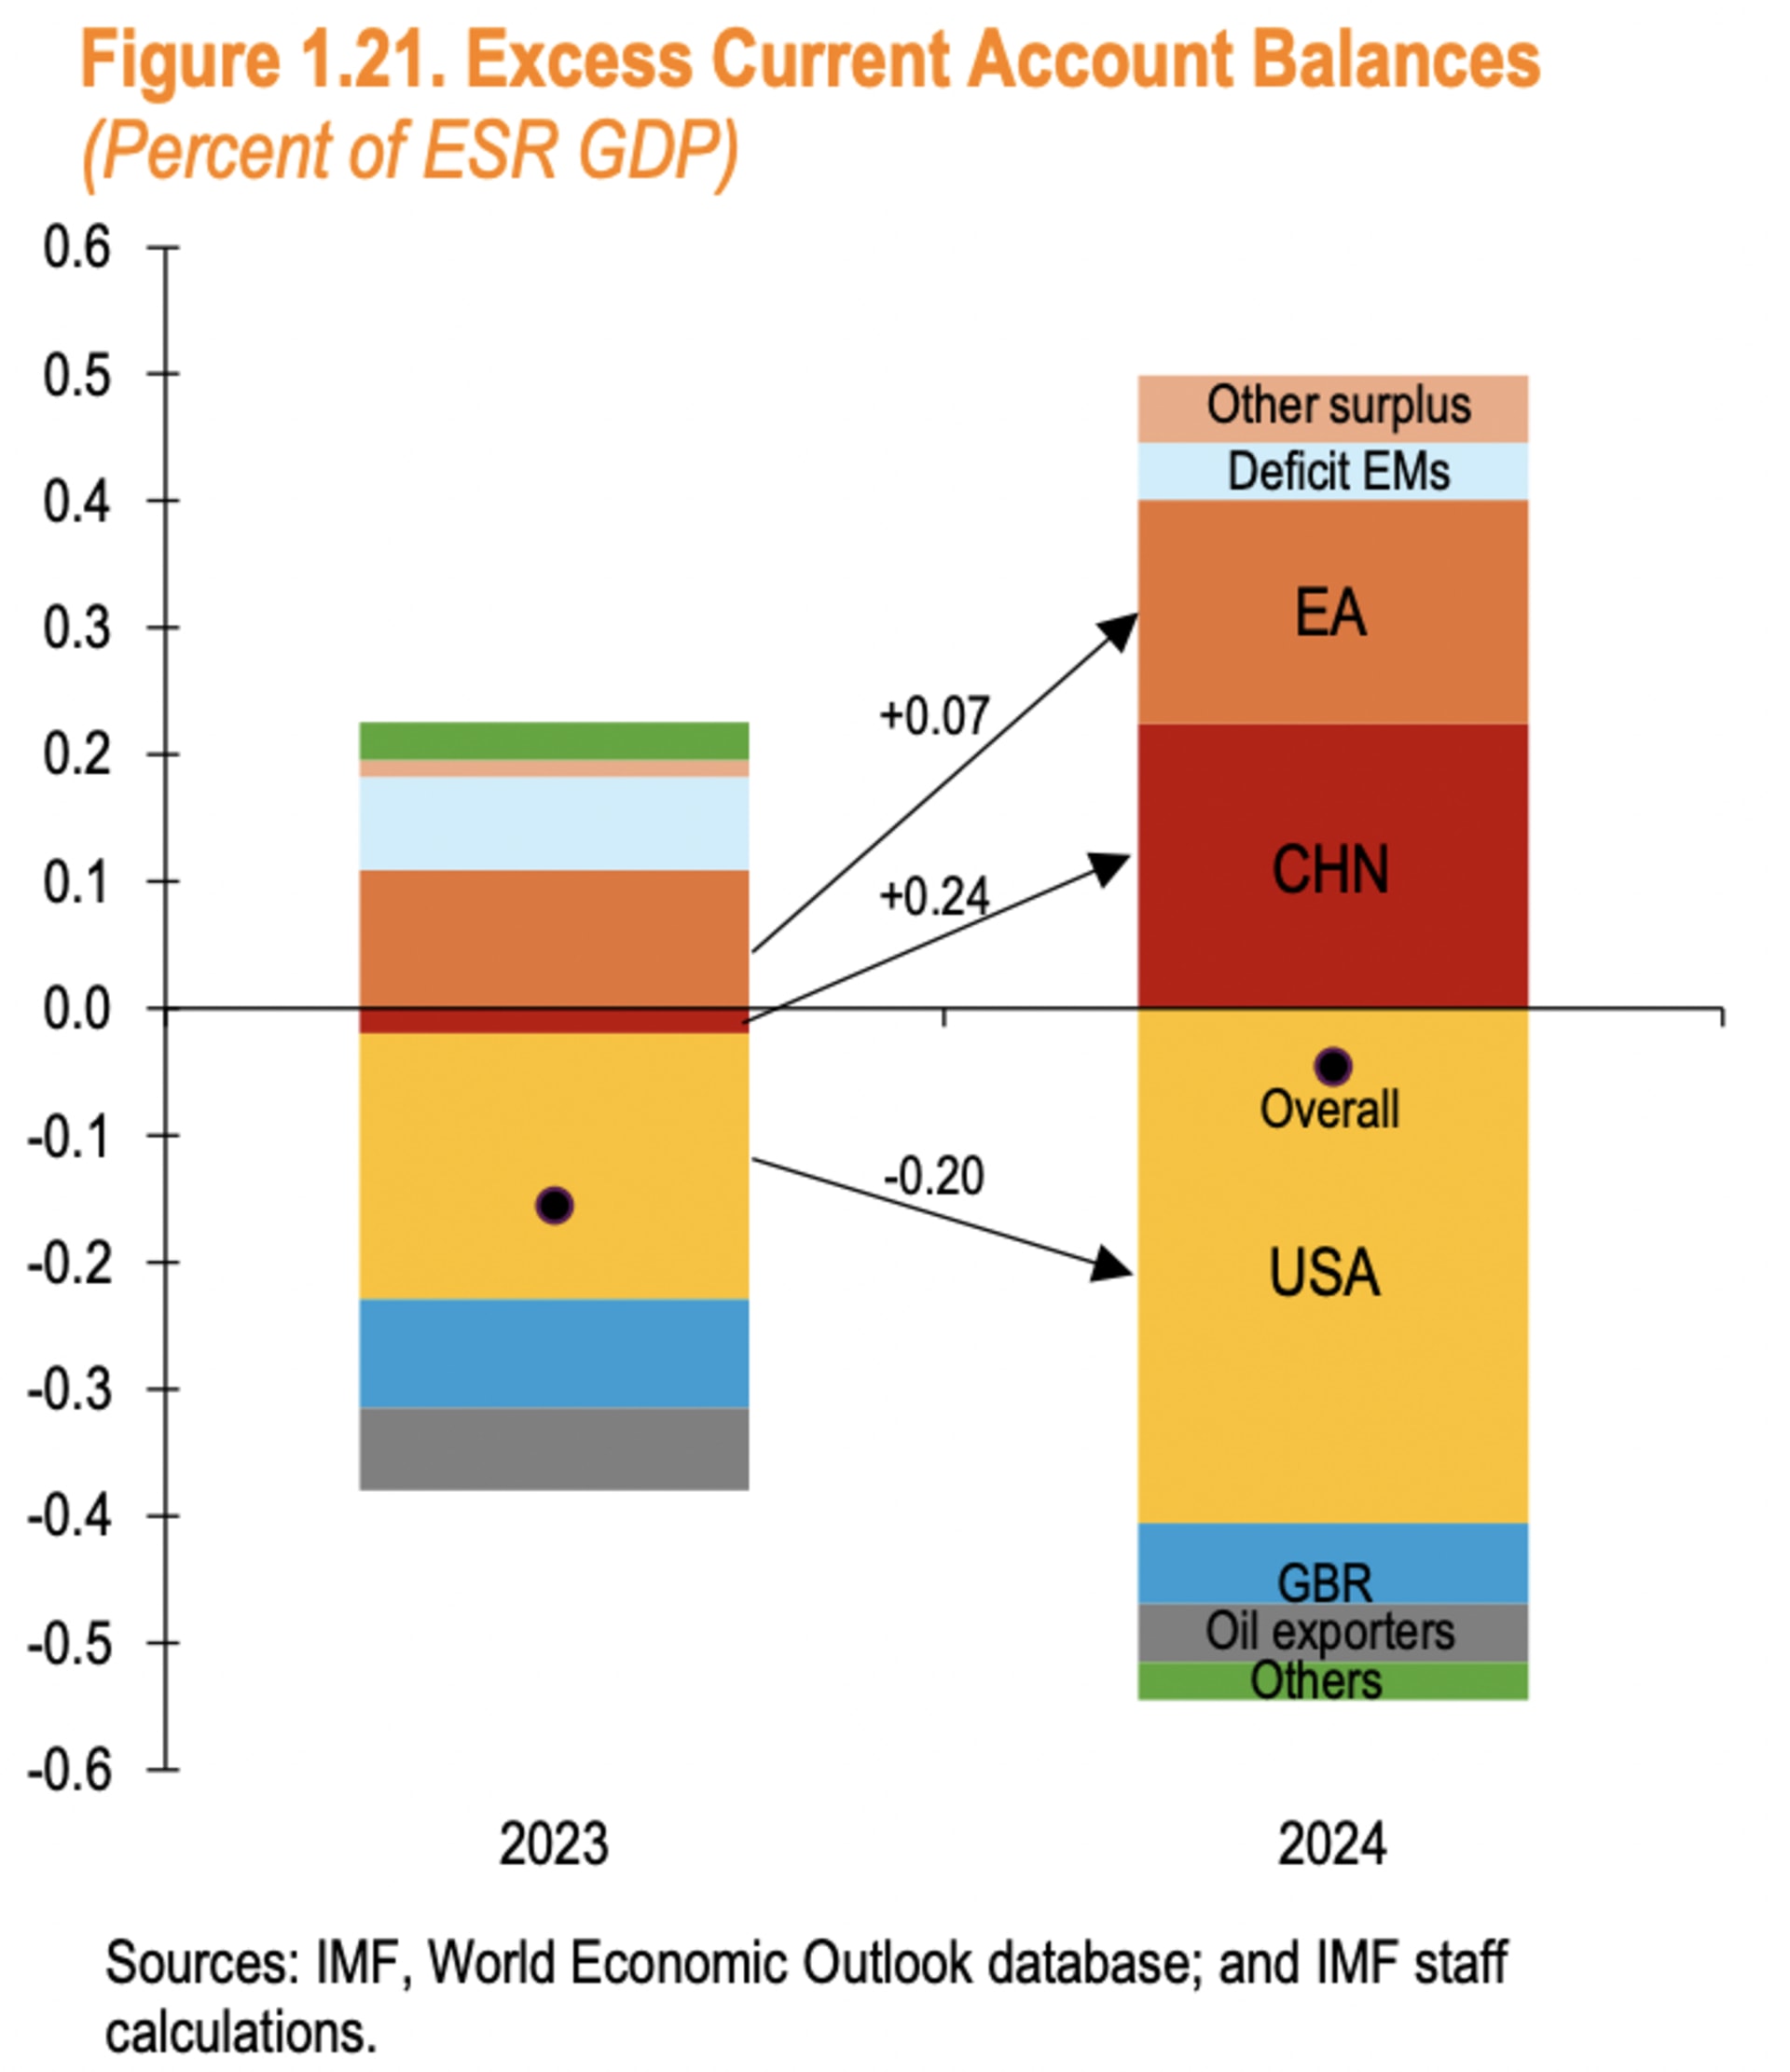
There are three major problems with this chart:
- It uses very stale data. China’s reported current account surplus rose from ~ $400b to ~ $750b since the end of 2024. Net exports added over a point and a half to China’s growth since then, and the euro area’s surplus is down from €420 billion to €280 billion. And in one prominent sector, autos, China’s surplus is way up. Its exports have increased by 3 million since then while its auto imports are down by a quarter of a million.
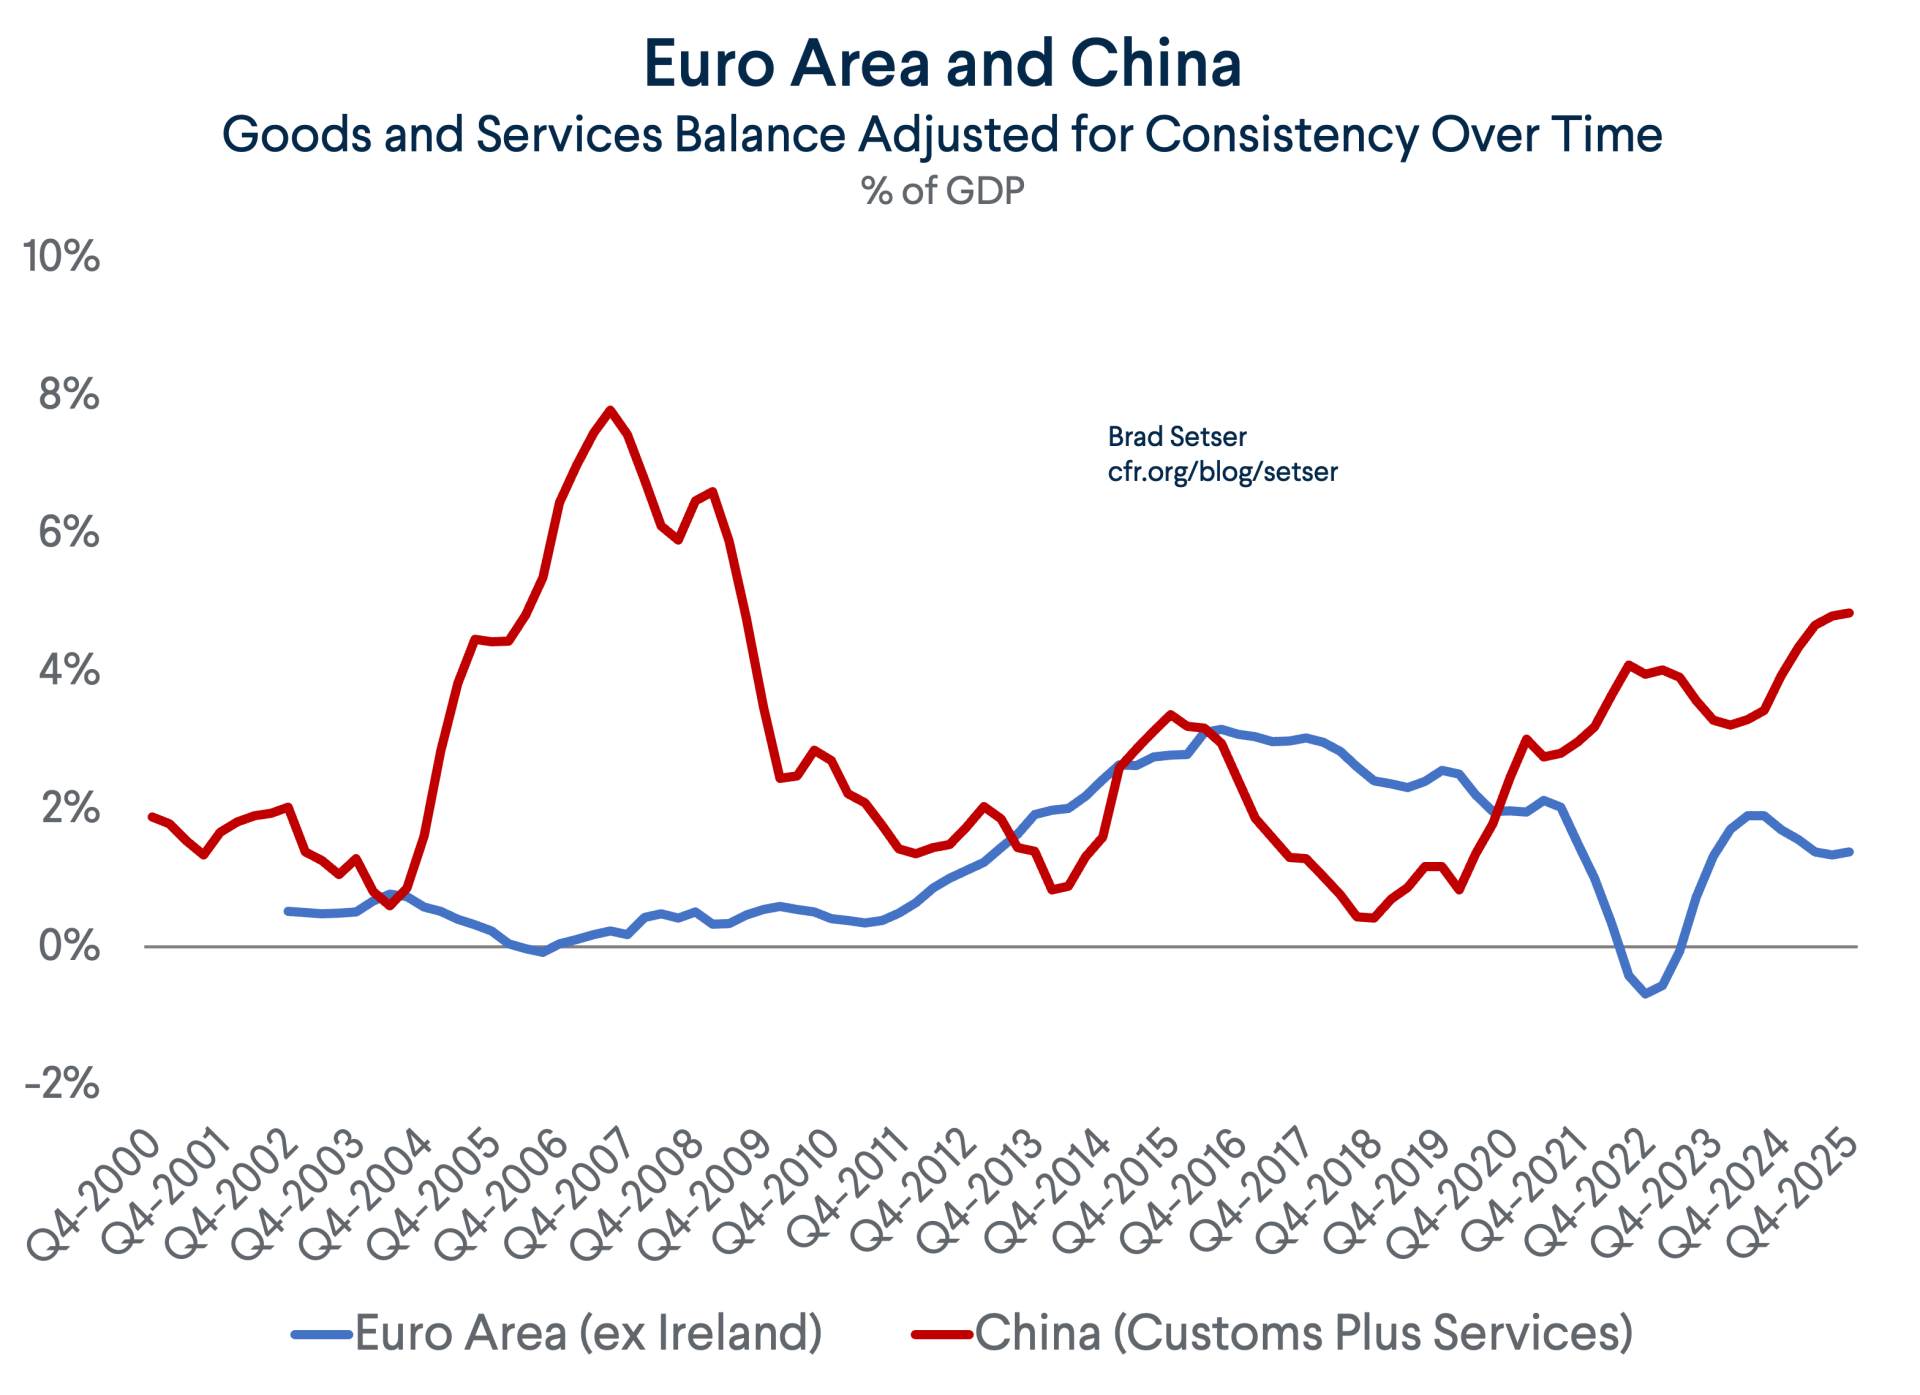
- It doesn’t adjust the euro area’s surplus for Ireland—which matters. See the problems that the end of pharmaceutical front running created for the overall euro area GDP data in the first quarter. And it especially matters if there is an attempt to solve for China’s clearly misreported investment income data by just using balance of payments goods and services data, as Ireland runs an absolutely massive but enormously inflated goods and services surplus thanks to profit shifting by mostly American multinationals.
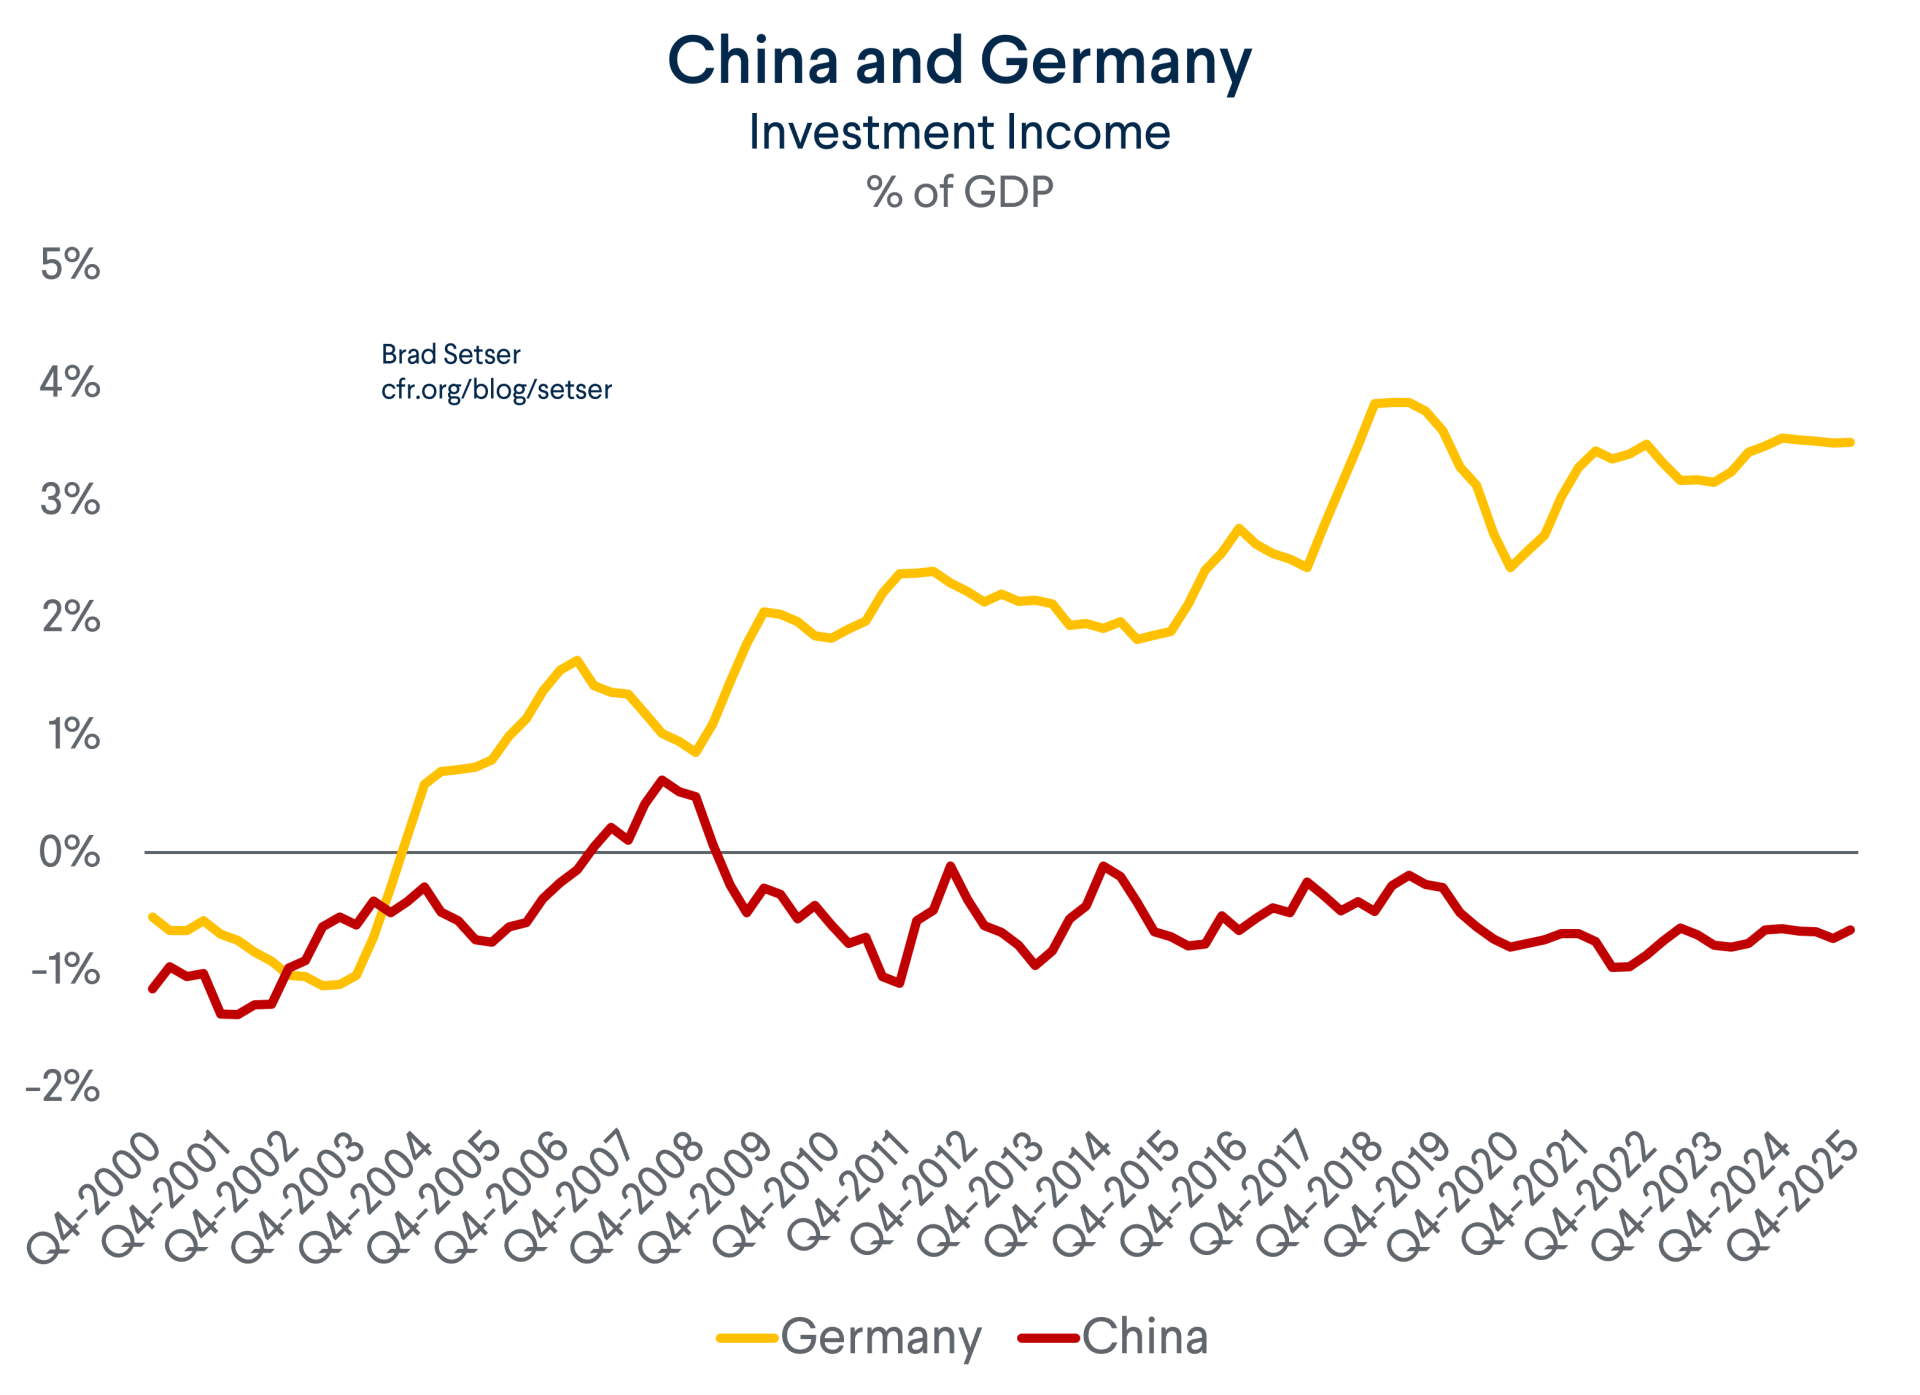
- It takes the Chinese current account surplus and its bizarre reported deficit in investment income (China is the world’s second largest investor, after Germany, yet it loses $125 billion on net on interest and dividends while Germany gets over $150 billion) at face value.
The overarching issue, of course, is that China changed its balance of payments data in a way that both eliminated errors and omissions from the financial account and reduced its reported balance of payments goods surplus back in 2022 (it now enters the data for 2021 as well). Moreover, the statistical adjustment—a fundamental shift in how the goods balance is calculated in the balance of payments—clearly reduced the reported current account surplus significantly at a time when the underlying customs surplus was exploding up.*
The need for international organizations assessing the world’s trade and savings and investment imbalances to use more than the reported current account balance in their assessment of China should now be obvious. No one believes the reported investment income deficit at this point. And frankly it by now should be best practice for the major international organizations to use trailing four-quarter sums (which are still lagged by quarter) rather than annual data.
The need to adjust the euro area and EU data for Ireland should be equally obvious.
In theory, being the tax home for Apple (raises BOP goods exports but not customs exports), Microsoft (raises services exports), Eli Lilly (raises customs and BOP goods exports), Google (raises service exports and imports, as Google’s global IP is a U.S. tax resident and Google’s Irish subsidiary has to pay to use “California’s” IP) and others shouldn’t impact the balance of payments. The tax gymnastics of U.S. firms should result in a higher goods and services surplus, but there should be an offsetting outflow of profits (FDI income payments) from the Irish subsidiaries of U.S. firms back to their U.S. parents and thus a large deficit in investment income that keeps the current account unchanged.
In practice, however, the end of the double Irish and the “Irish-shoring” of the world’s intellectual property has led to a big swing in Ireland’s current account surplus, with the current account moving from a large deficit in the days when the Irish subsidiaries of U.S. firms “invested” to bring the Caribbean (or Channel Island) IP of U.S. firms onto Ireland’s green shores to a big surplus now.
Ireland reported a current account deficit of 75 billion euro in 2019, and now reports a surplus of 50 billion euro; that is a massive shift which has no real bearing on any of the variables that the IMF or OECD are trying to measure in their reports on imbalances (of course, it does say a lot about the evolution of the tax strategies of U.S. multinationals).
And it matters for the IMF’s assessment of the world’s “excess” imbalances: netting Ireland out brings the euro area’s 2025 current account surplus down to around €230 billion (~$250 billion), or well under 2 percent of euro area GDP.
Ireland has an even more outsized impact on the euro area’s goods and services balance, as Ireland’s euro 250 billion BOP goods surplus is a shocking 40 percent of Irish GDP (thanks to BPM 6 accounting for Apple and big pharma).
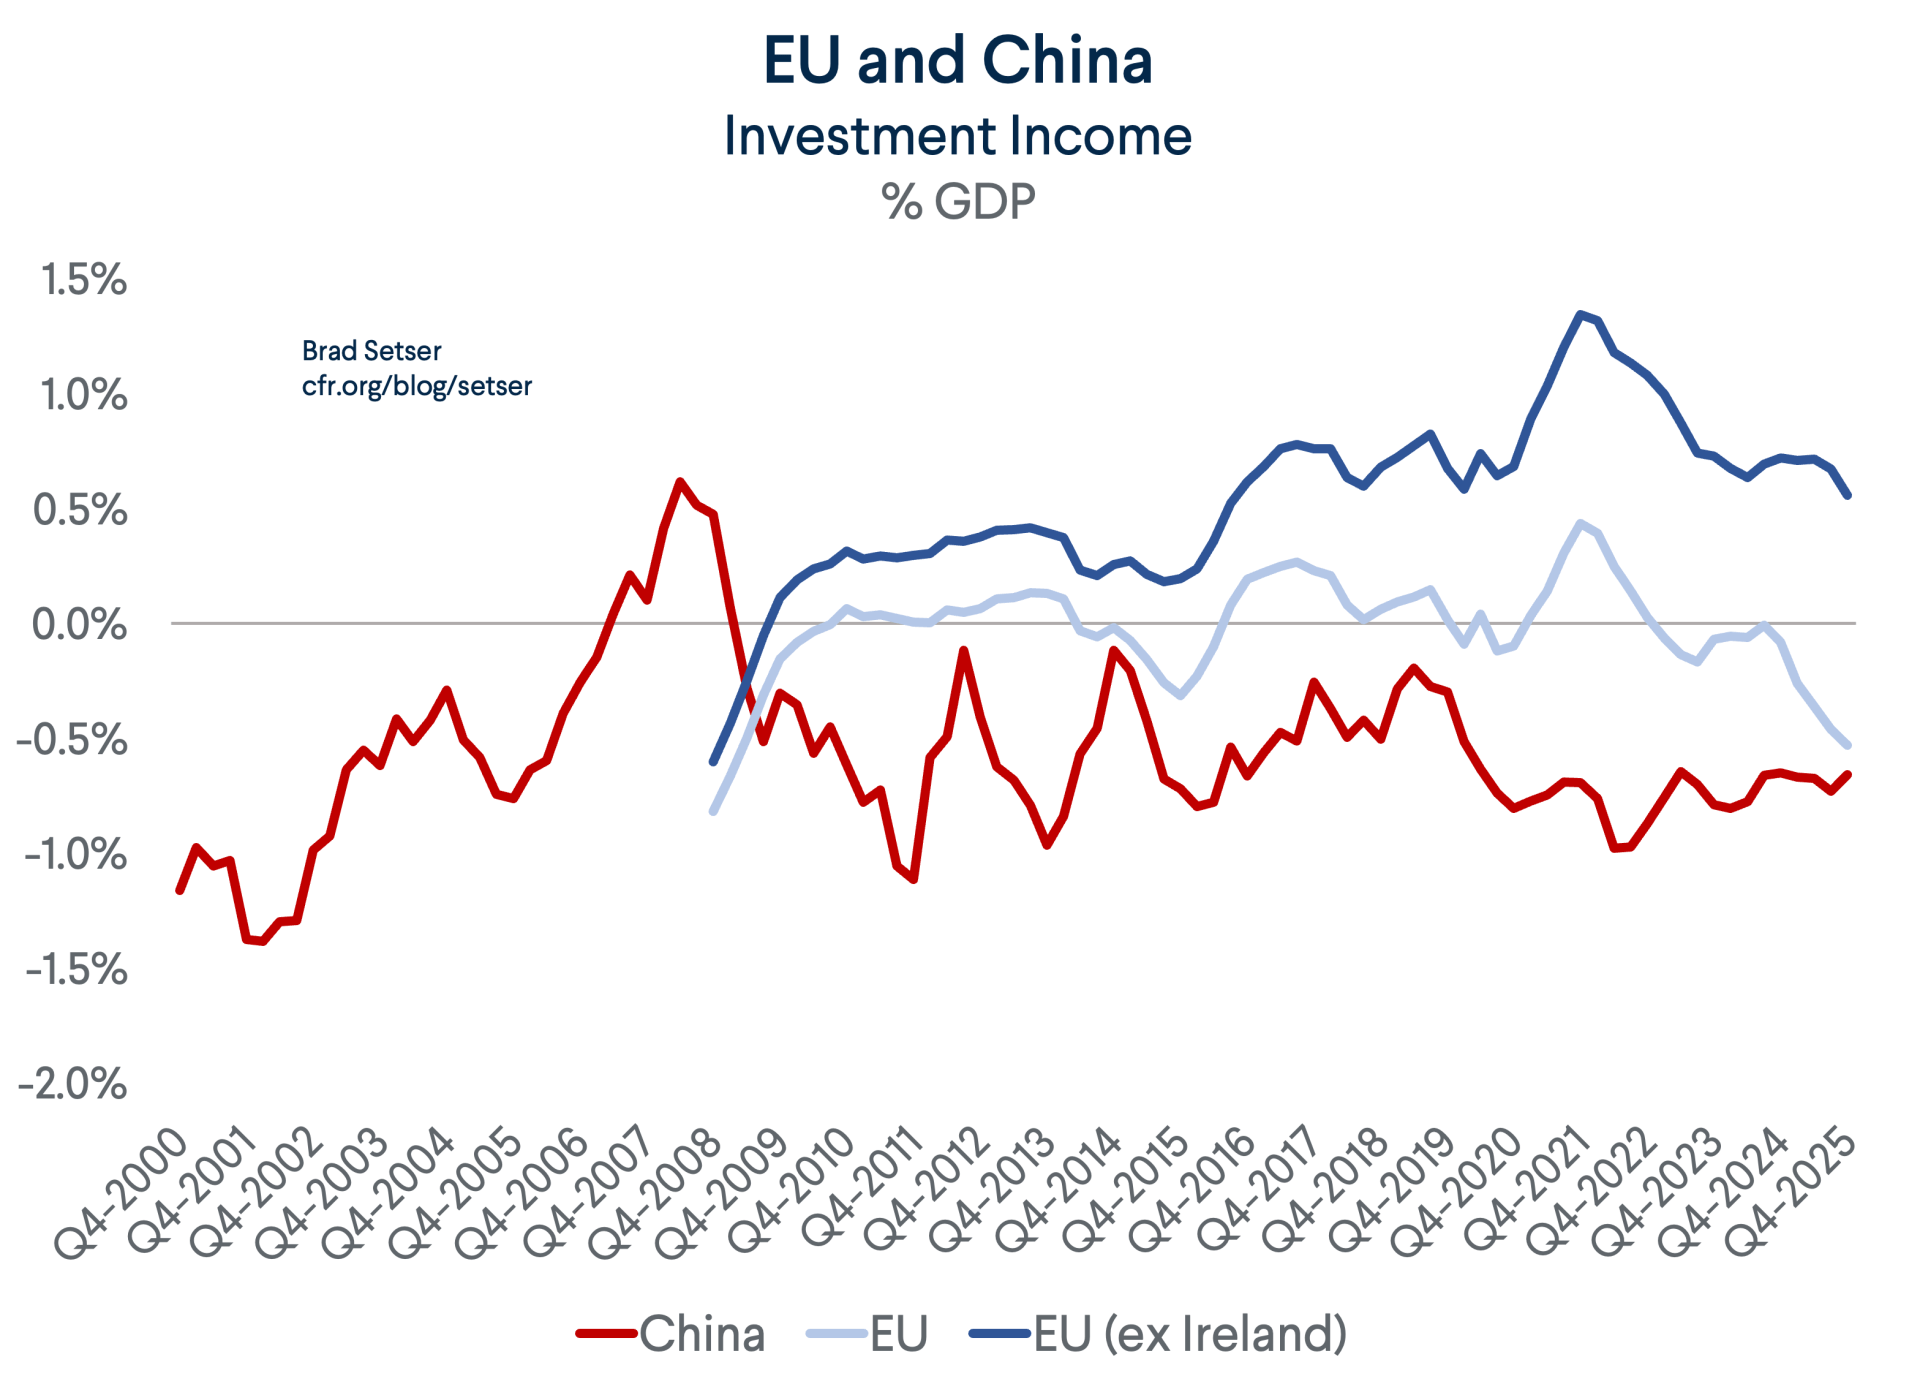
And netting Ireland out changes Europe’s income balance from a deficit (reflecting the huge profits of U.S. multinationals in Ireland, now ~€300 billion) to a more reasonable surplus.
All this matters, of course, when it comes to trying to find a politically feasible way of presenting China’s actual surplus into cross-country/cross-region comparisons.
As mentioned earlier, China poses two distinct issues.
First, China reports a large ($125 billion) income deficit despite being the world’s second largest creditor (bigger than Japan) with a positive $4 trillion net credit position in the “stock” tables showing countries net international investment positions.
No one has been able to explain that deficit adequately.
The IMF could not (see the 2025 External Sector Report, Box 1.1). Shang-Jin Wei and Chang Ma could not.
I also cannot. My various models of what China’s income balance sheet should be—based realistic assumptions around investment returns—point to a surplus of around $100 billion. One easy way to see why: SAFE’s reserves are pretty close to the positive NIIP position and SAFE reported a 3 percent return on its reserves in the 2010s, the low-for-long decade. That profit should be higher now.
Set aside the debate over the merits of the new methodology that China trotted out for calculating its goods surplus in the balance of payments back in 2022 (see the IMF 2024 staff report for details) —which now enters into the 2021 statistics. There is no doubt that the adjustment:
- Lowered the reported goods surplus in the balance of payments relative to customs.
- Changes over time in ways that are difficult to explain. The gap between BOP goods using the pre-2021 methodology and the new data was around $300 billion annualized in much of 2023 and 2024; it has now shrunk to around $150 billion for reasons that SAFE hasn’t credibly explained.
- Has had the effect of lowering reported current account surplus, not just shifting Apple’s “onshore” profit into the goods account and out of either services or income.
This is obvious in any careful examination of the data, particularly the quarterly data.
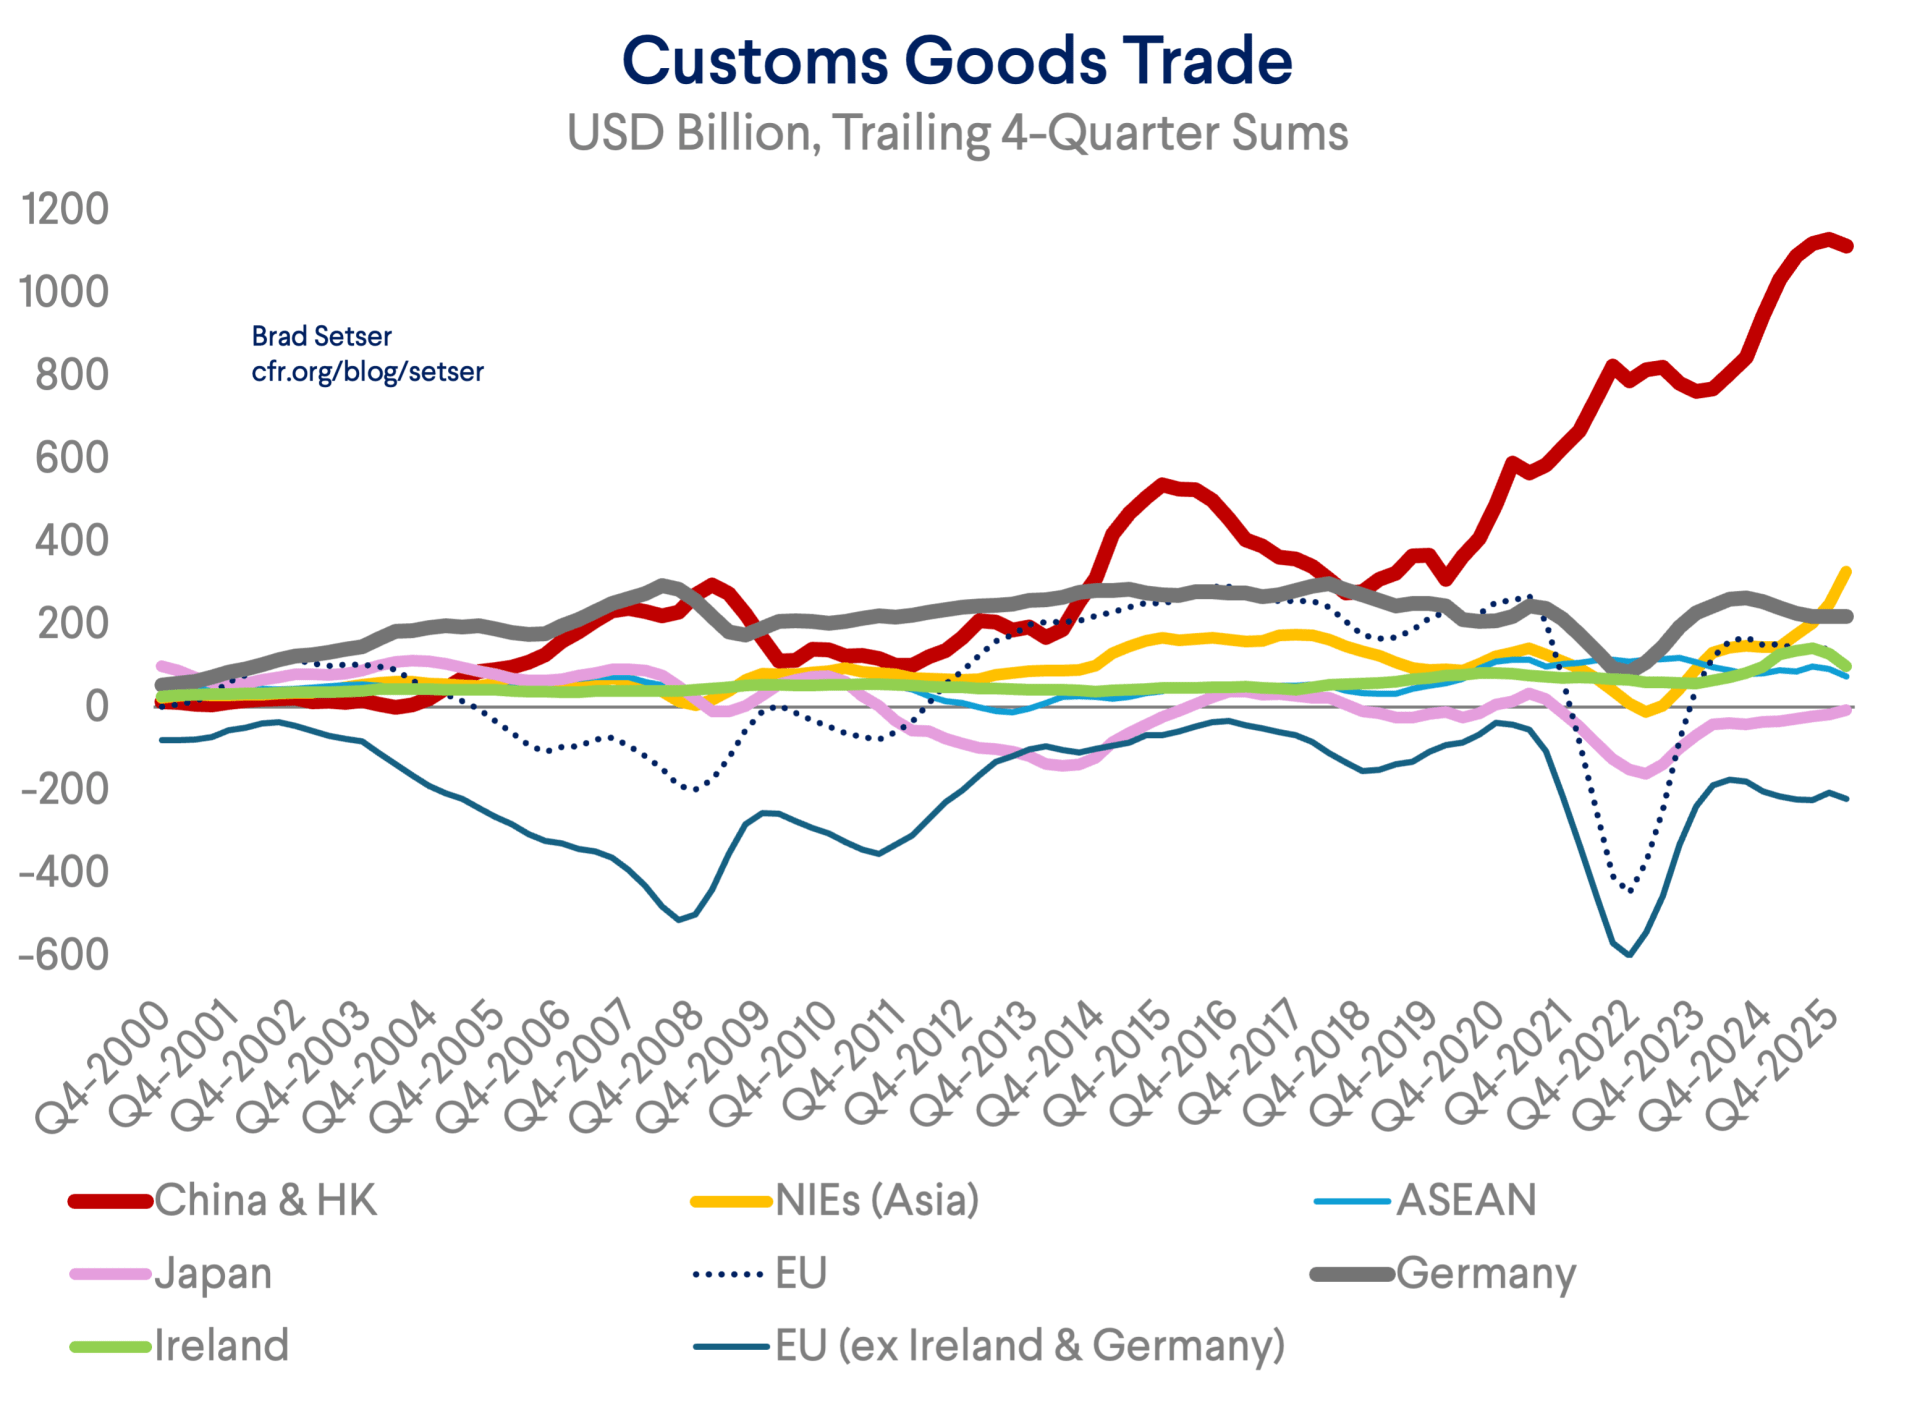
One way of addressing these data problems is just using the customs trade balance—a retro indicator, but one that can be easily verified.
That goes too far for some people (services!) but the easy solution—using BOP goods and services—solves the problem of China’s fudged investment income account but augments the Irish distortion to Europe.
The best solution would be to calculate China’s surplus using the pre-2021 methodology (at least until China can provide a plausible explanation for what is happening elsewhere in the BOP when Apple’s in China surplus enters the BOP goods numbers, and can explain the bizarre downward adjustment in BOP exports—the Apple in China adjustment raises BOP exports…) and to net out Ireland from the euro area data.
Bottom line: when netting Ireland out, China’s goods and services balance is two times bigger than the euro area’s surplus—and it has risen a lot over the last five years.
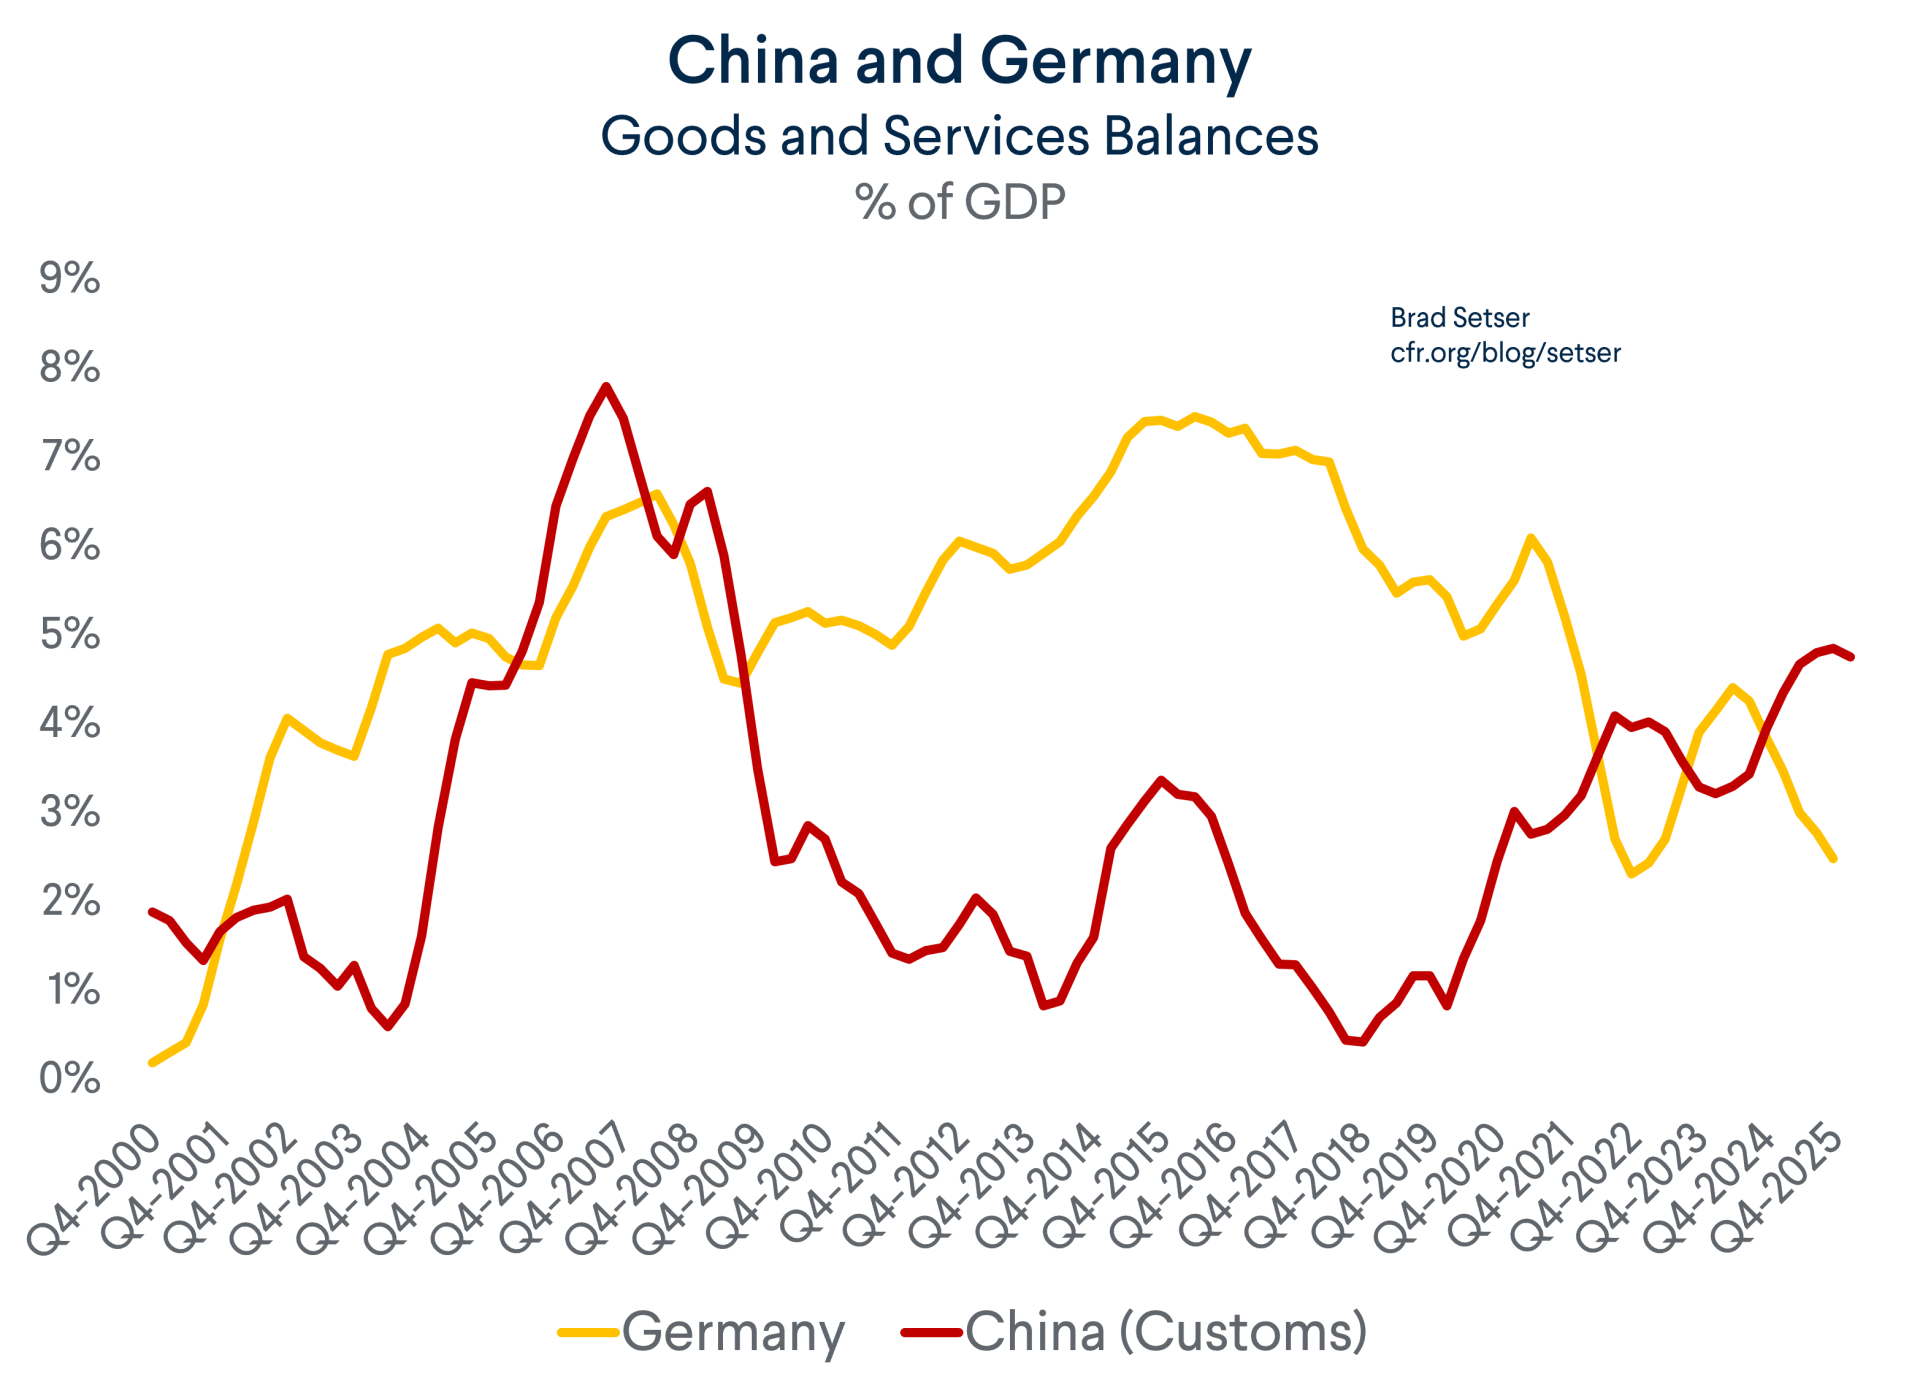
And these adjustments also change the comparison between China’s surplus and Germany’s surplus, as Germany’s goods and services surplus is now lower than China’s goods and services surplus, consistently reported.
All this is too important to global surveillance not to be factored into the IMF and the OECD’s work in some way.
It simply isn’t credible to keep showing charts that show Europe is as “bad” as China—not when European trade has lagged China’s trade so badly for the last few years.
Yes, the current account is the standard metric, but it is important to understand what goes into that metric, and what may be missing. The gap between the reported current account and high frequency measures like customs goods should have been a warning that something was off.
* Of course, I personally think China’s approach generates a nonsensical adjustment; all the more so as the downward adjustment in the customs surplus in the BOP data seems to vary over time so as to keep reported errors (the statistical error) close to zero. The Chinese, with support (sadly) from the IMF’s statistics division, say that their survey-based methodology is actually the IMF’s recommended methodology. That’s true, but it shouldn’t stop the IMF from evaluating the quality of the adjustment.