CFR Geoeconomics Trackers
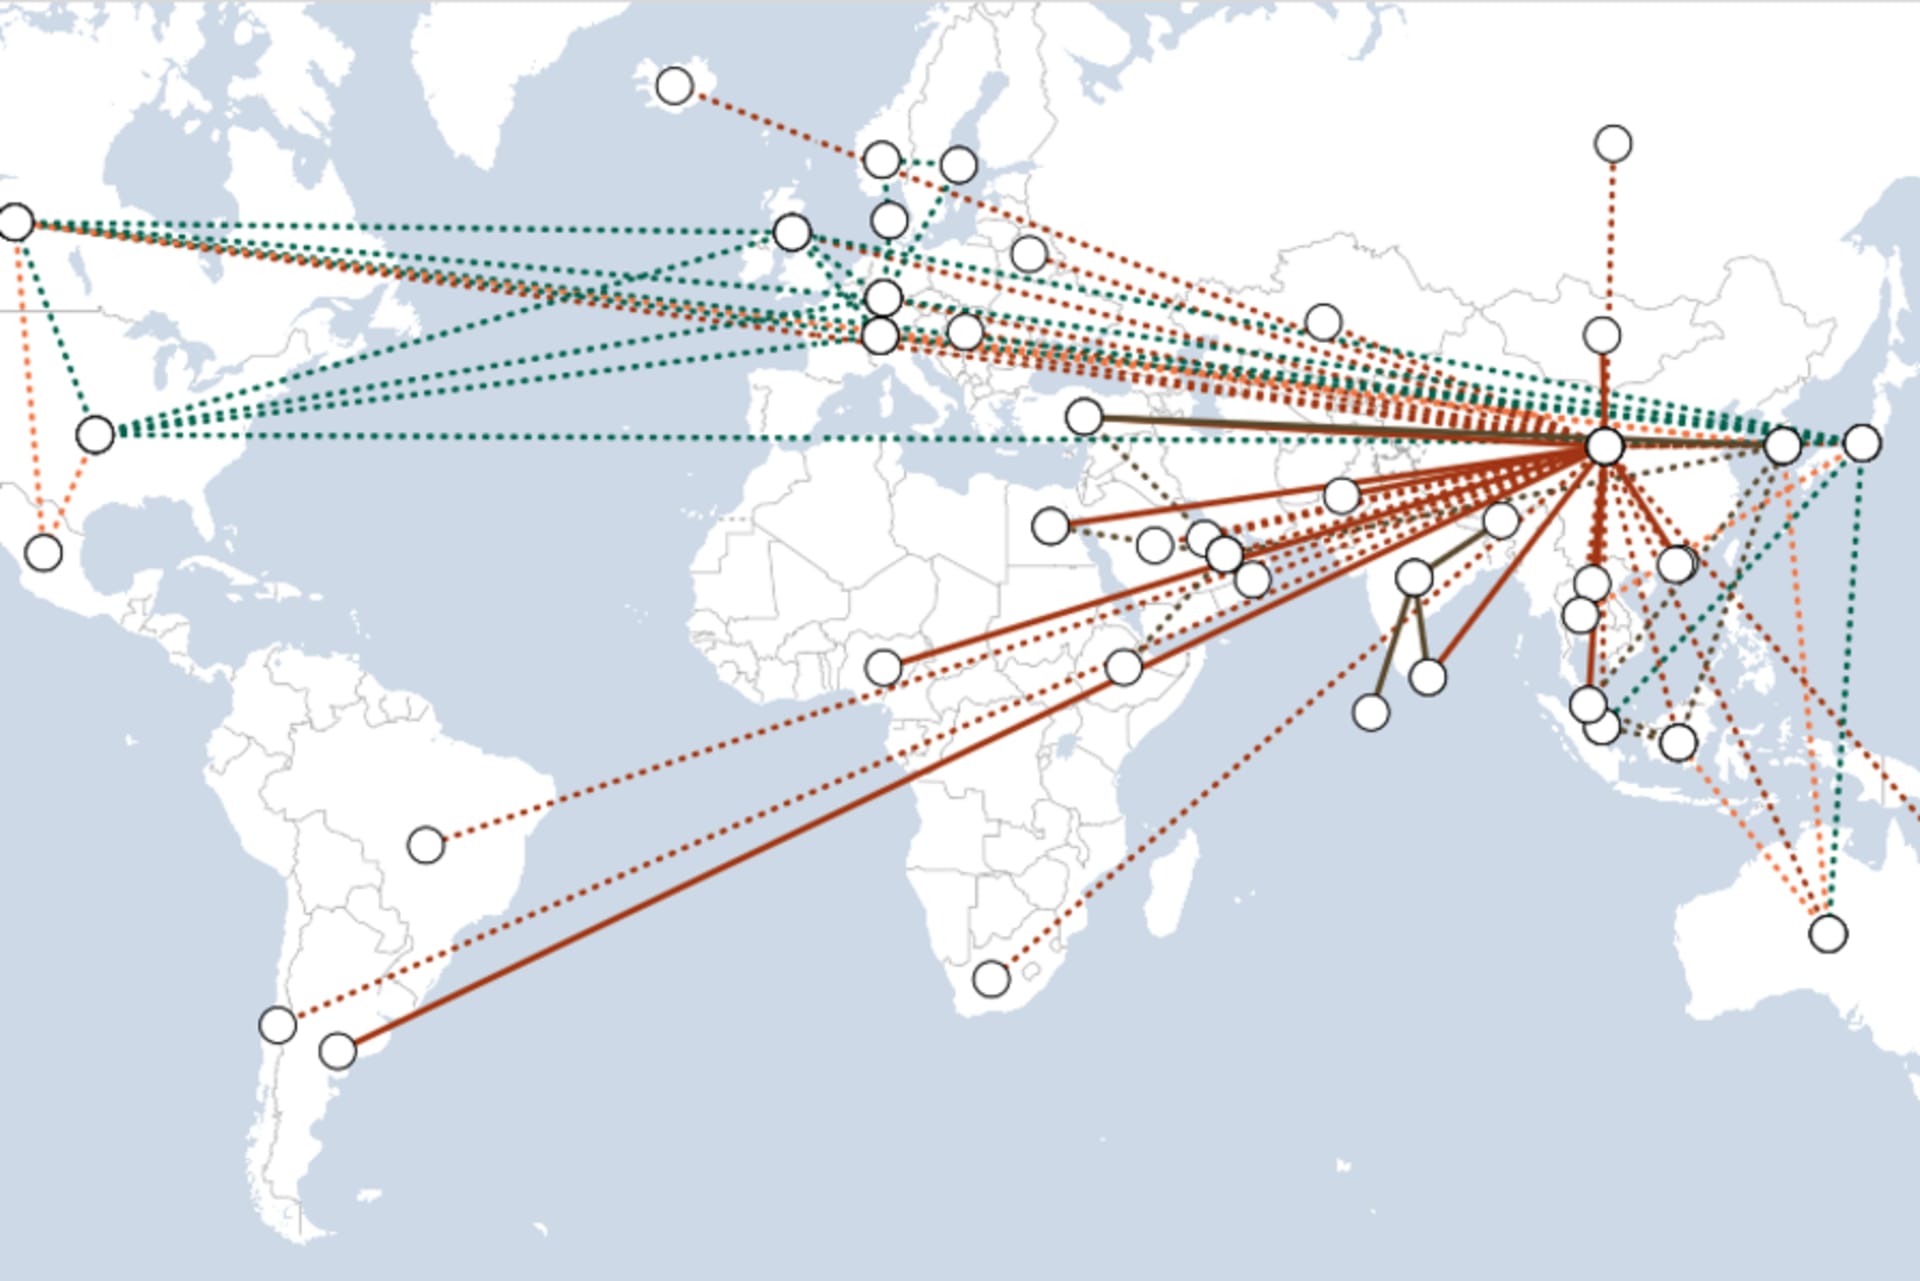
Central Bank Currency Swaps Tracker
Since the financial crisis of 2007, central banks around the world have entered into a multitude of bilateral currency swap agreements with one another. These agreements allow a central bank in one country to exchange currency, usually its domestic currency, for a certain amount of foreign currency. The recipient central bank can then lend this foreign currency on to its domestic banks, on its own terms and at its own risk. Explore the evolution of central bank currency swaps over time, in detail, through an interactive map.
Global Energy Tracker
As the effects of climate change mount, high-carbon energy sources continue to provide most of the world’s power. On average, 84 percent of tracker countries’ energy comes from high-carbon sources such as oil, whereas 16 percent comes from solar and other renewables. Low-carbon sources, however, are on the rise, particularly in developed countries.
Global Trade Tracker
The map compiles trade data from 178 countries as reported to the International Monetary Fund (IMF). It displays values for each country’s trade in tangible goods and, for countries reporting the necessary data to the IMF, it also shows the value on their current accounts (that is, adding in services trade, payments to investors abroad, and other foreign funds transfers).
Global Growth Tracker
The map compiles data on economic growth over one hundred countries around the world, mainly those that report quarterly data to the International Monetary Fund (IMF). Growth is defined as the rate of change, over the prior twelve months, in each country’s gross domestic product (GDP), which is the total value of goods and services produced there.
Global Imbalances Tracker
The CFR Global Imbalances Tracker can be used to gauge, through time, the vulnerability of individual countries and the global economy to the buildup of imbalances in the current account (of which trade deficits or surpluses are the largest component).
Global Inflation Tracker
The map aids in gauging inflation trends in almost two hundred countries around the world—mainly those that report data to the International Monetary Fund (IMF). The inflation rate is defined as the rate of change in the consumer price level over the prior twelve months.
Global Monetary Policy Tracker
CFR’s Global Monetary Policy Tracker compiles data from 54 countries around the world to highlight significant global trends in monetary policy. Who is tightening policy? Who is loosening policy? And what is the policy stance of the world as a whole?
Sovereign Risk Tracker
The CFR Sovereign Risk Tracker can be used to gauge the vulnerability of emerging markets to default on external debt. On the map, the darker the red the more vulnerable the country. The CFR Sovereign Risk Index value suggests the likelihood of a country defaulting within five years. The highest value, 10, means that the country has a 50 percent or higher chance of defaulting. (Three Tracker countries are in actual default: Belarus, Lebanon, and Venezuela.)