The Combined Surplus of Asia and Europe Stayed Big in 2016

A long time ago I confessed that I like to read the IMF’s World Economic Outlook (WEO) from back to front. OK, I sometimes skip a few chapters. But I take particular interest in the IMF’s data tables (the World Economic Outlook electronic data set is also very well done, though sadly a bit lacking in balance of payments data).*
And the data tables show the combined current account surplus of Europe and the manufacturing heavy parts of Asia—a surplus that reflects Asia’s excess savings and Europe’s relatively weak investment—remained quite big in 2016.
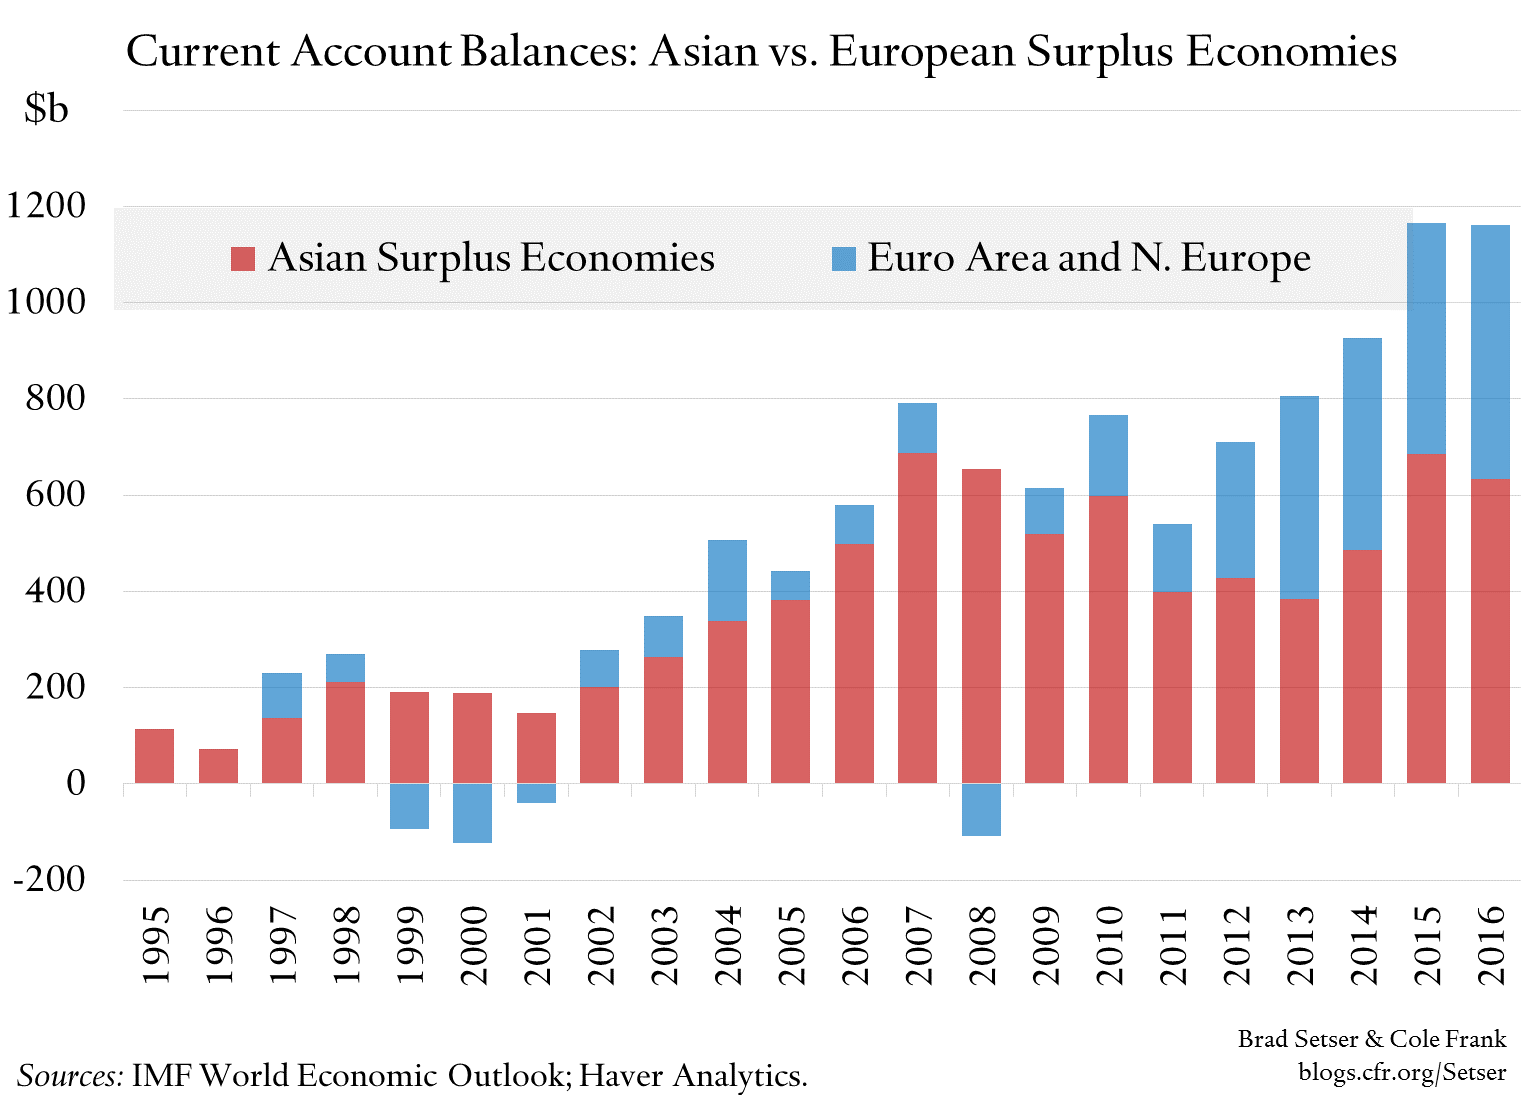
China’s surplus dropped a bit in 2016, but that didn’t really bring down the total surplus of the major Asian manufacturing exporters.
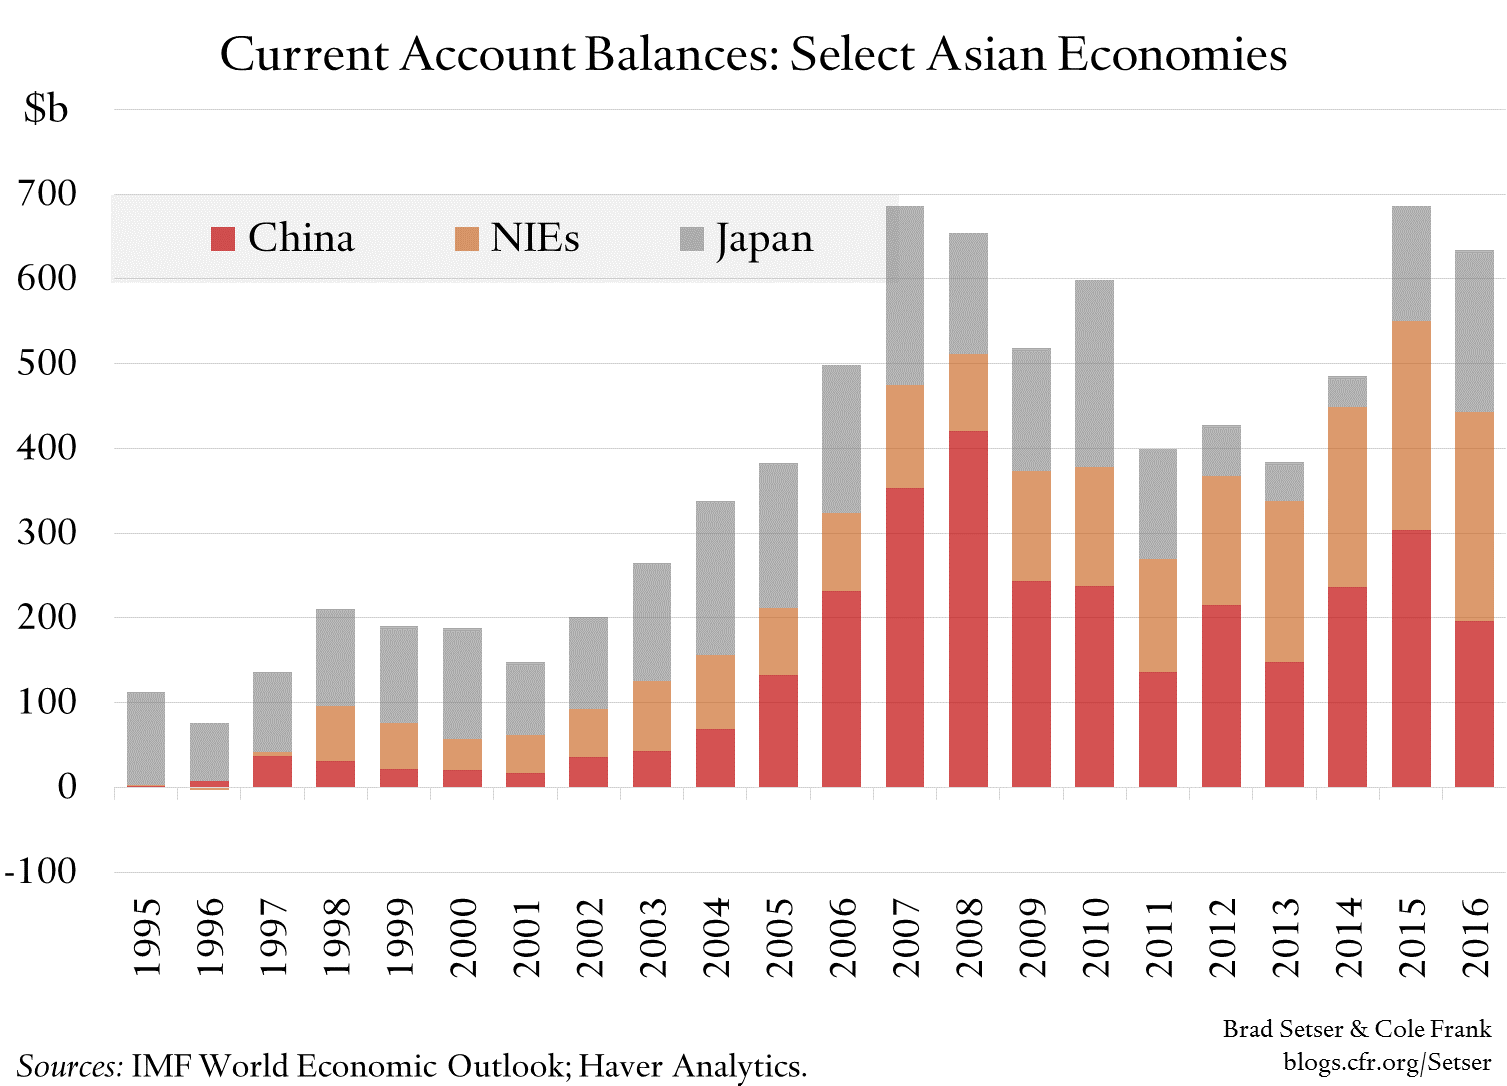
Much of the fall in China’s surplus was offset by a rise in Japan’s surplus. The WEO data tables suggest that net exports accounted for about half of Japan’s 1 percent 2016 growth—Japan isn’t yet growing primarily on the basis of an expansion of internal demand. And the combined surplus of Korea, Taiwan, Singapore and Hong Kong remains far larger than it was before the global financial crisis in 2008. The Asian NIEs (South Korea, Taiwan, Hong Kong, and Singapore) collectively now run a bigger surplus than China. As a result, in dollar terms—and also relative to the GDP of Asia’s trading partners—“manufacturing” Asia’s combined surplus hasn’t come down that much over the last ten years.
The size of the combined surplus of Europe and “manufacturing” Asia necessarily means that other large parts of the global economy need to run large deficits in manufactured goods. To be sure, barring an energy revolution, the big oil and gas exporters will necessarily trade oil for manufactured goods (and holidays), and parts of Asia and Europe equally will need to trade manufactures for energy. But the big Asian and European manufacturing exporters could not maintain surpluses of their current scale in the absence of a U.S. trade deficit in manufacturing that is as large as it was back in 2005 or 2006. There are only so many ways the global balance of payments can add up.
While the surplus of key parts of the global economy haven’t moved much, the nature of the financial outflows that channel the current account surplus of Europe and Asia (their savings surplus so speak) to the rest of the world has certainly changed. Setting a few countries (Switzerland, and perhaps Singapore***) aside, governments aren’t directly channeling funds abroad through the build-up of their reserves and the assets of their sovereign funds.
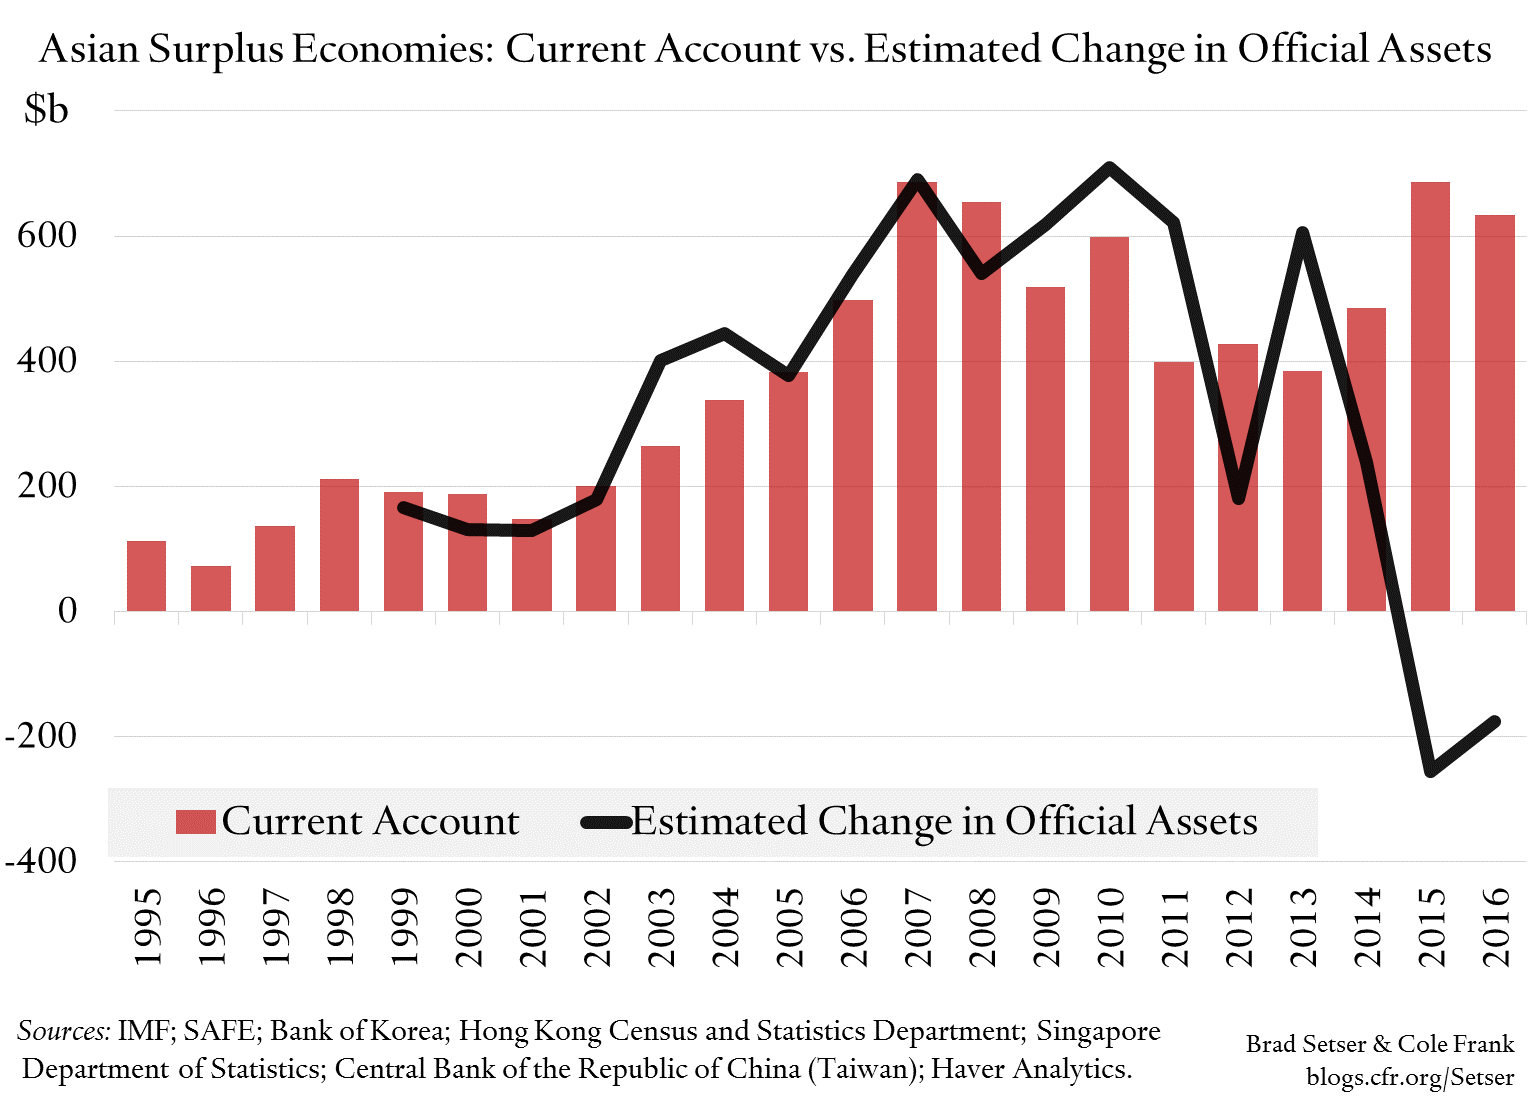
Here is a plot of the growth in Asia’s official assets. My measure of official asset growth is mostly reported reserve growth, but is has been adjusted to include changes in countries‘ disclosed forward position and China’s “other foreign assets.” I also added in the rise in the non-reserve portfolio holdings held by the public sector (and I assumed China’s portfolio outflows are from government institutions). This is a way of capturing sovereign wealth fund and public pension fund outflows. I did not add in the external lending of China’s state banks. To be honest these adjustments are primarily for my own satisfaction (they all come from the balance of payments data—I am trying to avoid valuation adjustment these days). Looking only at reserves (adjusted for forwards and China’s other foreign assets) would not materially change the picture.
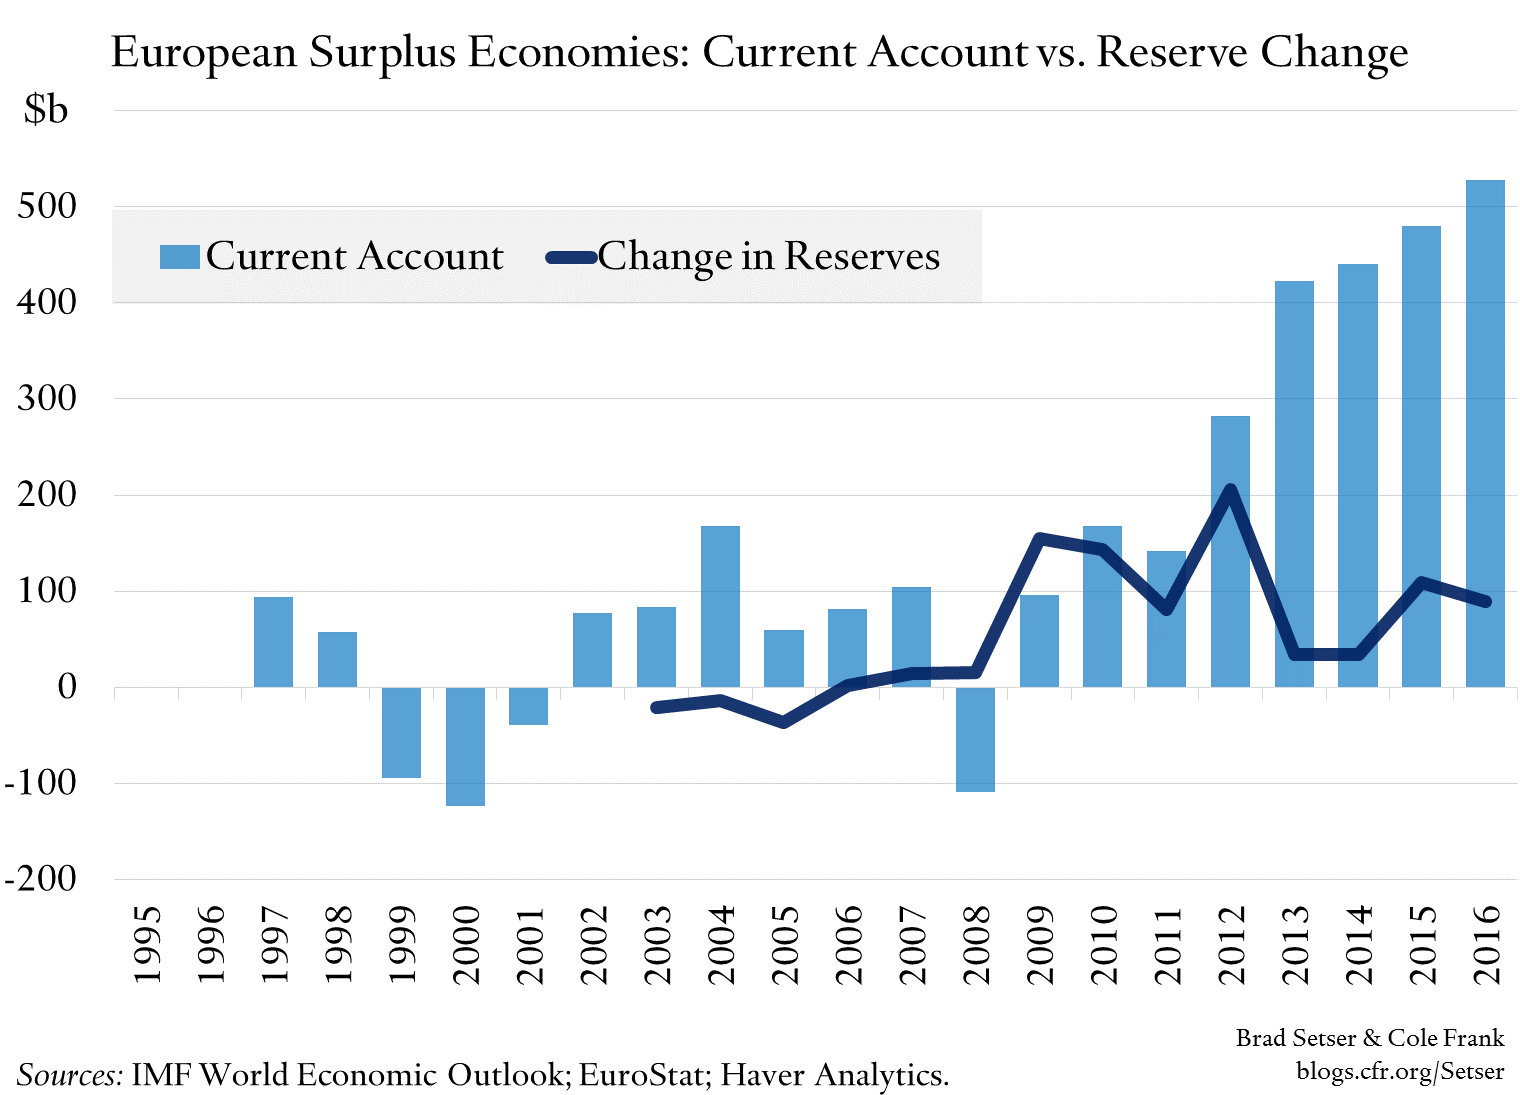
And here is the similar plot for Europe looking only at reserves (I didn’t include Norway—too much of an oil-exporter—so I didn’t really need to adjust for official non-reserve assets).
And here is a chart adding the reserve growth of the major oil exporting regions to Asian official asset growth.***
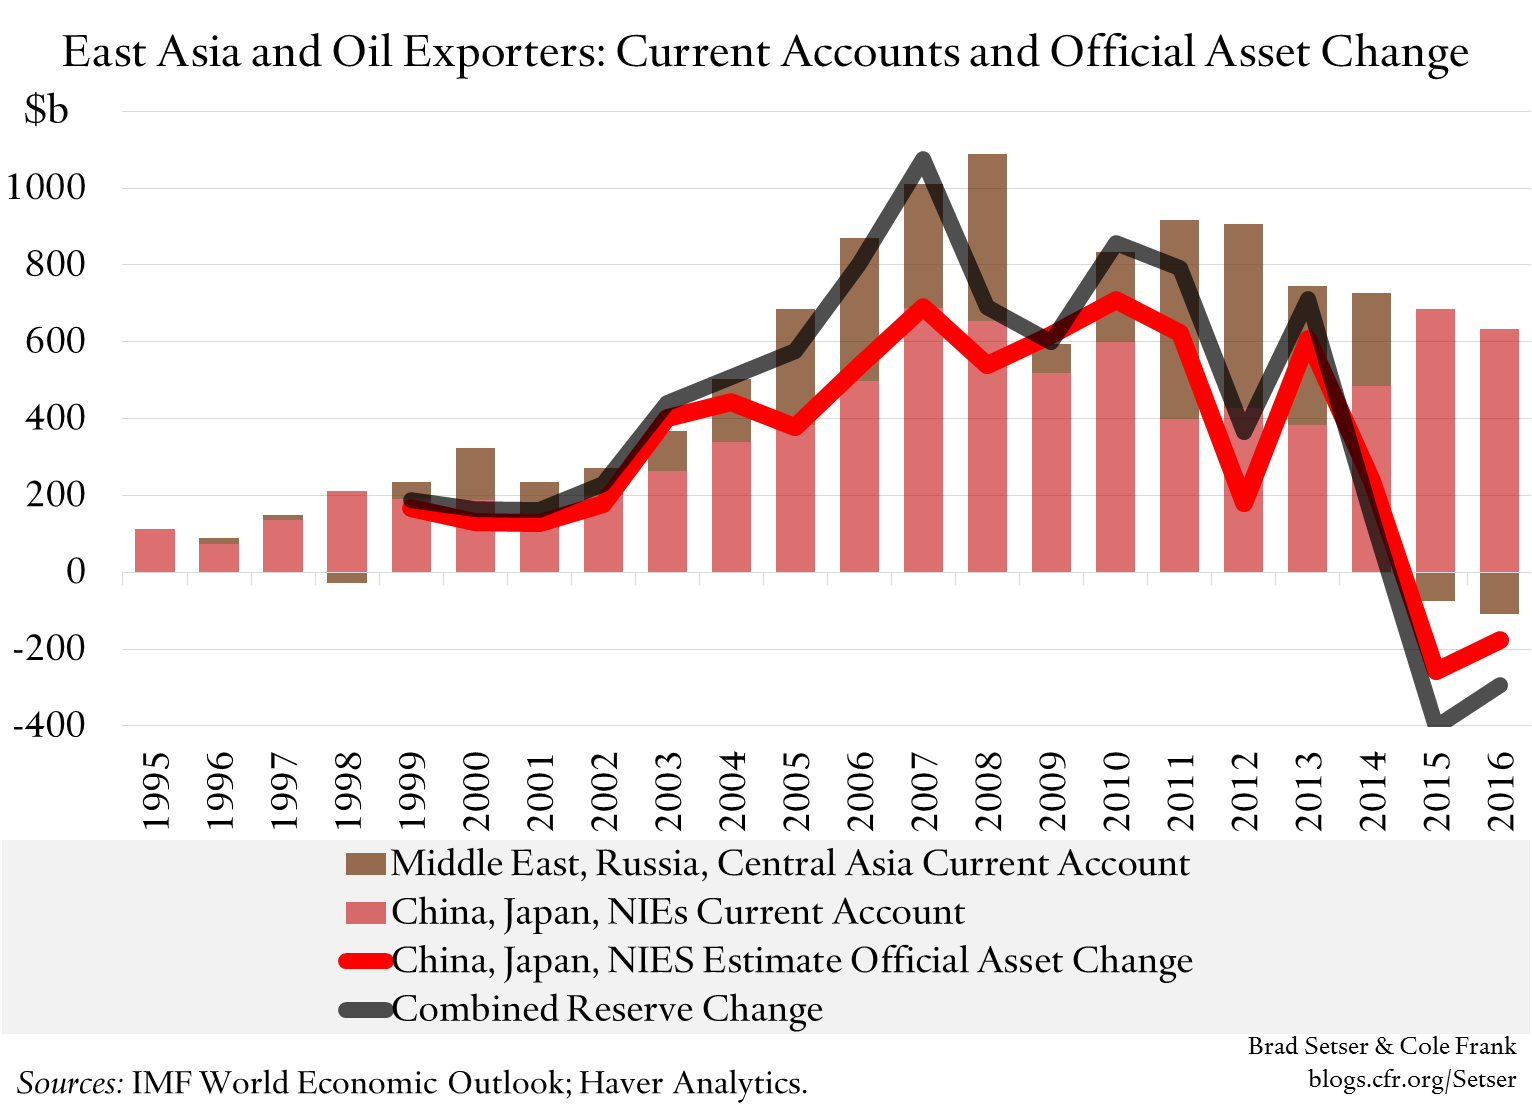
It clearly shows that the growth in official assets was correlated with the big run-up in their combined surplus prior to the crisis (for much more, see Joe Gagnon’s 2013 working paper, and his forthcoming book with Fred Bergsten) and that the countries that historically have accounted for most of the reserve build-up are now running down their stock of assets.
Broadly speaking, over the last ten years, Asia’s surplus hasn’t changed much while Europe has replaced the oil exporters as the second main driver of global payments imbalances. And private outflows rather than official outflows have become the financial counterpart to the world’s big current account surpluses. That in turn matters for the composition of inflows into the United States: the world is buying fewer Treasuries and far more U.S. corporate bonds—though Asia also seems to have regained confidence in Freddie and Fannie.
Taiwanese life insurers, Korean pension funds, and Japanese banks have more risk tolerance than traditional central bank reserve managers. The same is true of German insurers, Dutch pension funds, and for that matter Switzerland’s reserve managers—who have more freedom than most of their counterparts to buy equities and corporate bonds alongside traditional reserve assets.
Such changes in the composition of inflows to the U.S. could help explain why the IMF found that relative to fundamentals, U.S. corporate spreads seem a bit tight…
One last point: The U.S. Treasury suspects that this fall off in reserve growth is largely a function of the dollar’s strength, and has expressed concern that it may not be durable in its most recent foreign exchange report.
I generally agree: the world’s central banks historically have intervened far more when the dollar is weak than when the dollar is strong. The major surplus countries in a sense only need to step up and the use their government balance sheets when the market doesn’t want to fund the U.S. external deficit. But I also suspect the world’s big surplus countries are also now a bit more skilled than in the past at disguising their intervention—sovereign wealth funds can keep foreign assets off the books of the central bank, government pension funds often do some of the heavy lifting, and, in China’s case, the growth in the overseas lending of China’s state banks is likely to have structurally reduced the pace of reserve growth in good times. When intervention returns, it may not be primarily through the use of central bank balance sheets.
*The long-standing joke that the IMF stands for “It is mostly fiscal” applies to the WEO data set. Tons of fiscal numbers. And for the balance of payments, only the current account (at least for individual countries). Sad!
** The overall U.S. external deficit is of course smaller, thanks mostly to a large fall in the oil deficit. The rise in the offshore income of U.S. multinationals also helped, as did the fall in the rate the U.S. paid on its external borrowing.
*** I was lazy and did not try to adjust for the buildup of sovereign wealth fund assets in the Middle East. I have another technical complaint here. The IMF used to provide an estimate of official outflows from the Middle East and North Africa, which was a good proxy for the activity of the region’s sovereign wealth funds—it was one of the bits of the WEO data tables that I found most useful. With the shift to the new IMF balance of payments standard (BPM 6) the IMF now only reports aggregated portfolio outflows. The old breakdown was in some ways more useful. The IMF could help to address this by insisting that more countries report the disaggregated data on portfolio outflows—even when this shows that the public sector accounts for the bulk of outflows.
**** Singapore’s headline reserves aren’t moving, but Singapore’s forward book is now rising and government deposits abroad have soared—call me suspicious.