The 2007 US current account data

The US recently released its current account data for the fourth quarter. Among other things, the data showed another $150b in official inflows in q4, bring the total for 2007 up to around $400b. In both q1 and q4, official inflows awere almost as large as the US current account deficit. Official flows in q2 and q3 were smaller.
The official flows data - I suspect - will be revised up, both to reflect the 2007 survey and eventually the 2008 survey. Sovereign funds and central banks likely combined to add about $1400b to their assets in 2007. I doubt only $400b was invested in US assets. A growing sum is likely managed by private fund managers and thus not registering in the US data. The $50b increase in official holdings of Treasuries in the 2007 data looks awfully low to me, not the least because the Fed’s custodial holdings of Treasuries for foreign central banks increased by $70b.
I’ll take credit for arguing (or perhaps insisting) that the US data understates official inflows - and for arguing that the official sector’s already large purchases of US debt would likely have to increase during a US slump to avoid a dollar right. The argument that dollar depreciation was a necessary part of the process that would bring the US deficit down also seems broadly right.
But I also got one big part of the US current account wrong.
Back in 2006 I predicted that the income balance would deteriorate quite significantly in 2007. My logic was pretty simple: the average interest rate that the US was paying on its (mostly dollar-denominated) external debt was well below the average interest rate the US paid on its (mostly dollar-denominated) external lending. I expected the US borrowing rate would rise faster than the lending rate, and that - together with the ongoing rise in US external borrowing - would drive a significant deterioration in the US income balance.
That has not happened. The income balance actually improved in 2007. Richard Iley (see our debate in late 2006) was right. Consider the following graph. I expected the gap between a line plotting the US current account deficit (as a share of US GDP) and the line plotting the US trade deficit (goods and services) to get bigger. It didn’t.*
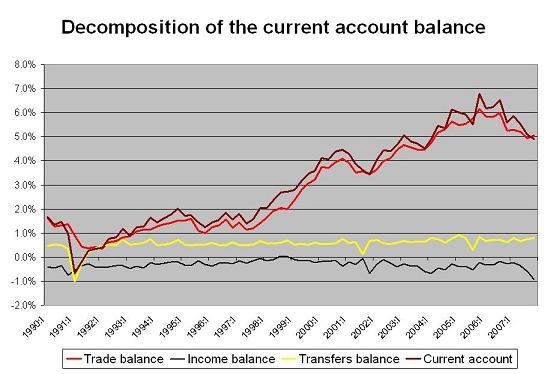
* The data here is the quarterly current account balance (seasonally adjusted) as a share of quarterly GDP (also seasonally adjusted). The sign has been inverted so a deficit is positive and a surplus is negative. That way a rise in the trade deficit is indicated by a rise in the line labeled trade balance.
Much more follows
I also expected the income balance to turn negative (or - in the graph above, positive; I have inverted the sign so a bigger deficit is represented by a bigger number). It didn’t. It actually improved quite substantially.
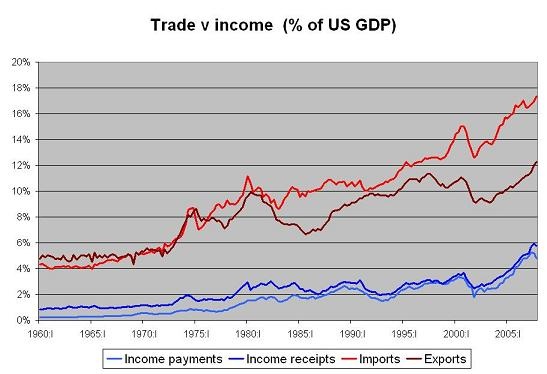
Both the income balance and the trade balance are worth unpacking a bit more. Both are the gap between two big numbers. The trade balance is the gap between imports and exports. The income balance is the gap between what the US pays on its external borrowing (and direct investment in the US) and what the US gets on its external lending and investment abroad.
Let’s start with the trade balance. It has improved both because (non-oil) import growth has slowed and because export growth has remained strong. A plot that adds residential investment and non-oil imports to imports and exports is illustrative.
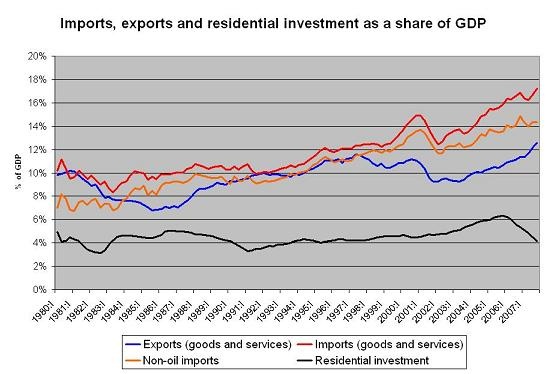
As residential investment has fallen, the pace of growth of non-oil imports has slowed.
Weakness in the US consequently is the main explanation for the slowdown in imports. But the steady rise in exports v GDP though cannot be explained by the fall in US residential investment - and slower US demand growth. The slide in exports (v GDP) started in 1997 - not coincidentally when the dollar started to strengthen. The rise exports to GDP started in late 2003, just after the dollar started to depreciate.
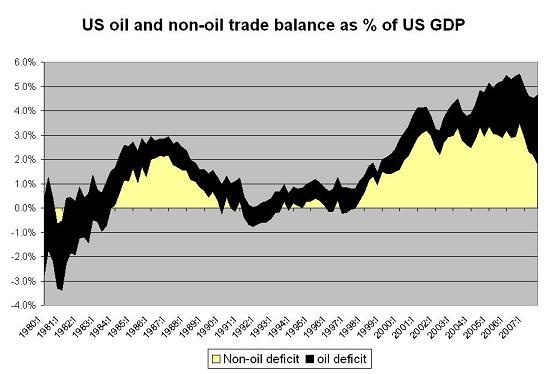
A plot that disaggregates the trade deficit into a petroleum and a non-petroleum deficit tells the story well. The non-petroleum deficit is coming down quickly. The petroleum deficit not so much.
What of the income balance. It too can be decomposed into the balance on FDI and interest (for simplicity, I have not tried to pull dividend payments on portfolio holdings out of the non-FDI data. These payments are small and we don’t yet have 2007 data, so this is not a major source of error)
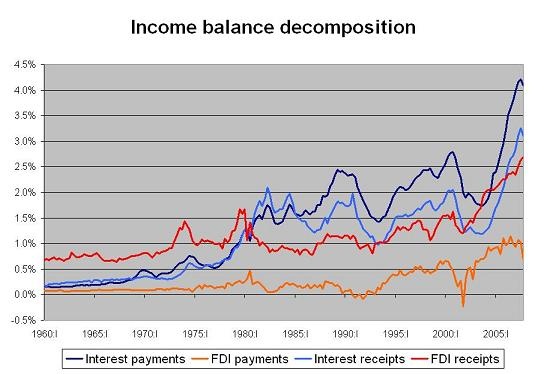
Four things jump out:
First, FDI receipts are much larger than FDI payments. It you plot the implied rate of return on US investment abroad v the implied return on FDI in the US, this stems from the very low reported return on foreign investment in the US. Almost all of the difference reflects different reported rates of reinvested earnings, not actual cash payments. I still that reflects tax arbitrage more than anything else - foreign FDI hasn’t consistently produced lower returns than holding treasuries, as the US data implies.
Two, directionally, though the FDI balance has improved a lot both because of stronger US returns abroad and weak foreign returns in the US. The sharp fall in FDI payments on direct investment in the US suggests the US is in recession.
Three, interest payments have increased sharply - rising to around 4% of US GDP. But so too have interest receipts. That reflects the growth in both US borrowing and lending - whether from true financial globalization or the growing use of London and other offshore financial centers by the “shadow banking system.” Carlyle Capital (which recently failed) used a London entity to borrow dollars to buy US mortgage backed securities.
Four, the increase in both interest payments and receipts has stopped and is now heading down. Most US lending and borrowing is denominated in dollars and fairly short-term. The fall consequently reflects the fall in US rates.
A plot of net FDI payments v net interest payments (the difference between the redish lines representing FDI income and bluish lines representing interest payments and receipts above) can help us understand the improvement in the income balance

The net balance on FDI improved sharply - mostly because of the fall in payments on FDI in the US. And - -more surprisingly - at least to me, the income balance stopped deteriorating. It actually got better over the course of 2007. Falling rates helped. But there is a bit more going as well. I had expected in late 2006 the interest rate on US borrowing abroad to rise relative to the interest rate on US lending as long-term rates caught up with rising short-term rates. Historically the US pays more on its borrowing than it gets on its lending (likely because of the term premium). The opposite though happened.
The implied interest rate on US lending was 0.35% more than the implied rate on US borrowing in 2006 - and 0.55% in 07. I had expected that gap to disappear. That is the main source of error in my earlier current account forecast.
To use the words of Hausmann and Sturzenegger, US dark matter grew really fast. That rise though reflects US weakness - falling rates, both short and long-term and falling FDI payments - not US strength. So it isn’t totally consistent with the dark matter story.
The fact that the US borrowing rate is so low - it was 4.65% in 2007 by my estimates - and remains lower than the US lending rate (5.2% by my estimate) is one of the great puzzles of the US data. Big borrowers with depreciating currencies usually have to pay a premium. The US is still borrowing at a discount. Its emerging market central bank creditors have been very kind. They are eating big currency losses without getting compensated with high interest rates.
There is more to tease out of the 2007 data, particularly the financial flows data. Financial globalization came to stop in q3 and q4. Inflows and outflows were both well below their q1 and q2 levels. I think this reflects the collapse of the (largely offshore) shadow banking system. And it will be interesting to compare official inflows to the growth in dollar reserves implied by the COFER data. But these are topics for another post.