Trading Volumes Underscore Brent’s Ascendance as World Oil Benchmark
By experts and staff
- Published
- Blake ClaytonAdjunct Fellow for Energy
West Texas Intermediate (WTI) and Brent have been locked in a multi-year wrestling match for the exalted status of the definitive world benchmark price of oil. WTI’s glaring deficiencies as a barometer of supply-demand fundamentals in the global crude market, owing to an oversupply of oil at its land-locked pricing hub of Cushing, Oklahoma, have been plain for several years now. But a close look at recent futures trading volumes shows that Brent has steadily surpassed its rival as traders’ preferred way to gain exposure to oil, marking an important moment in the North Sea benchmark’s arrival as the “real” price of oil, at least for now.
WTI futures, backed by a crude stream in the midwestern United States, were launched by the New York Mercantile Exchange (NYMEX) thirty years ago. The WTI daily closing price quickly emerged as “the” price of oil both in the media and industry shorthand. The Brent futures contract, based on the U.K. North Sea crude stream, came along five years later on the International Petroleum Exchange in London, now owned by the IntercontinentalExchange (ICE). The physical basis of the Brent contract has since widened to include other North Sea crude streams.
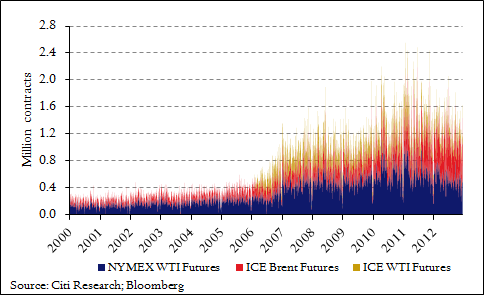
Both Brent and WTI futures saw a substantial increase in trading volumes beginning in 2006 (Figure 1 -- thanks to CFR adjunct fellow Daniel Ahn for these data). Trading in the two commodities, on both NYMEX and ICE, averaged five times in 2012 what it had in 2000.
Figure 1. WTI and Brent futures daily trading volumes (2000-2012)
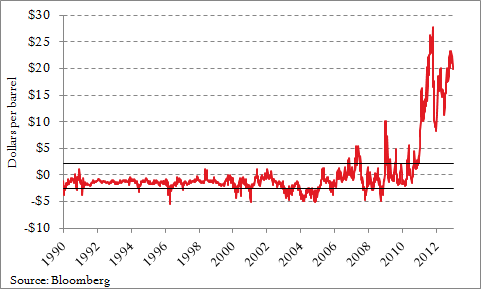
Until several years ago, the price spread between the two benchmarks was highly predictable. Brent traded at a mean-reverting discount of about $2 per barrel to WTI, largely reflecting transportation costs between Northwest Europe and Cushing (Figure 2) as barrels were pulled westward across the Atlantic. Beginning in the spring of 2006, though, that historically range-bound relationship began to break down. The spread has since jumped to once-unthinkable levels, with front-month Brent commanding a premium over its American counterpart that reached an all-time high of $28 per barrel in October 2011. It has since moderated to around $17.
Figure 2. Front-month ICE Brent - NYMEX WTI price spread (1990 – 2013)
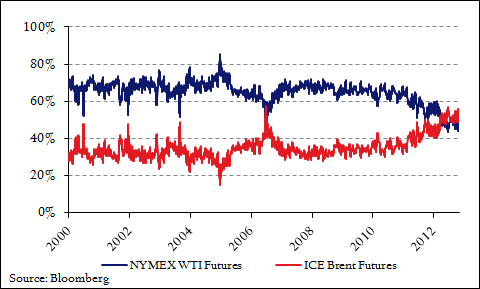
There are various physical reasons for the spread’s blowout, which will be the topic of my next post. But one result of the altered behavior of NYMEX WTI and ICE Brent forward curves is that traders are opting out of WTI and into Brent to trade crude (Figure 3), a trend highlighted in a recent Citigroup research report. This should not be surprising: the landlocked American benchmark has become dramatically less representative of global supply-demand fundamentals than its seaborne European cousin (though Brent has shortcomings of its own), and its perpetually contangoed near-dated futures contracts have made it less advantageous for some trading strategies.
Figure 3. Percentage of daily trading volume in NYMEX WTI vs. ICE Brent futures
Trading volumes are only one indication of the usefulness of either benchmark as the global marker price, but the fact that ICE Brent surpassed NYMEX WTI in that respect last year—a trend that is poised to continue in the near-term—is indicative of a larger reality: WTI, formerly the most important oil price benchmark, has lost its primacy to the North Sea marker. More and more, Brent is solidying its status over WTI as the global crude oil price to watch.
Why has this happened, and how long will it last? I’ll give some thoughts on those questions in another post.