Just how much money does China have? How fast are China’s foreign assets growing? And how much is hot money?

Answering these questions has been a long-term obsession of mine. I am not sure I have the answers, even now. China’s government doesn’t make tracking the growth of its foreign assets easy.
But I do have fairly detailed estimates. What’s more, these estimates are generally based on data that China itself releases, often in somewhat obscure places – though, given data lags, I sometimes have made estimates to bring a data series up to date. Of course, both my interpretation of the data and the assumptions I have used to produce data through the end of June could be off. These are estimates.
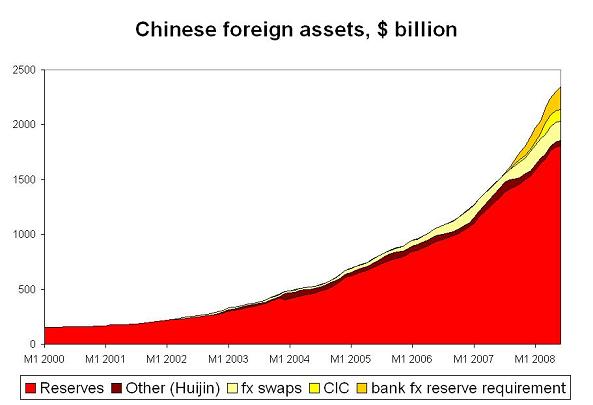
Based on the assumptions laid out in the technical notes, including an assumption that the transfer of foreign exchange to the CIC was largely completed by the end of q1 2008, I estimate that China’s government currently manages between $2.3 and $2.4 trillion in foreign assets. The central bank (SAFE) manages $1.8 trillion, the CIC manages $109 billion (my assumption), and the state banks manage $430 billion. This implies that China’s state banks have become one of the largest reserve managers in the world -- their combined portfolio trails only the reserves of Japan and Russia. The combined portfolio of the CIC and the state banks it formally owns would make it the second largest SWF in the world.
The pace of growth in China’s foreign assets is equally impressive – I estimate China added, after adjusting for valuation changes, something like $785 billion to its foreign portfolio over the last 12 months (i.e. from June 2007 to June 2008). Just a bit under $420 billion of this comes from the increase in the central bank’s reserves. The CIC got an estimated $107 billion (after adjusting for its purchase of Huijin and the funds it injected into the CDB), and the banks holding of foreign exchange increased by a little more than $250 billion. Most of that increase ($200 billion) comes from the fx held as part of the banks reserve requirement; the remainder comes from an apparent increase in the banks swaps position with the central bank in the second half of 2007.*
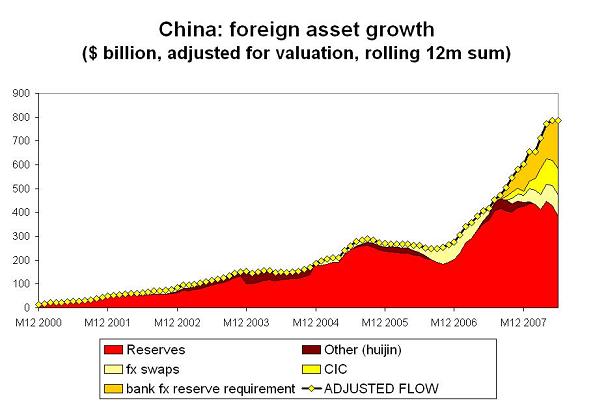
For the first half of 2008, China added – as best as I can tell – about $430 billion to its foreign assets, with $250 billion coming from the increase in China’s reserves (after adjusting for valuation gains), $90 billion coming from the increase in the CIC’s foreign assets and $90 billion coming from the increase in the banks reserve requirement. This estimate is close to the estimate of Michael Pettis and also to the estimate of Logan Wright.
It is worth noting that if this analysis is right, the increase in China’s foreign assets over the last 12 months was larger than the US trade deficit over that time – and far larger than the United States’ non-oil trade deficit.
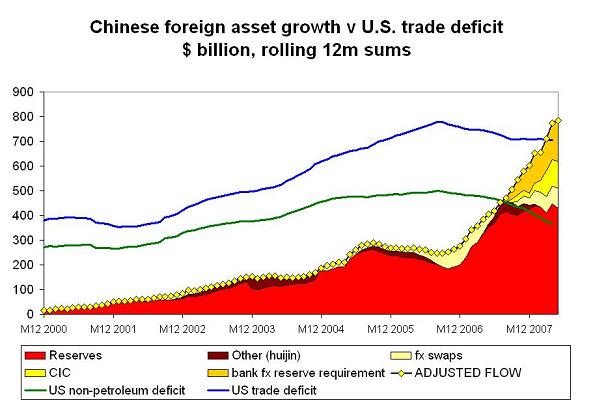
Not all of China’s foreign assets are in dollars. But if a significant fraction are, China isn’t just financing its own exports to the US. It is in some sense financing everyone’s exports to the US. Or alternatively, it is financing capital outflows from the US. This has been a quiet bailout only because China hasn’t made its financing of the US conditional on US policy changes. The scale of the financing is enormous.
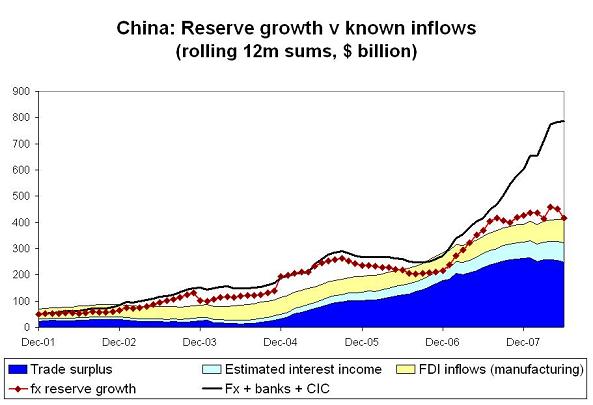
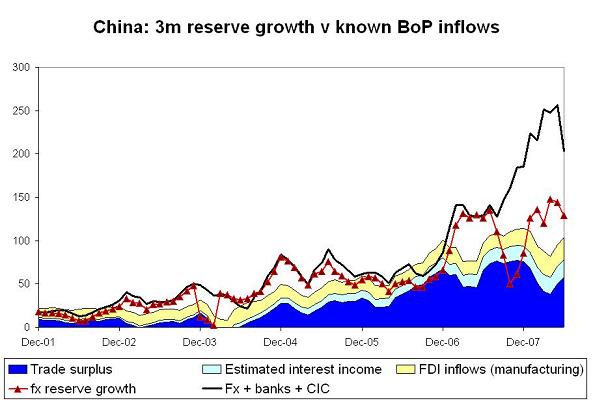
The data set tracking China’s foreign asset growth also allows me to estimate hot money inflows into China, as the growth in China’s foreign assets can be compared with China’s trade surplus, its estimated interest income, and FDI inflows. Before doing this, though, I want to acknowledge that Qing Wang’s critique of this methodology for estimating hot money flows is right. Summing estimated interest income and trade doesn’t produce a data series that matches the current account balance perfectly, as it leaves out transfers (largely remittances from the diaspora). The monthly FDI data also doesn’t capture all FDI inflows – in recent years, the FDI inflows in the final balance of payments data have been larger than the sum of the monthly FDI inflows released by China’s commerce ministry. And finally, there are inflows – QFII inflows for example – that wouldn’t normally be thought of as hot money.
As a result, this methodology will tend to overstate “true” hot money inflows if the trade and FDI data doesn’t include any disguised inflows. My hope is that the errors offset – that hot money disguised as FDI is large enough to balance the “not hot” flows counted as “hot money” by this methodology. The main virtue of the trade+ interest income + FDI methodology is that it allows a consistent comparison of the gap between known sources of foreign asset growth and observed foreign asset growth over time, not that it provides an accurate measure of hot money flows. It captures trends better than levels.
So what does this data show?
Well, there has been a large increase in the gap between my estimate of China’s foreign asset growth and easily identified sources of reserve growth over the last 12 months – a gap that likely corresponds with a rise in hot money inflows.
This makes intuitive sense. Over the last 12 months, the US has cut rates while China has held rates constant and the pace of RMB appreciation (against the dollar) has picked up, increasing incentives to hold RMB rather than dollars.
The same data can be examined on a rolling 3m basis to get a better idea of recent trends.
The recent data suggests that hot money flows have fallen off a bit – as total foreign asset growth in May and especially June was well below the level in April.
The high frequency data also provides ground for caution though. Look at q4 2006 v q1 2007. The data suggests hot money outflows in q4, and then huge inflows in q1 2007 (q1 was the quarter when Chinese reserve growth really popped up). While I have little doubt that there was a big increase in Chinese foreign asset growth in early 2007, I suspect that the transition was a bit smoother than my data series implies – i.e. I am missing some foreign asset growth in q4 2006, and my adjustments may overstate foreign asset growth in q1 2007. That is just a hunch though. In a similar way, I wouldn’t be surprised if the June increase in China’s foreign assets is somewhat larger than the data China just released implies. But that is very much a hunch.
A plot of the gap between foreign asset growth and trade, interest income and FDI inflows – with the gap used a proxy for hot money – shows that inflows have leveled off, or perhaps even turned down recently.
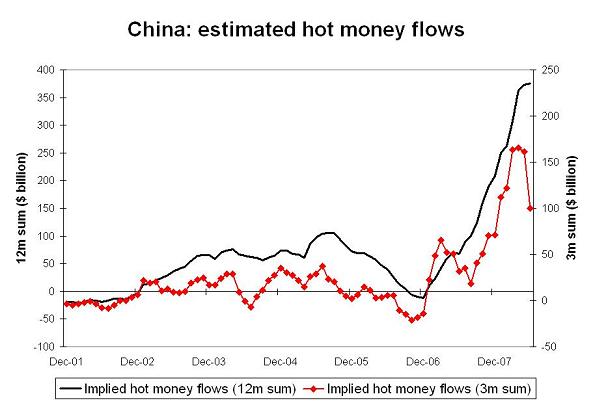
But they remain at a very elevated level. It still isn’t clear, at least to me, if China’s controls are effective enough to allow China to sustain a significantly tighter monetary policy than in the US while it still manages its currency against the dollar. We will see.
And in the interim, do read Dr. Yu’s overview of China’s economy - and the current monetary policy debate in China.
Technical notes
I have estimated the state banks’ foreign assets using their fx liabilities, not their reported fx assets. I have in effect assumed that they match their liabilities with assets, and fx liabilities with the central bank are held offshore.
The key line items I have used in my estimates include
In the PBoC data on the “Sources and uses of funds in financial institutions (in foreign currency), ”other items“ (in the set of ”sources of foreign exchange“). This line item jumped in early 2004, just after the first round of Huijin recapitalizations. This data series has not been updated for 2008. I have assumed that it hasn’t changed.
And in the same table, the line item under sources labeled “purchases and sales of foreign exchange.” This line item increased rapidly in 2006, when the banks started buying large amounts of foreign debt. This line item fell in the first part of 2007, when reserve growth suddenly accelerated, and then moved up in late 2007 (when reserve growth slowed, relative to the trade surplus). This data series has not been updated for 2008. I have assumed that there were no additional changes.
I also have assumed that the “other foreign assets” reported on the PBoC’s balance sheet reflects the banks fx reserve requirement. Stephen Green, Wang Tao and Logan Wright have all argued that there is a close correspondence between the rise in this line item and the rise in bank reserve requirements likely held in foreign exchange. This data is current through April. Based on Logan Wright’s work, I have assumed a $18b increase in May, and another $36b increase in June.
The result of these adjustments is a data series that is consistent with China’s balance of payments data -- if one assumes that Chinese banks have been accumulating foreign assets on behalf of the central bank. We know, for example, that private Chinese investors (likely the state banks) bought a lot of foreign debt in 2006 (see Qing Wang). There also was an increase the state banks fx liabilities from the “purchases and sales of foreign exchange” in 2006, a line item that likely reflects one leg of the banks swap transactions with the central bank. In 2007, private Chinese investors (again, likely the state banks) increased their deposits in the international banking system. There also was an increase in the PBoC’s “other foreign assets” in 2007, a line item that likely reflects the foreign exchange the banks have been asked to hold as part of their reserve requirement.
I have assumed that the CIC’s foreign assets increased by $13 billion in q3 2007 (largely because of purchase of Huijing), by $4b in q4 2007 (largely because of the recapitalization of the CDB and one other state bank) and $90 billion in q1 2008. This estimate is subject to substantial uncertainty, especially with respect to the timing. It is a lower estimate for the CIC’s foreign assets than most because I am trying to capture the foreign assets actually managed by the CIC, not funds shifted to the state banks.
Finally, for the first three line items, I have looked at changes relative to a baseline – i.e. changes relative to the levels of early 2003 for the “purchases and sales” and ‘other liabilities” and changes relative to end 2006 for “other foreign assets.” I wanted to capture the policy changes that I think the “pops” in each of these line items represent, not whatever was going on before. This is a bit arbitrary.
I welcome critiques of my methodology. There is a risk that I am misinterpreting the bank data. And there is also a risk that I am double counting something, missing something or generally off a bit. The methodology is essentially the same as the methodology I used in my January paper on China’s foreign assets, but it has been updated to reflect the banks new fx reserve requirement in a more systematic way.