The iPhone, the IMF, and China’s Balance of Payments
The iPhone is priced correctly in China’s customs trade data. A seemingly banal observation that leads to big questions about China’s post 2022 balance of payments methodology.

China’s GDP statistics are widely thought to be, well, works of performance art.
Targets, once set, are almost always met. GDP—apart from the pandemic years—smoothly glided upward.
And since China doesn’t report high quality data about the composition of its economic output, it is hard to construct a fully consistent alternative path for China’s economy.*
China’s balance of payments (BoP) data used to be somewhat more credible. After all, data on China’s trade with the world can always be checked against the data reported by its trading partners.
But even there, the quality of China’s data is falling.
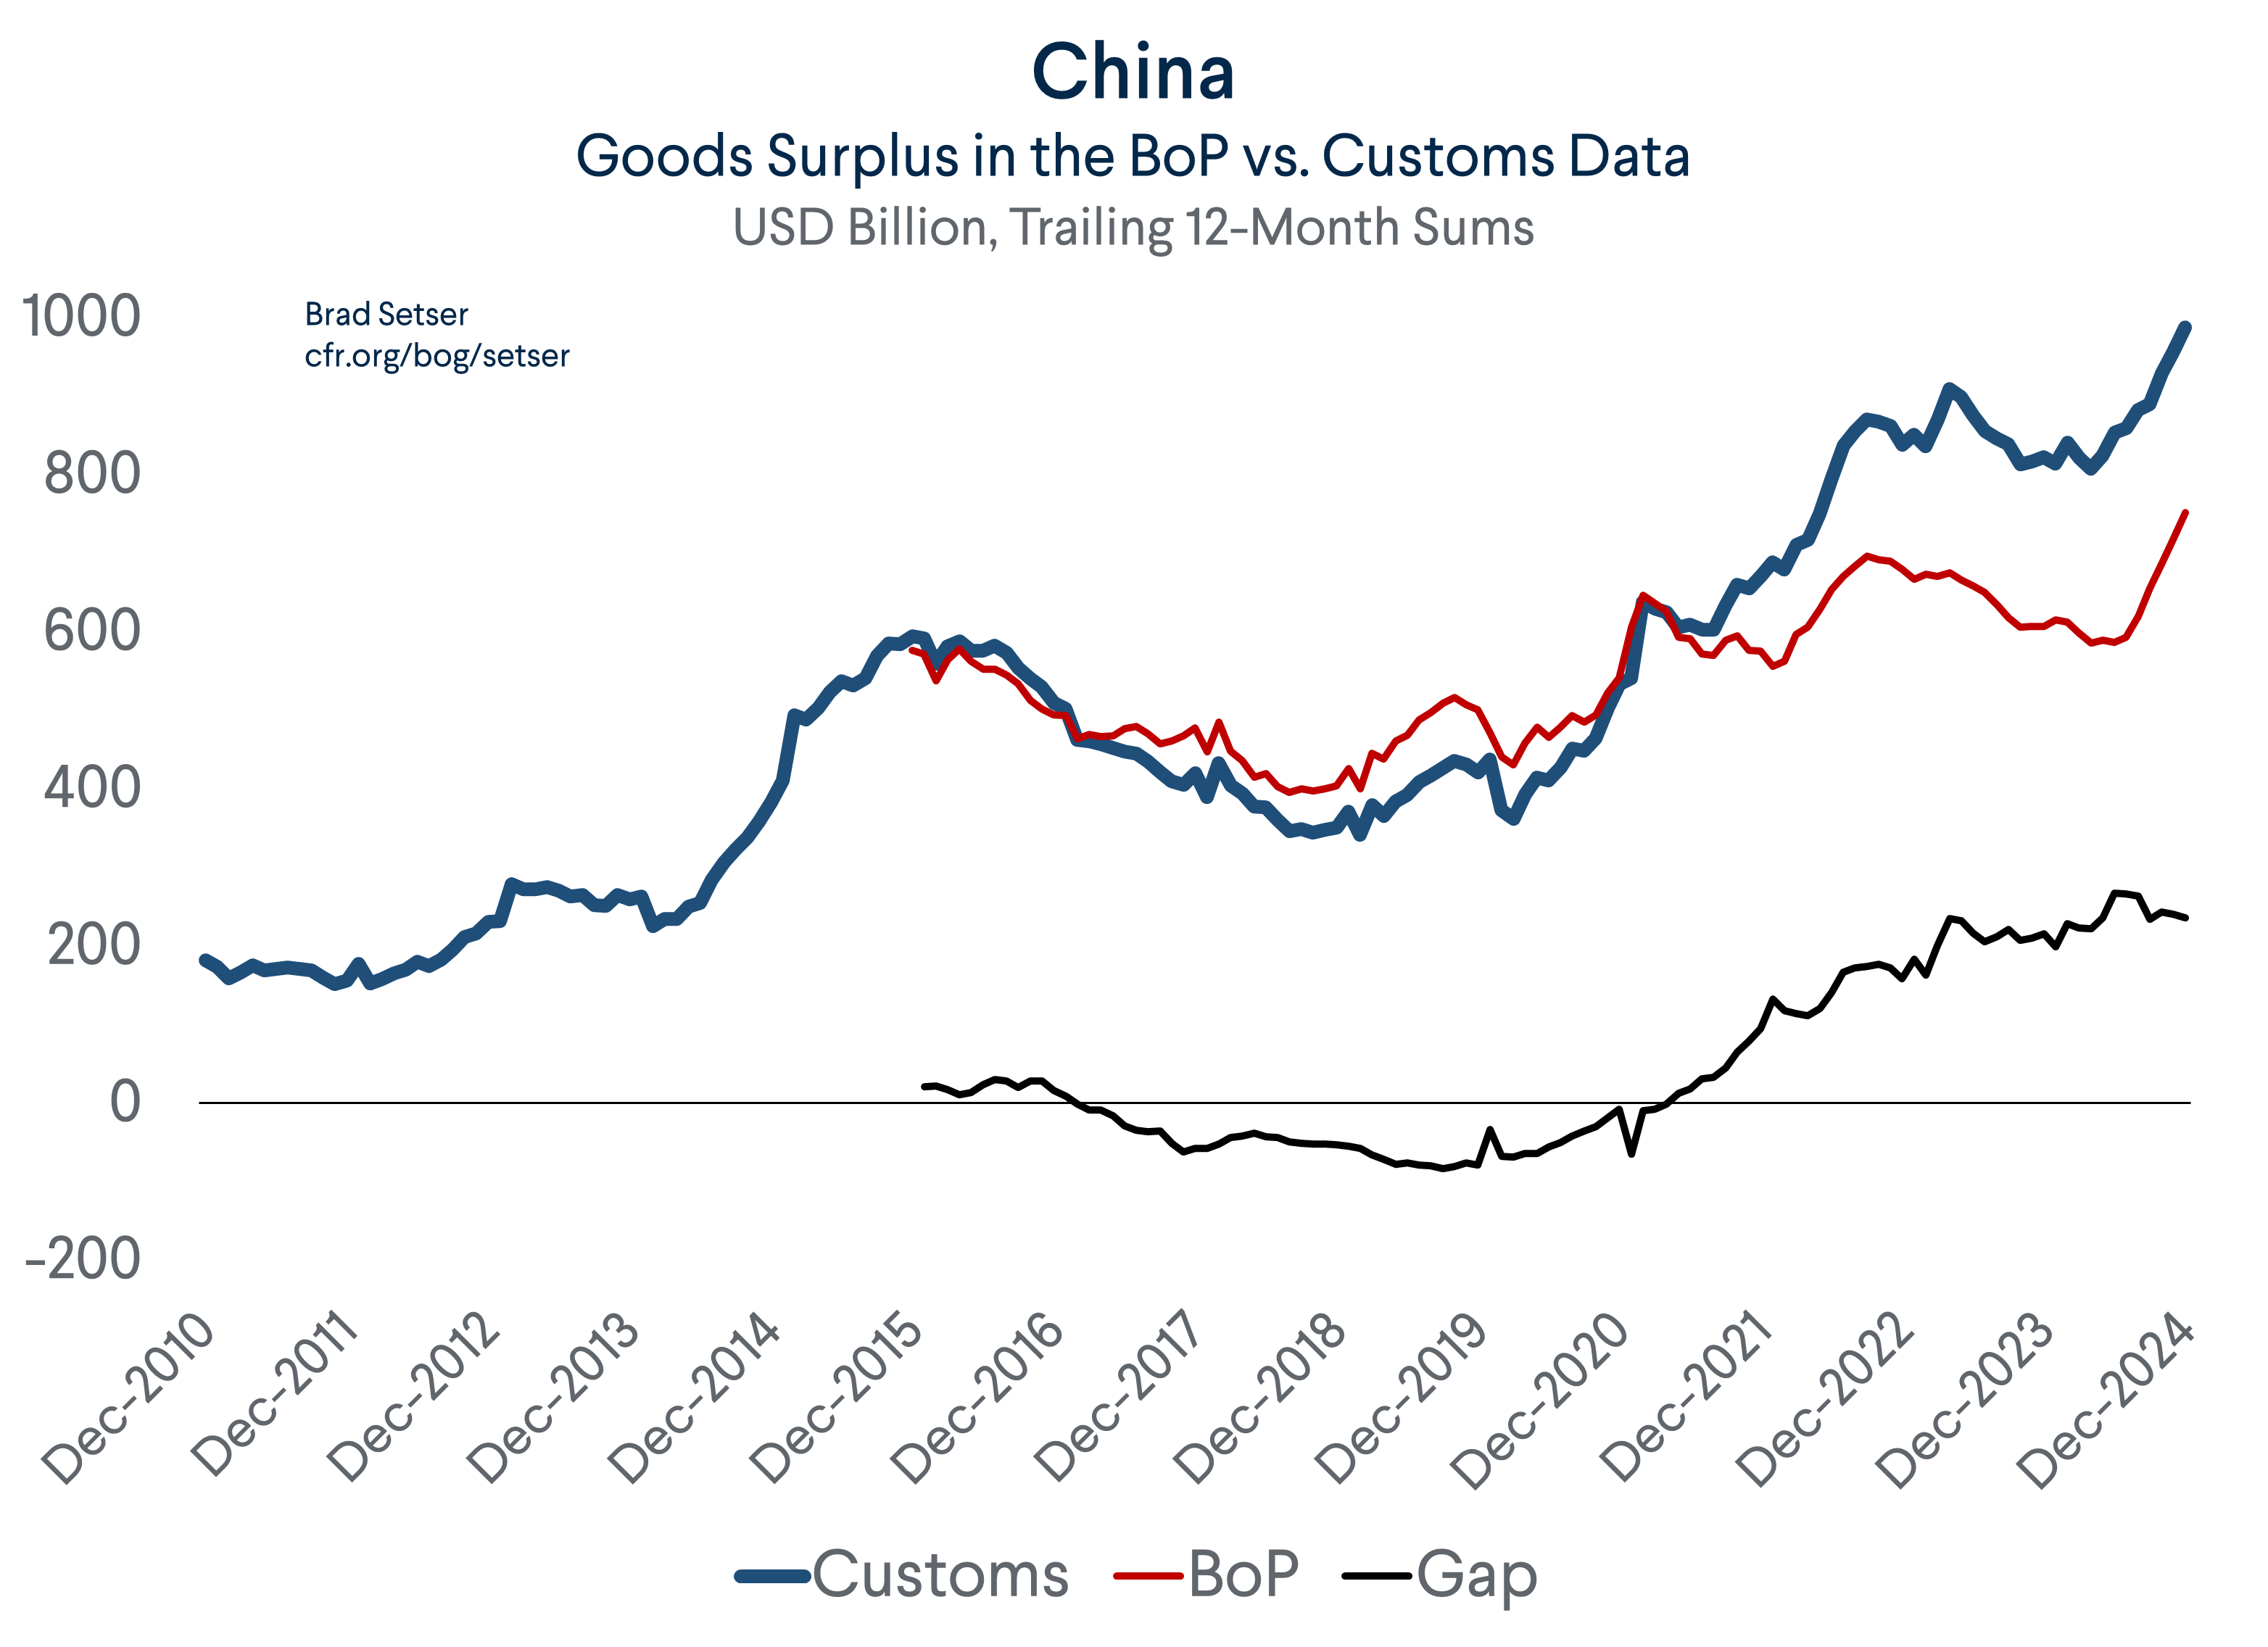
China’s $1 trillion customs goods surplus generally checks out; its trading partners collectively also report a large deficit with China.**
But something strange happens when the customs data gets translated into China’s formal BoP reporting. The $1 trillion dollar customs goods surplus shrinks down to a ~$400 billion current account surplus.
The adjustments that magically shrink China’s surplus aren’t credible, as the rest of this post will argue.
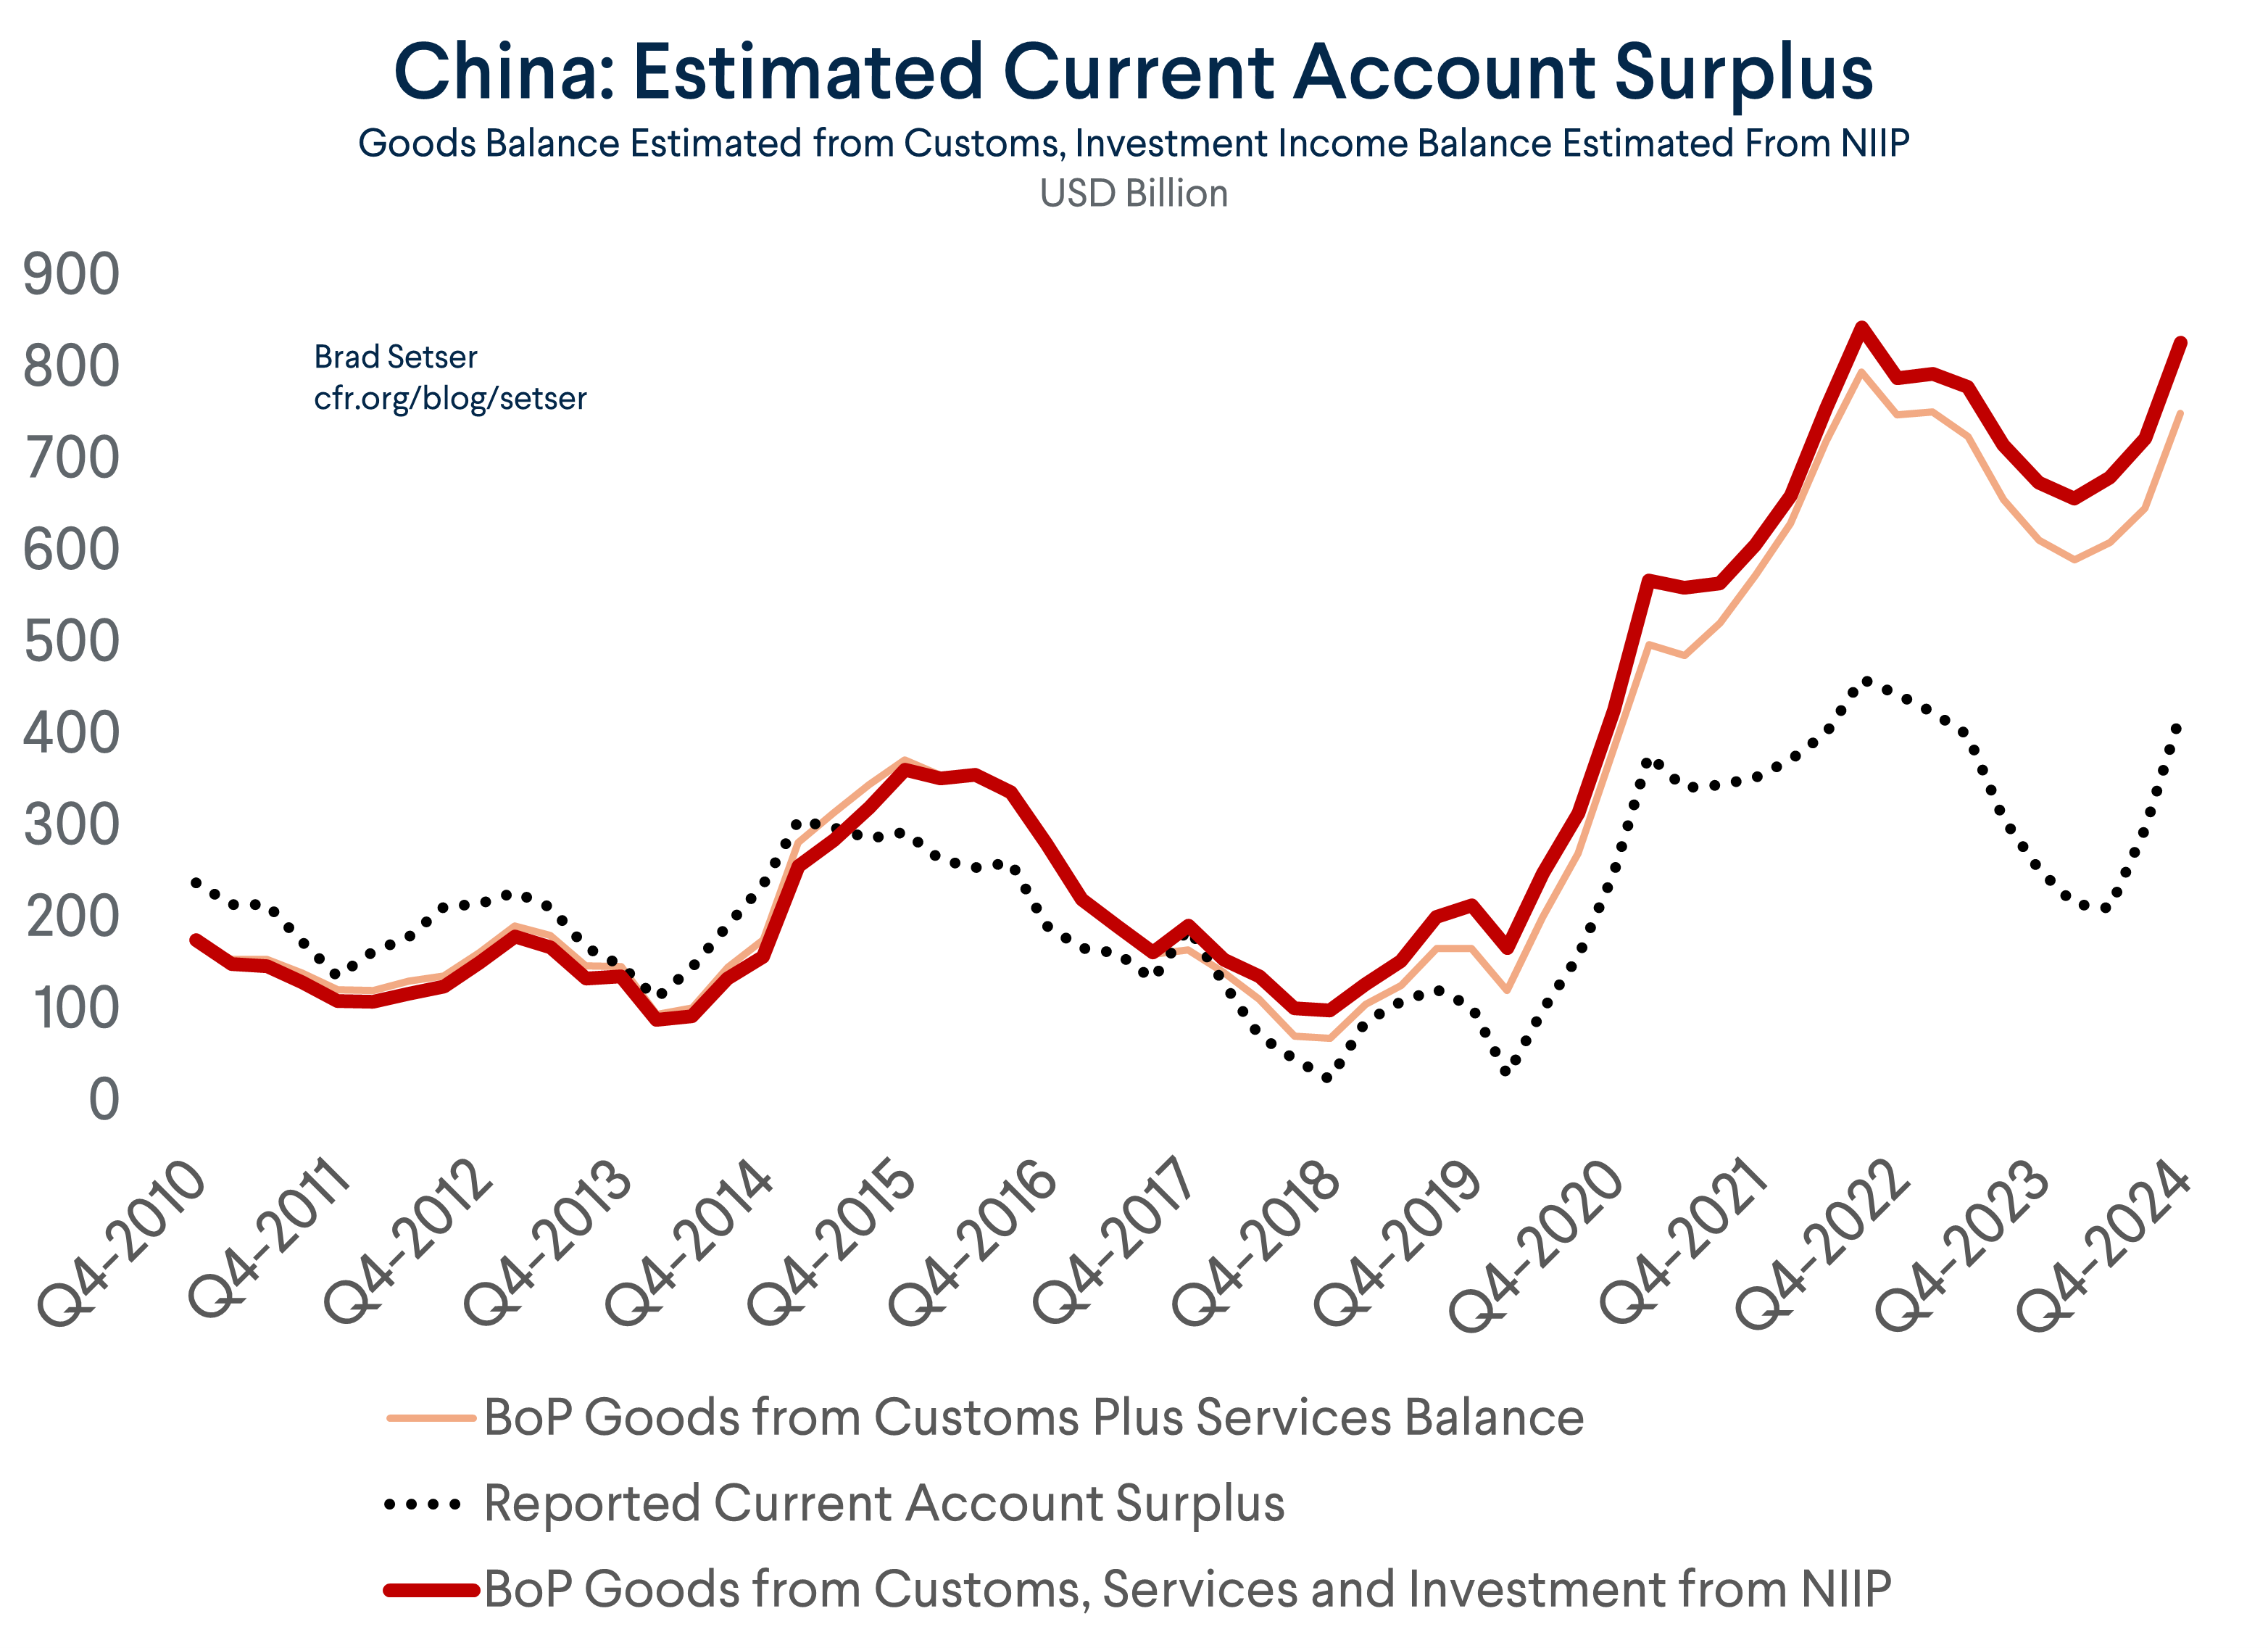
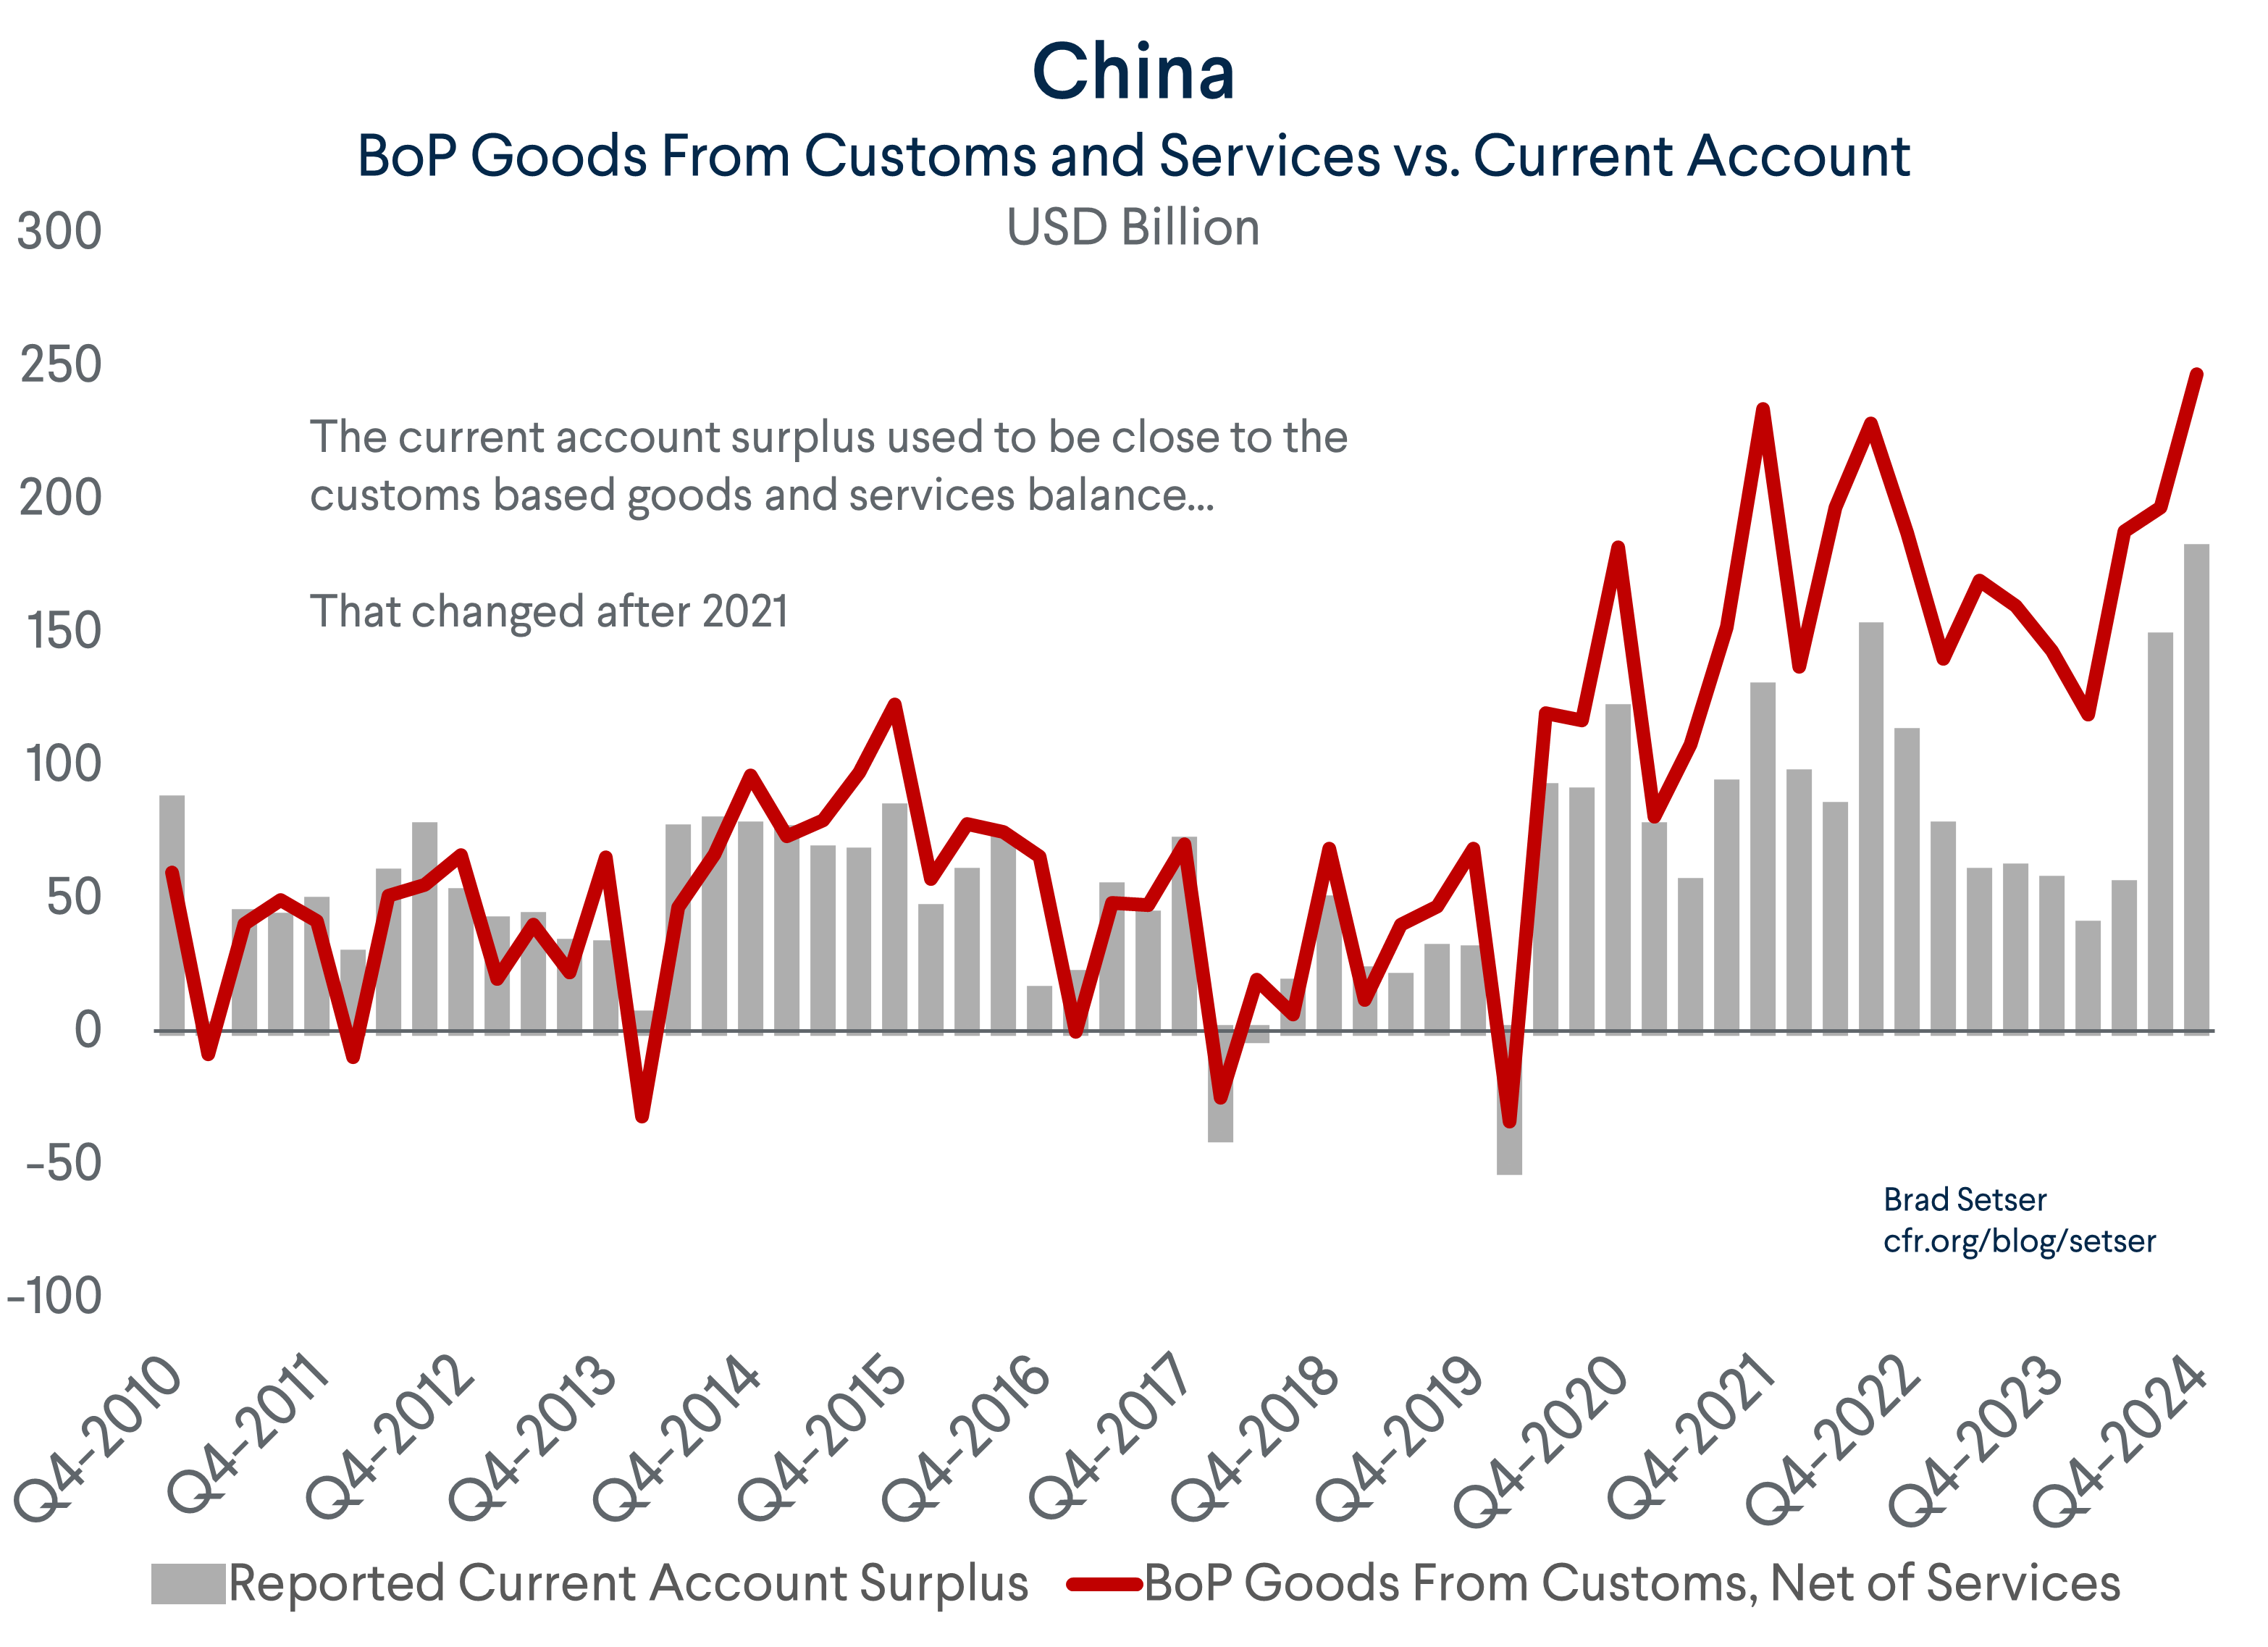
Let’s start with the basics. The Chinese customs (GACC) surplus, net of services imports, used to be a good guide to the overall current account surplus.
On a BoP basis, the goods balance will differ a bit from the customs balance, as the cost of shipping and insurance is moved over to the services balance and China’s balance of payments exports were also a bit below customs exports even before SAFE revised its BoP methodology. A realistic estimate of the goods and services balance using China’s pre-2022 BoP methodology would put that surplus at just under $800 billion dollars (think a $1000 billion goods surplus and a $225 billion services deficit, which is almost entirely from tourism).
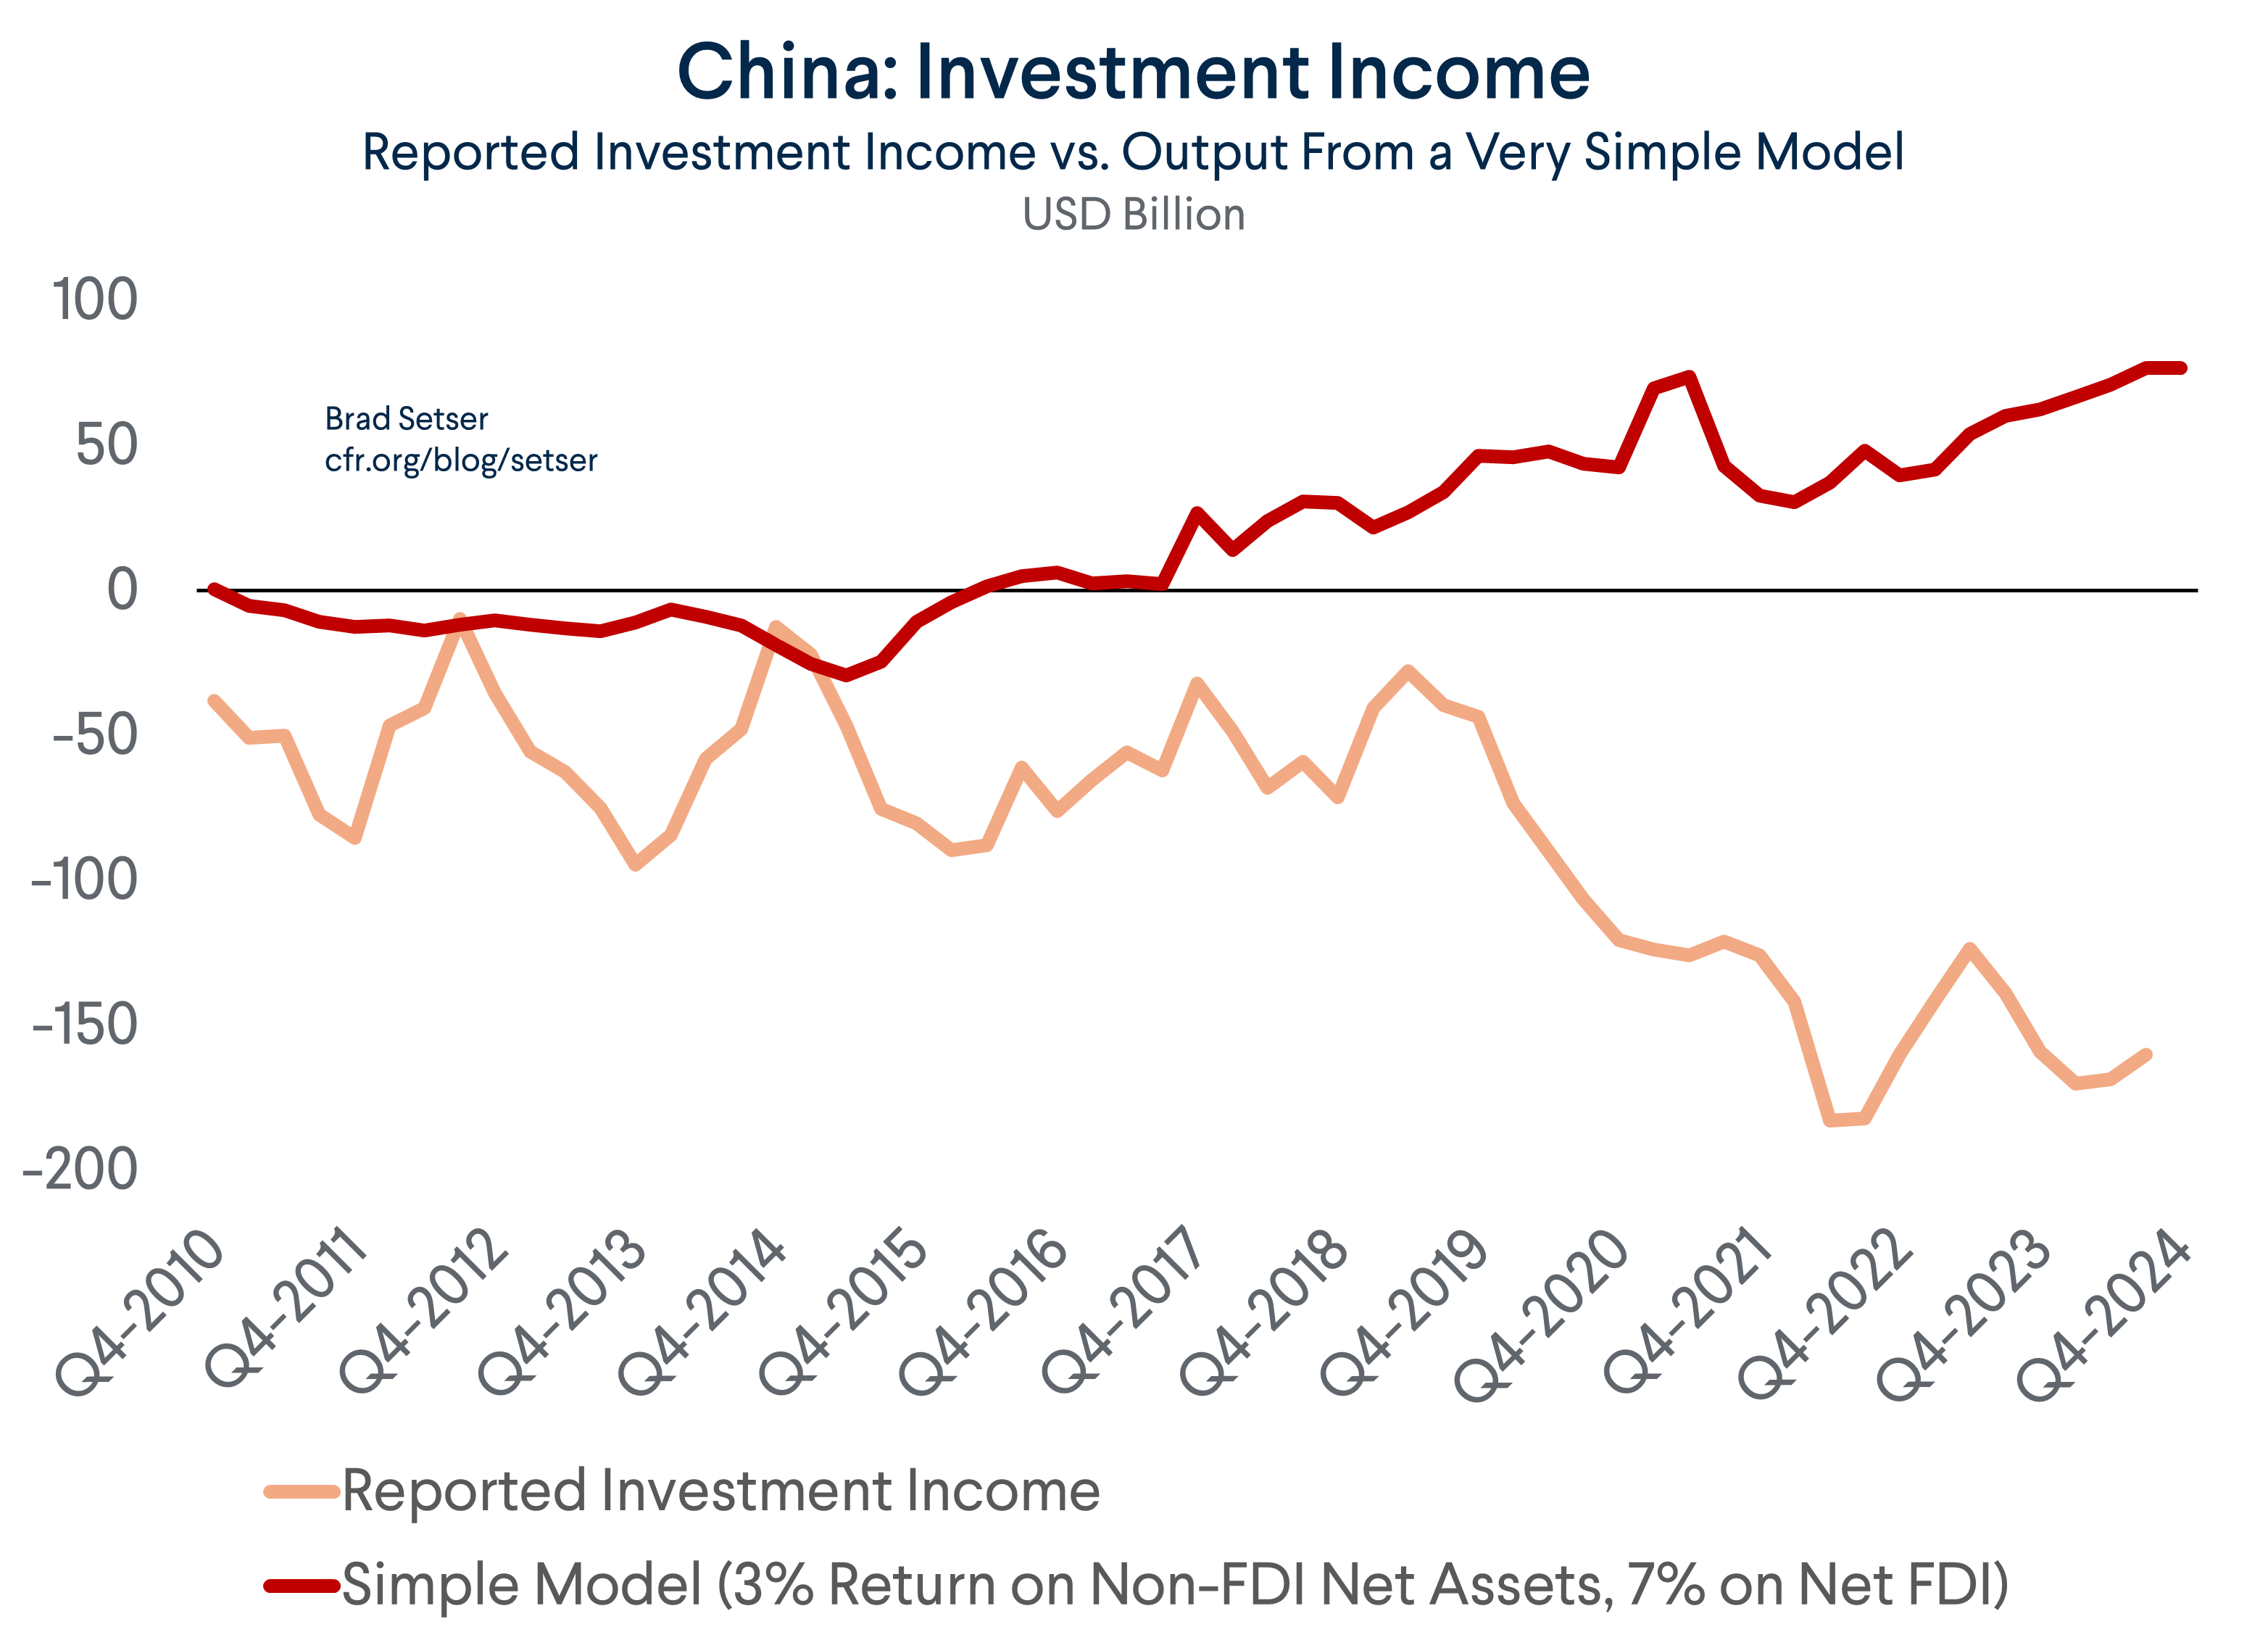
That leaves out the balance on investment income. With $3 trillion more in external assets than external liabilities (according to China’s latest net international investment position data) even the 3 percent lagged return that SAFE reports earning on its reserves from 2010 to 2019 (before “low-for-long” ended) would generate an estimated income surplus of around $100 billion. That falls a bit if the model includes a higher return on FDI assets (and liabilities) than on all assets. But a simple model with a 3 percent return on debt and an 8 percent return on equity would still imply a surplus in the investment income balance.
A more complex model that estimates the likely returns on China’s reported external portfolio, including the interest China earns on the LIBOR-linked loans of its policy banks and the estimated returns on FDI flows would predict an investment income surplus of $40 billion (payments of just under $400 billion, primarily on FDI, and receipts of over $400 billion; far more than the reported $230 billion on $10 trillion in assets).
The improvement in China’s investment income balance since 2020 should not be controversial—most of China’s external assets are still in dollars, and dollar interest rates have increased substantially. Other “surplus” countries have seen the interest income on their foreign assets rise substantially.***
There are thus two reasons why China’s surplus is much smaller than would be expected based on its verified customs surplus, its verified tourism and services deficit, and its accumulated net foreign asset position.
First, China reports a deficit in investment income (yes, a deficit, not a surplus) of over $150 billion—indeed, China’s deficit in investment income has increased since 2019 even though the interest income on a fixed income reserve portfolio and China’s LIBOR-linked policy lending should be up given the evolution of global interest rates.
Second, China’s reported goods surplus in the BoP is now WAY smaller than its reported customs surplus.
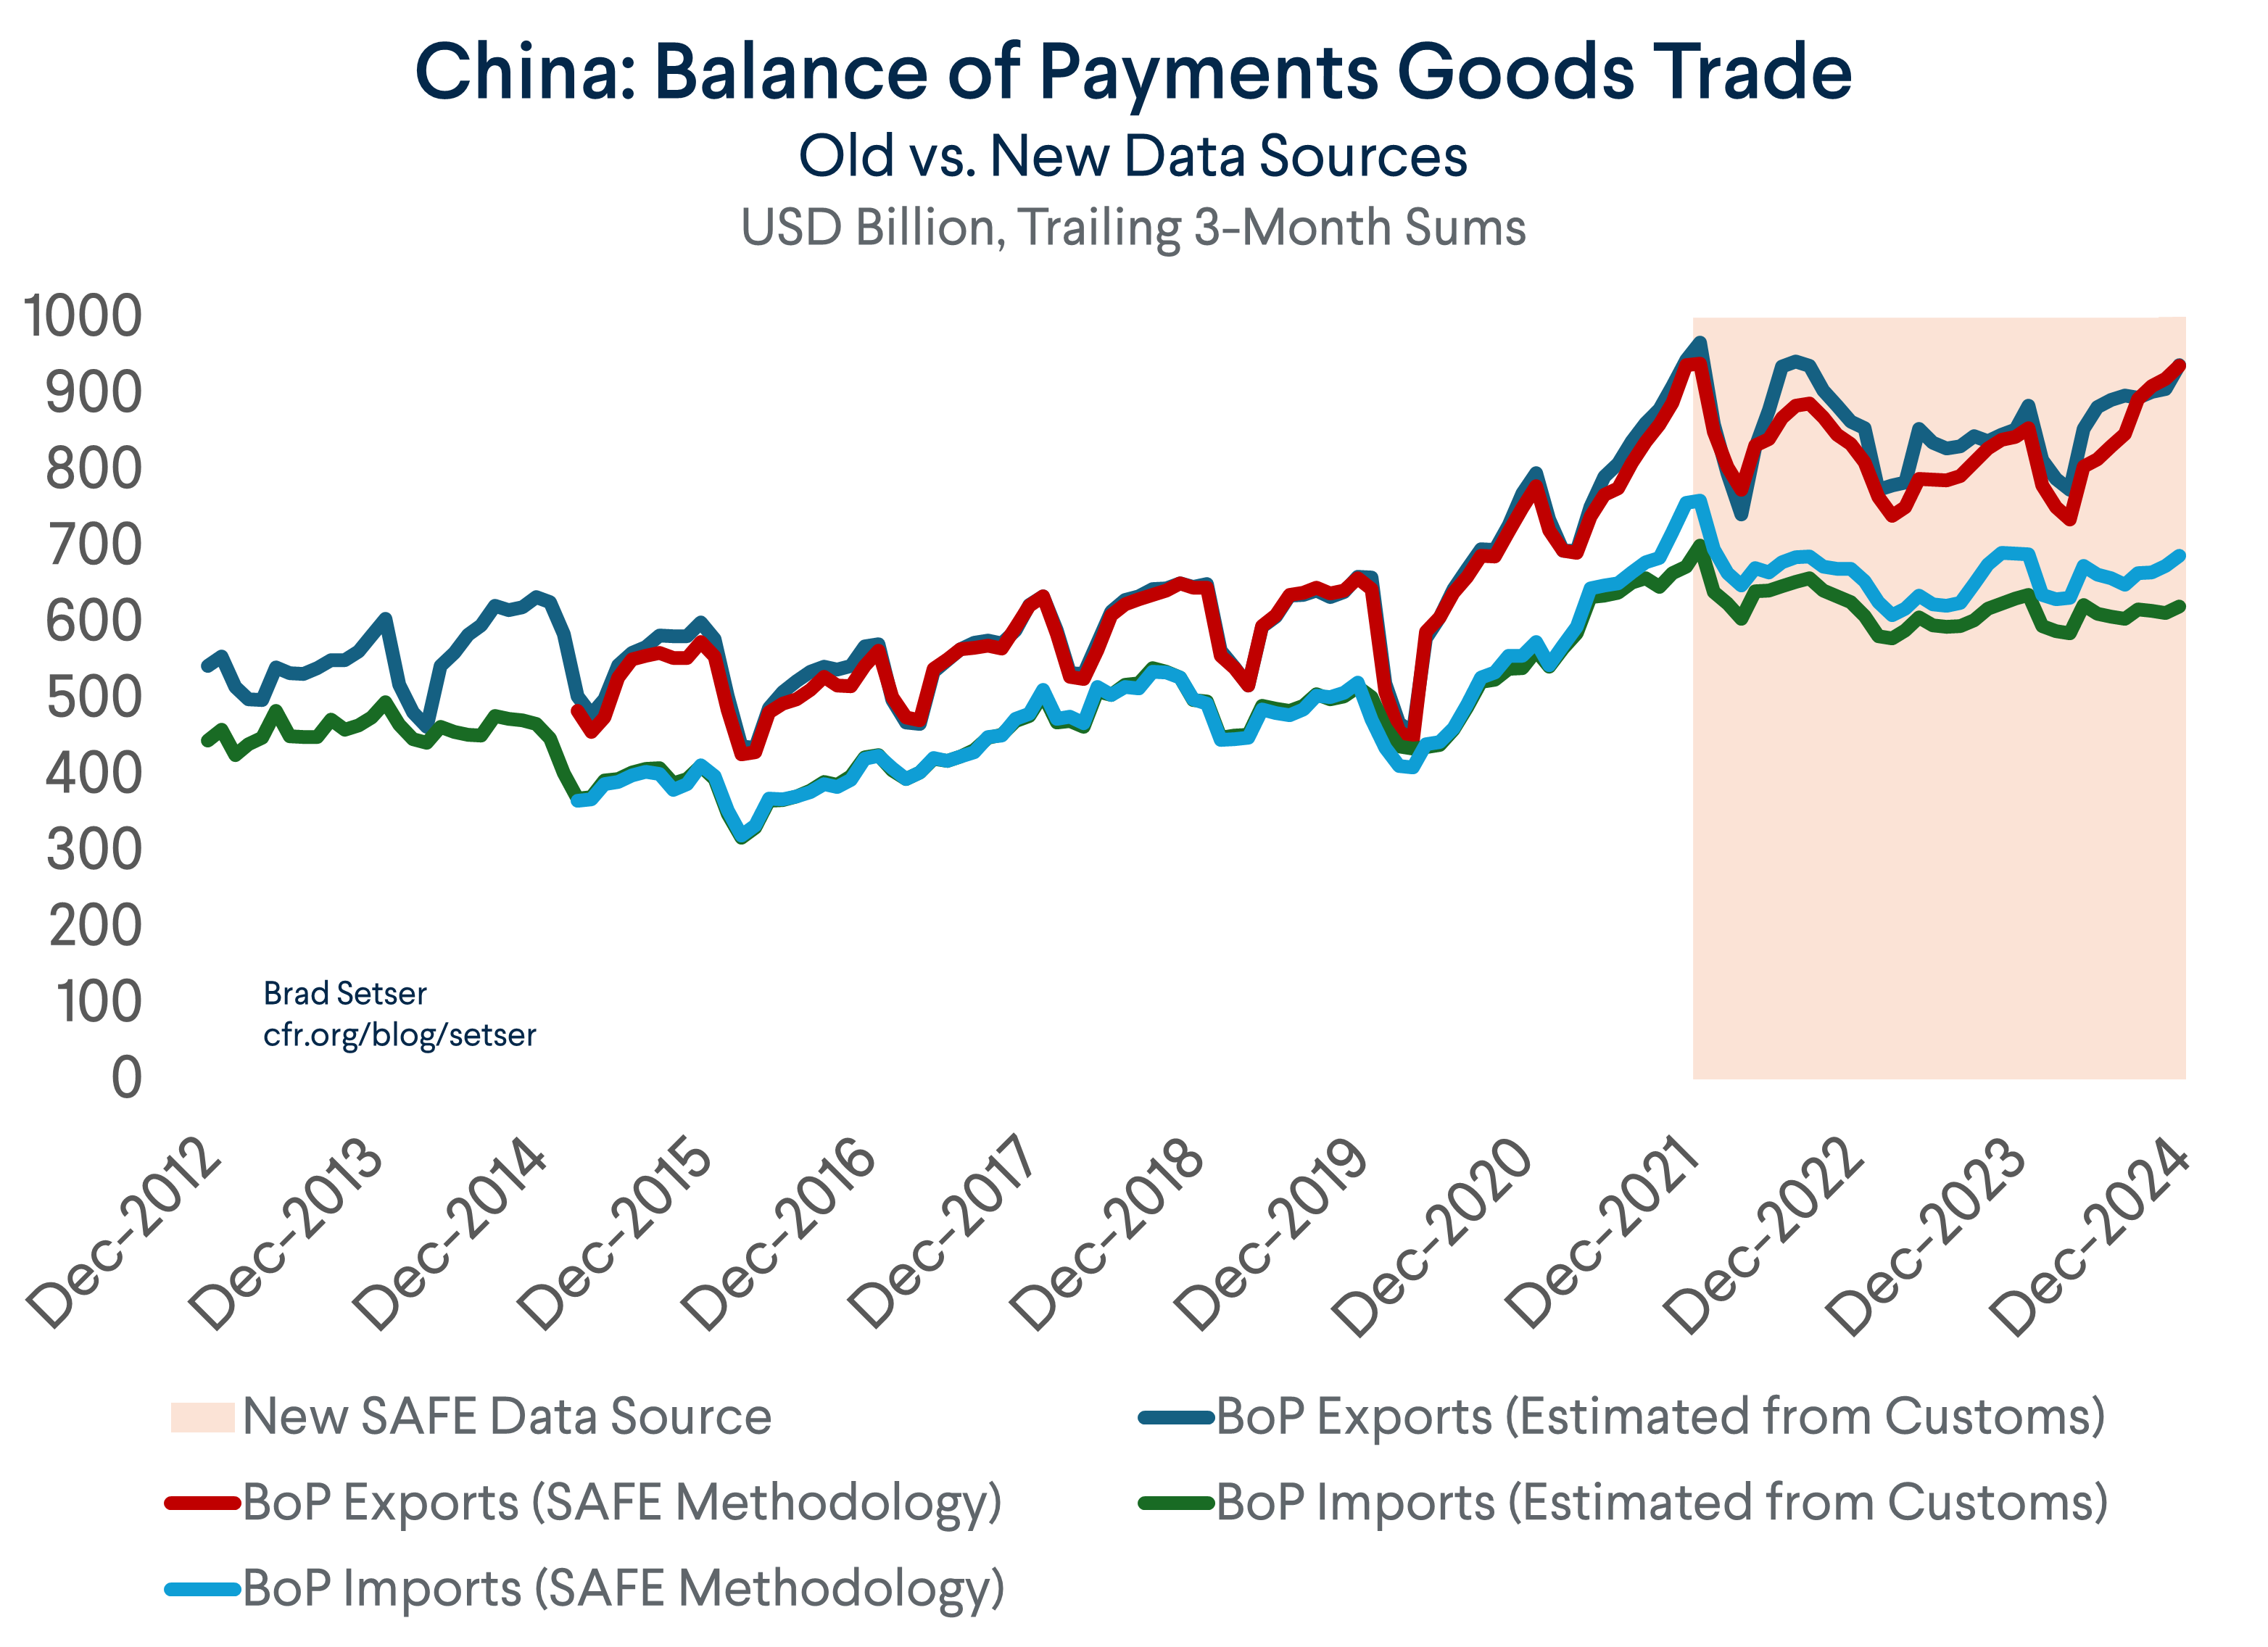
After the pandemic, China adopted a new methodology for estimating its BoP surplus that substantially reduces the surplus reported in the balance of payments relative to the underlying customs surplus (the new methodology was first introduced in calendar 2021 and it had its full impact in the 2022 data).
China’s old methodology for converting its customs surplus into the reported BoP surplus is easy to replicate, so we know that this shift in methodology reduced China’s reported BoP surplus by something like $200 billion (with a bigger reduction relative to the unadjusted customs data).
What happened?
China for a long time didn’t provide much of an explanation for the very visible shift in its numbers. But in its last discussion with the IMF, China relayed that its BoP goods surplus is no longer based on the customs data.
That’s right: China’s reported current account surplus is no longer derived from the customs trade data, which is the one data set that can be independently verified independently.
Instead, China is basing its reported goods surplus on an internal payments data series that no one, the IMF included, has any ability to verify.
China has given two reasons for this shift which, as far as I can tell, the IMF simply took at face value.****
First, the China argues that the onshore profit from firms like Apple—firms which use onshore contract manufacturers, but offshore tax structures—should register in the goods balance rather than the income balance.
Fair enough. Apple arguably does “import” phones made in China to Ireland, then adds a notional markup in Ireland for using Apple’s intellectual property and software, and then exports the phones back to China.*****
But this adjustment should just shift an income deficit (Apple’s profit from its onshore sales in China) over to the goods balance (generating a smaller goods surplus); it shouldn’t change the current account surplus.
And if Apple was using royalty payments for its IP and design to move its profit out of China, those imports would already be in the services deficit. So, if China is doing the “in China for China” adjustment correctly, it should easily be able to point to offsetting changes in either the services or income balance. There should be no impact on the reported current account balance.
Yet the change in methodology clearly has reduced the current account surplus, which is now well below where it should be based on the reported customs data. That suggests that China may not be doing the adjustments correctly, and the fact that China hasn’t provided a detailed accounting of how the new goods methodology changed the calculation of its services and income balance to account for the new “goods” deficit from contract manufacturing in China for sales in China only adds to suspicions that China hasn’t done the adjustment correctly. The IMF really should press the Chinese to show their work, so to speak.
The other adjustment to the goods data is more puzzling, and crucially, does not—I repeat: does not—check out.
China claimed that contract manufacturers producing in China for foreign companies with offshore IP (e.g., Apple) were reporting an inflated exports number in the customs exports data.
Specifically, the number in the customs data was supposedly the global wholesale price for a product like the iPhone, not the actual price that the contract manufacturer received from a firm like Apple.
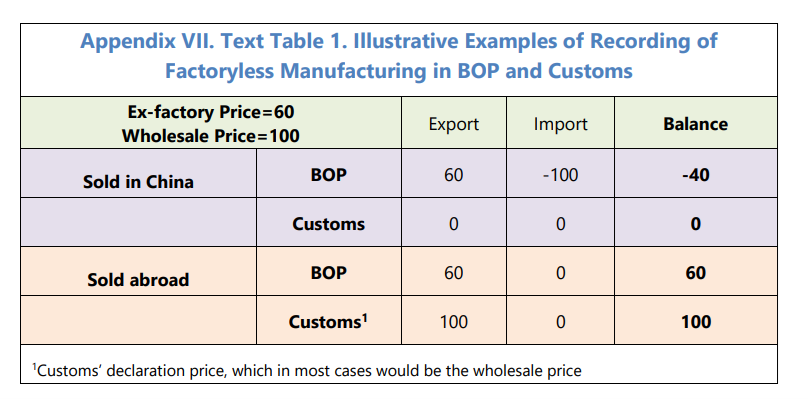
The IMF relayed China’s explanation in the most recent Article IV:
“Exports of goods produced by factoryless manufacturing also result in a lower trade surplus recorded in BOP than in Customs. For example, in cases where the nonresident enterprise sells the goods produced by factoryless manufacturing to a third country, the ex-factory/wholesale price difference make exports recorded in BOP lower than those recorded by Customs as the former is recorded at ex-factory price while the latter is recorded at declaration price, which in most cases would be the wholesale price.” [emphasis added]
But for mobile phones—by far the largest single category of Chinese exports produced onshore by contract manufacturers, China’s story wasn’t in China’s own data.
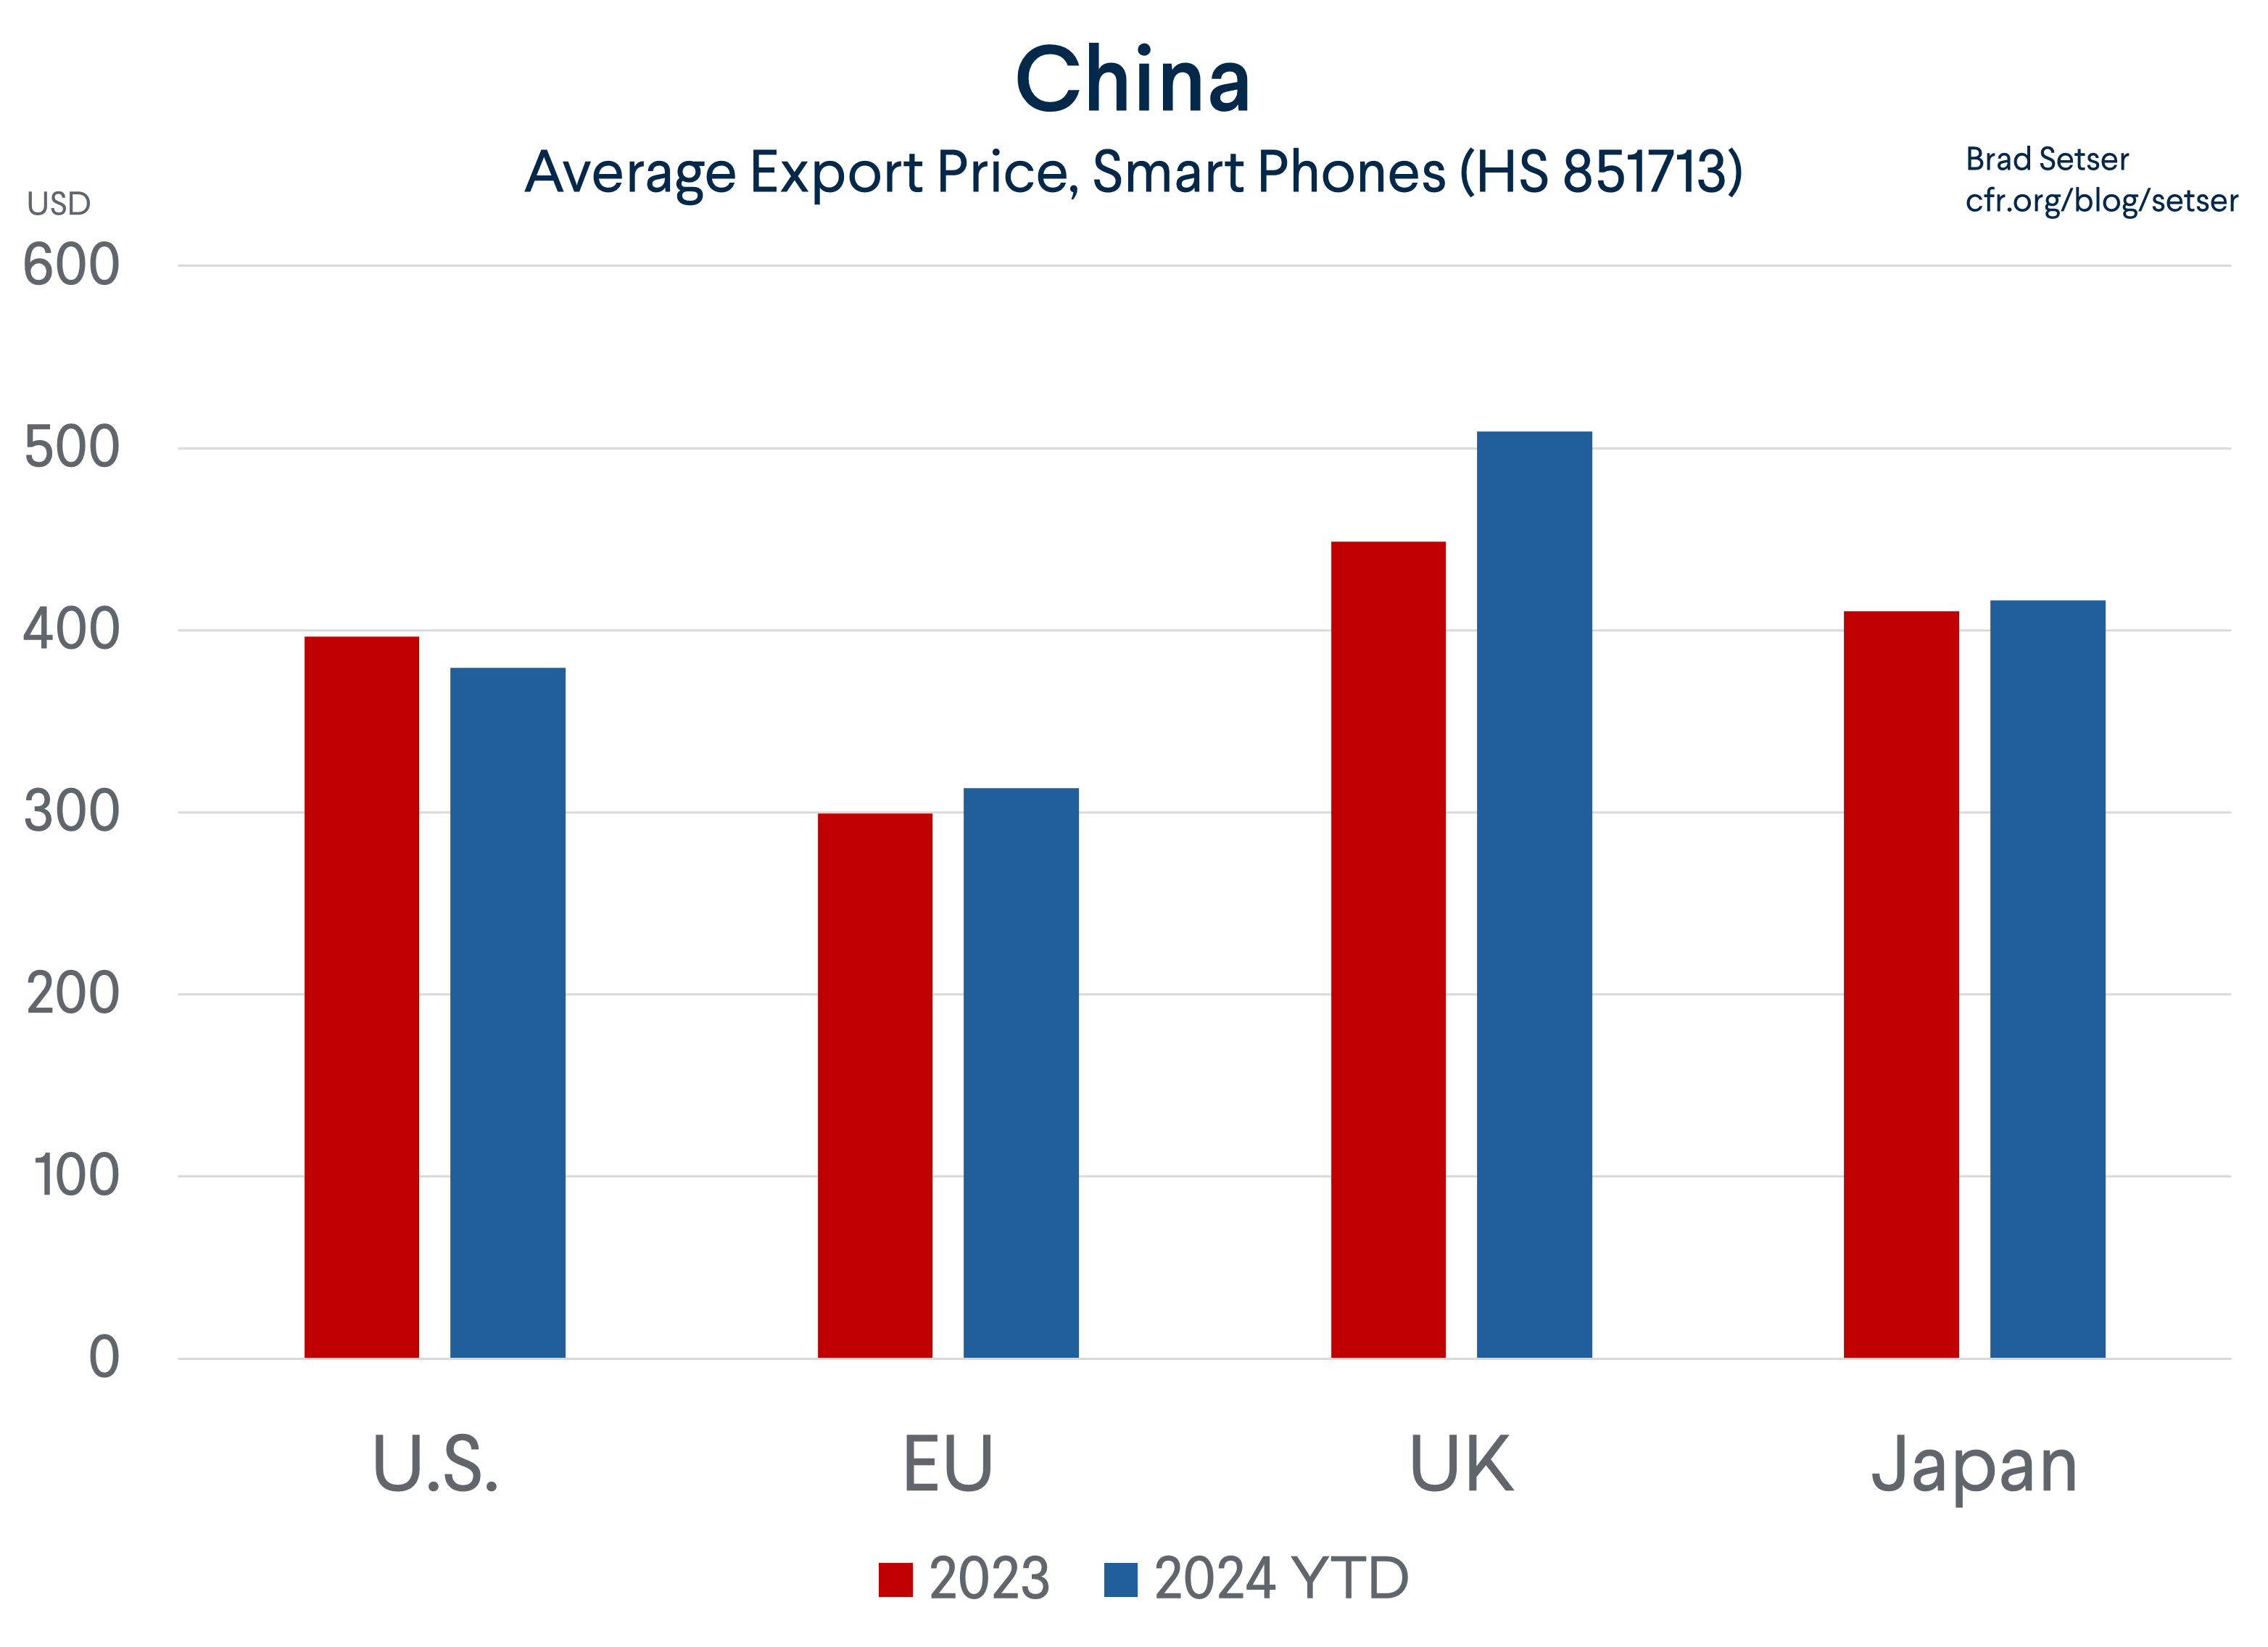
The export price for Chinese-made smart phones (HS 851713) to the U.S., the EU and Japan are all in the range of $300-400 per phone.
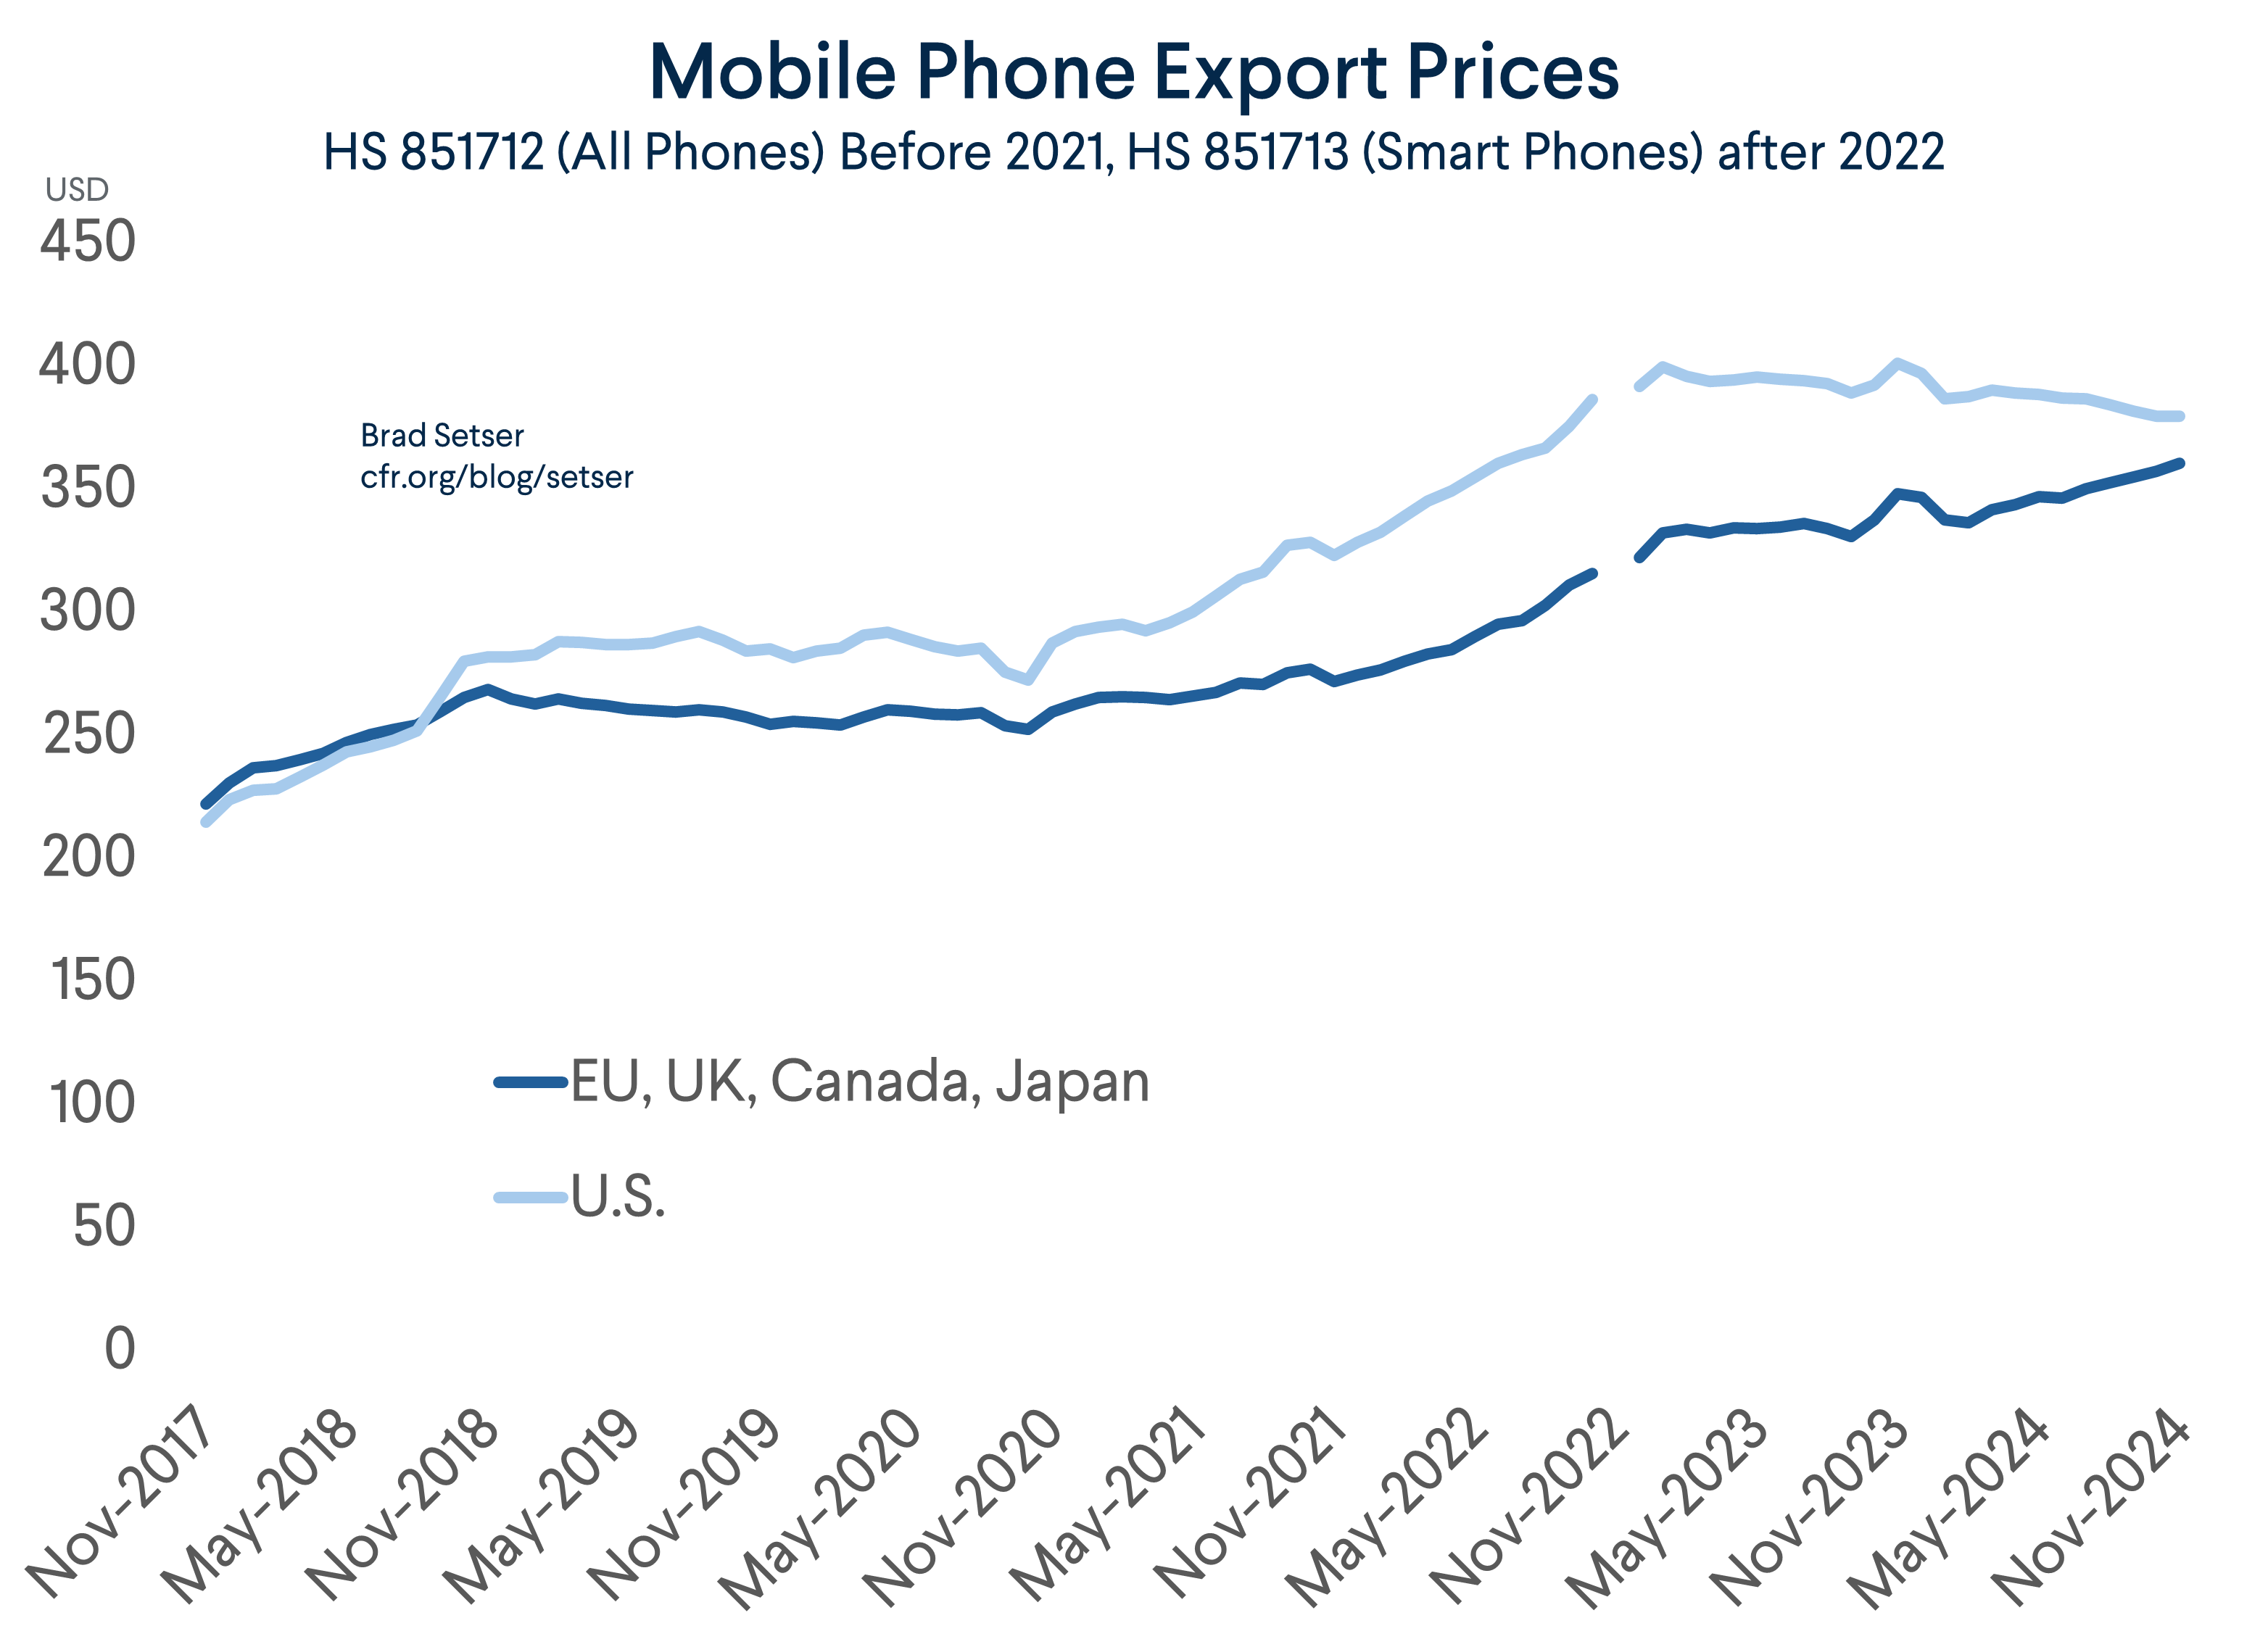
That is what one would expect based on the various knockdown studies that try to estimate the cost of manufacturing an iPhone. A recent report found that iPhone 15s generally cost over $450 to make, and iPhone 14s were generally closer to $400.
We also know from a U.S. International Trade Commission (ITC) report that U.S. smart phone imports from China are almost entirely Apple phones (Samsung exports from Vietnam and Korea, not China).
And $400 is clearly well below the global wholesale or retail price.
The $80 billion in Chinese smart phone exports to advanced economies in the customs data also fits comfortably with Apple’s own disclosed data on its iPhone sales, which are around an estimated $150 billion for the United States, the EU, and Japan. It has been widely reported that Apple’s iPhone line has a significant profit margin, so one would expect that the price paid to the Hon Hai, Wistron, and the other contract manufacturers would be well below total global sales. An actual cost of production of about half the sales price aligns with nearly all estimates.
China hasn’t provided any other examples of sectors where it thinks the export price in customs data is inflated, but it should do so if it wants the IMF and others to take its reported BoP data seriously. Right now, China is reducing exports in the BoP by about $200 billion below the old customs number and by an equal sum to estimates based on China’s pre-2022 BoP methodology.******
Moreover, the customs to balance of payments adjustment, especially on the export side, hasn’t been totally constant over time. It thus has become an independent source of volatility in China’s reported current account surplus. For example, the customs data actually suggests a much bigger Q2 balance of payments surplus that China reported, and no real change between the Q2 and the Q3. The apparent jump in the surplus in Q3 essentially came entirely from unexplained variability in the customs exports to balance of payments exports adjustment. The rise in Q4 relative to Q3 by contrast reflected a real increase in the trade surplus.
Bottom line: China’s story about a big gap between the customs exports number and the right number based on the “transfer of value” principle and actual payments did not check out. At all.
And it didn’t take that much work to see that China’s story wasn’t in the data for the sector that China itself had highlighted in its conversations with the IMF.
Getting the needed data here took a bit of help from friends inside the U.S. government who had access to the relevant six-digit (harmonized trade system) trade data. But the IMF has full access to this data and could have done such a test on its own before uncritically incorporating China’s revised data in its assessments of both China and the global economy.
That gets to the key point.
The details of how China fiddled with its BoP data to reduce its reported surplus (and in the process basically get rid of “errors” in the BoP) are interesting in and of themselves.
But what really matters is the data that goes into the IMF’s assessments of the Chinese economy and the global balance of payments, and for that matter, the U.S. Treasury’s separate assessment of China’s BoP for its foreign currency report.
If the IMF wants to get its policy recommendations to China right, it needs to have a clear view on the size of China’s current account surplus. Is it under $300 billion, as the Chinese reported in the four quarters to the end of Q2? Is it $400 billion, as the Chinese now report for 2024 after a big surge in the reported surplus in the second half of 2024 (the H2 surplus was $300 billion while the H1 surplus was only $100 billion, and the underlying data didn’t swing by that much). Or is it closer to $800 billion, as any analysis based on China’s reported customs surplus and its pre-2022 BoP methodology would imply?
This is all the more important because China’s reported current account data poses a puzzle that the IMF itself identified—the housing correction and big fall in real estate investment *should* have increased the current account surplus (don’t just take my word for it, the IMF made this argument in its latest external sector report).
Yet China’s reported current account surplus has more or less been constant since the start of its real estate correction. That is weird, and if the answer to the puzzle is that China really did offset the fall in real estate investment and associated spending with new directed investment into manufacturing, well, that poses even more questions to the IMF. Notably, what will happen to China’s surplus when that investment inevitably falls back to earth, and all that new capacity is dumped onto the market?
It bears emphasizing that the size of China’s current account surplus should be critical to the IMF’s overall policy advice.
If China’s current account surplus is small and shrinking (as the IMF forecasts in its 2024 staff report) then there is no reason for the IMF’s policy advice to focus on bringing China’s external account into balance, as, well, China’s reported current account surplus isn’t far from what the IMF considers “normal.”
The IMF might still worry that its standard policy advice of fiscal consolidation, monetary easing, and exchange rate flexibility would push China’s external accounts into a surplus that is a bit too big, but that’s less of a concern than it would be if the IMF started from a judgement that China has an excessively large external surplus.
And if the current account surplus is already too big, which I suspect given that an ~$800 billion current account surplus would be around five percent of China’s 2024 GDP, then the IMF’s policy advice needs to be completely rethought. Tightening fiscal policy, cutting the policy rate and letting the exchange rate fall is a recipe for a bigger (not smaller) external surplus in any standard economic model.
So, what seems to be a technical debate over how Hon Hai’s made-in-China smart phones enter the Chinese customs and BoP data turns out to have rather large consequences.
* Logan Wright of Rhodium has done yeoman’s work to lay out an alternative—and more plausible—path for China’s post pandemic output growth. I agree with his bottom-line assessment, though I tend to think that China’s 2024 data understates the contribution from net exports to growth. Real growth might be close to 3 percent, but only because of a 2-percentage point of GDP contribution from net export volumes. Exports are around 20 percent of GDP and China reports 13 percent volume growth; imports are 15 percent of GDP and China reports 2 percent volume growth.
** The main discrepancy now is with the United States, where China now reports more exports than the U.S. records as imports. This gap is relatively recent and isn’t hard to understand. The discrepancy appeared when the U.S. first levied tariffs on China back in 2018. A detailed examination of the data shows that the gap is only apparent for goods on the U.S. tariff lists (in the case of phones, for example, U.S. imports exceed Chinese exports by just a bit). Moreover, the U.S. simply doesn’t count the 1.4 trillion (gulp) in small value packages now shipped directly to the United States, and most of those packages originate in China. At even $60 a pop, these “de minimis” shipments would add around $100 billion to the U.S. trade data.
*** China doesn’t report any detail about its investment income. Zero. All that it reports are total receipts and total payments. This obviously makes verification of China’s own reported numbers difficult.
**** The IMF argues that it isn’t around to police the data reported by its members. That is a bit of a copout given that the IMF has to make judgements about policy based on these numbers.
***** This is actually how Apple registers in Ireland’s BoP data.
****** There is only one sector in which this adjustment has an impact on both reported imports and exports, and that’s phones.