The Midterms Rattled AI Stocks. Here’s What to Watch in the Broader Economy.
Politics, policy, and markets collided this week as AI-exposed stocks faced a selloff after the midterms. There are reasons for cautious optimism despite the volatility, but two questions—how strong the economy is and what is driving the selling—will determine what comes next.

Rebecca Patterson is a globally recognized investor and macroeconomic researcher. She is the cohost of The Spillover, a weekly CFR podcast that examines the ripple effects of global events across policy, geopolitics, economics, finance, and technology.
The connection between politics, policy, financial markets, and the economy has been on full display this week.
On Wednesday, the day after the U.S. midterms, equities rallied on relief that the election results were clear-cut. Even with tallies in the Alaska and Mississippi Senate races still in question, a Democratic majority in both the House and Senate was indisputable. President Donald Trump said he accepted the results. Investors who had positioned for the possibility that results could be contested for days or even weeks, as happened after the 2000 and 2020 presidential elections, unwound “risk premium” positions.
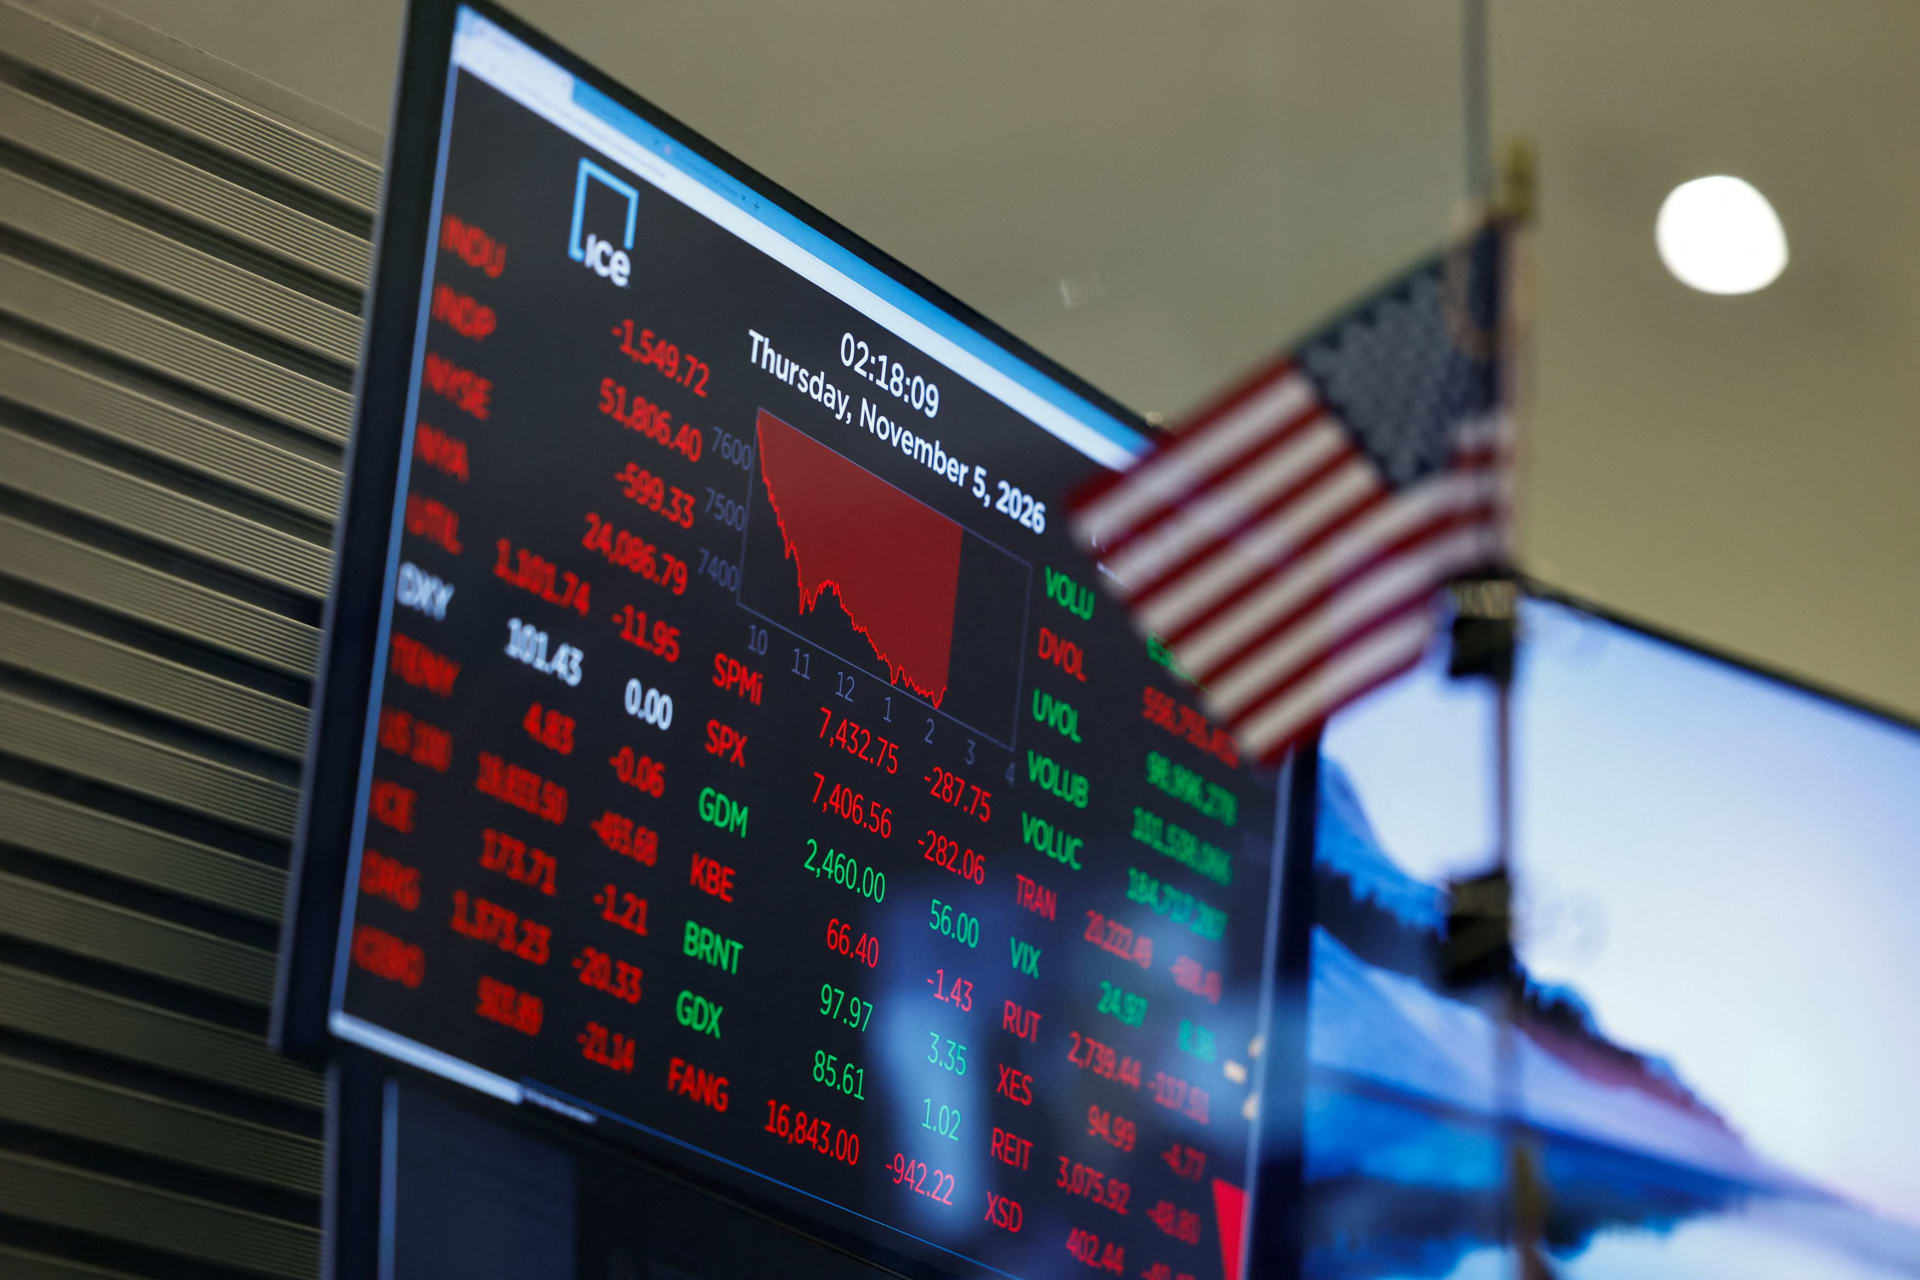
On Thursday, however, as investors digested the implications of the results, equity markets turned sharply lower. In particular, the outlook for companies tied to artificial intelligence (AI) was thrown into doubt, given a wave of local ballot measures across ten states—nearly all of which backed data center restrictions—and the success of Democratic candidates who campaigned against data center expansion.
As a result, the S&P 500 fell 4.36 percent, the biggest one-day decline since just after April 2025’s Liberation Day tariff announcements. The tech-focused Nasdaq index, meanwhile, fell 5.52 percent on the day—similar to single-day declines seen in April last year and March 2020. Stocks rebounded somewhat on Friday: The S&P 500 rose 1 percent and the Nasdaq jumped 2 percent when trading opened in New York.
This U.S. equity volatility has quickly spread to other asset classes and markets around the world, a reminder of the interlinked nature of both the global financial system and the global supply chains that underpin AI.
Perhaps unsurprisingly, these gyrations are fueling worries that the so-called AI bubble could soon pop. This narrative suggests that the midterm results will lead to policy shifts that slow the buildout of critical AI infrastructure, placing more guardrails around the firms creating the most popular AI models. Investors would need to reset their expectations for both the timing and scale of the revenue that the AI buildout could ultimately generate.
AI-related companies dominate the U.S. equity market (and several overseas markets). As of the end of October, eight of the largest AI-exposed firms in the S&P 500 index—Apple, Nvidia, Microsoft, Alphabet, Amazon, Meta, Tesla, and Broadcom—together represented more than one-third of the index’s total market capitalization. So where AI goes, the equity market tends to follow.
Given the reliance on AI for broader economic growth in recent years, both through equity-generated consumer wealth and through AI-related construction and infrastructure, a slowdown could weigh on economic activity, even leading to a more moderate path ahead for Federal Reserve rate hikes. As of early Friday, shortly before the payroll release, the futures market had reduced the rate hikes priced in through June 2027 by fifteen basis points.
Of course, financial markets have been reacting to more than just potential policy shifts around AI. For instance, the expectation that a Democratic Congress could push to end the Iran war appeared to be an important factor in the market reactions in Wednesday’s rally. Crude oil prices fell sharply, with Brent down nearly 9 percent, likely also influencing expectations for the Federal Reserve.
Still, AI speculation dominates, given its outsized role in driving both global financial markets and economic prospects.
So where does this go from here? While it is impossible to know when or at what market index level inflection points will occur, there are at least two fundamental questions worth asking.
How strong is the underlying economy? If individuals have jobs and incomes and keep consuming, companies will get revenue, which supports their equities. While the monthly nonfarm payroll report is watched closely, it can be volatile and subject to revision month to month. (October payrolls were significantly stronger than expected, with large, positive revisions to recent months.) Perhaps more telling are continuing jobless claims—the number of people out of work and receiving unemployment benefits. Continuing claims have declined by 9.6 percent so far in 2026 and are historically low. That is good news for consumption and, in turn, corporate earnings.
If equities continued to decline and created a negative wealth effect for investors, and they slowed their spending as a result, firms getting less revenue might start cutting expenses, including jobs. The underlying economy’s fundamentals could then deteriorate. Weekly jobless claims data, released every Thursday, will merit monitoring in the coming months.
The second question: Is equity selling more fundamental or technical? Equity investors usually have both in mind when they exit or enter positions. However, the balance of these motives matters. If investors are being forced to sell—for instance, to meet margin calls from leveraged exchange-traded funds (ETFs)—that technical selling is temporary, usually lasting days or weeks but not longer. This incremental pressure on the market eventually ends.
To take one example from this week, consider the Direxion Daily Semiconductor Bull 3X ETF, which delivers three times the return of the New York Stock Exchange Semiconductor Index. According to Bloomberg data, it fell more than 37 percent just on Thursday. Many investors in such products were likely forced out of positions as they got margin calls, creating a wave of selling in the process.
Selling on shifts in expectations for the economy and companies happens regularly. Looking at the peak-to-trough selloffs in the S&P 500 index for each calendar year since 2000, the average annual maximum drawdown has been −15.7 percent. Put another way, Thursday’s selloff, while certainly attention-grabbing, still leaves the index only 6.25 percent below its recent record high. Despite those past drawdowns since 2000, the S&P 500 still ended the year with positive returns 70 percent of the time. When the year overall was negative, the economy was entering or nearing a recession the vast majority of the time.
It is too early to know if a potential policy shift following the midterm election will prove the catalyst for sustained equity selling and slower economic growth. A solid labor market and historical patterns in which both a reset in fundamental expectations and technical selling are short-lived offer at least two reasons for cautious optimism.
More important, the week’s market volatility is a stark reminder that politicians and policymakers should watch financial markets and economic trends, and that investors should watch politics and policy. They are all interconnected.
This work represents the views solely of the author(s). The Council on Foreign Relations is an independent, nonpartisan membership organization, think tank, and publisher, and takes no institutional positions on matters of policy.