Why Roll Yield Matters to Oil Benchmark Preferences
By experts and staff
- Published
By
- Blake ClaytonAdjunct Fellow for Energy
In my last post I discussed how trading volumes show a migration into ICE Brent from NYMEX West Texas Intermediate (WTI), two of the world’s most watched crude oil benchmarks. The trend is part of Brent’s broader rise as the preeminent world price of oil. Here I’d like to show graphically part of the reason why some financial market participants are opting to trade the North Sea crude instead of its American cousin. It has to do with recent trends in the futures prices for both crudes.
Figure 1 shows the forward curves—i.e., a series of sequential prices for future delivery— for NYMEX WTI and ICE Brent crude oil. Prices for Brent, in red, stretch out to 2019, whereas WTI, in green, go through 2021. I noted in my last post the remarkable divergence between front-month contracts for Brent and WTI, a significant shift from the historical norm of WTI’s slight premium. Note in Figure 1 the difference in the shape of the two curves for near-dated contracts. WTI contracts through August 2013 were in a state of contango, with prices rising into the future. For backwardated Brent, on the other hand, prices are progressively declining over the entire curve.
Figure 1. Forward curves for NYMEX WTI and ICE Brent as of Jan. 24
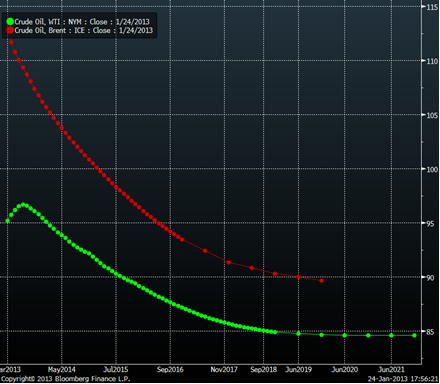
Source: Bloomberg
This difference in structure may seem arcane, but it has proven an important driver of the shift among some financial market participants into Brent contracts at the expense of WTI. Commodity index investors, for example, are interested in reaping roll yield, or the normalized difference between a nearby and a deferred futures contract, since they roll their exposure as futures contracts approach expiration. This type of yield is one of the primary sources of long-term returns for commodity index investors. As Figure 1 shows, though, the Brent curve offers a positive roll yield for contracts at the front of the curve—in contrast to WTI, where that yield would be negative, all else equal. That differential, which tilts the balances toward the North Sea benchmark insofar as the roll-related return potential, has been one factor pushing trading volumes in its direction.
Figure 2 shows this differential in another way. It depicts the price spread between futures contracts for the two crudes one and six months in the future since 2000. The close correlation between the spreads for the two markers were tightly positive up until around 2010, when the glut of light-sweet crude in the U.S. midcontinent sent WTI into a prolonged state of contango, whereas Brent’s structure reflects relative physical tightness in the underlying North Sea streams.
Figure 2. 1 - 6 month price spread for NYMEX WTI and ICE Brent (2000-2013)
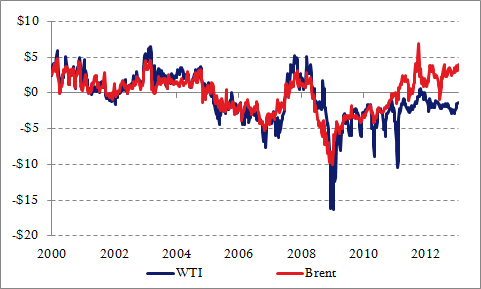
Source: Bloomberg
Because the market expects Cushing’s supply woes to begin to be amerliorated later this year, the result of additional pipeline capacity draining excess crude inventories, WTI’s contangoed structure extends out only through September as of yesterday’s market close. After that delivery date, as Figure 1 suggests, the slopes the two curves come closer into alignment, minimizing Brent’s roll yield advantage over the American benchmark. As Figure 3 makes plain, though, near-dated contracts for the crudes are traded much more heavily than those further out along the forward curve. The differential in the term structure of the two crudes, though by market expectations impermanent, appears sufficient over the most heavily traded contract months to have helped incline some commodity traders toward Brent over WTI.
Figure 3. NYMEX WTI 20-day average trading volume over the length of the curve as of Jan. 24
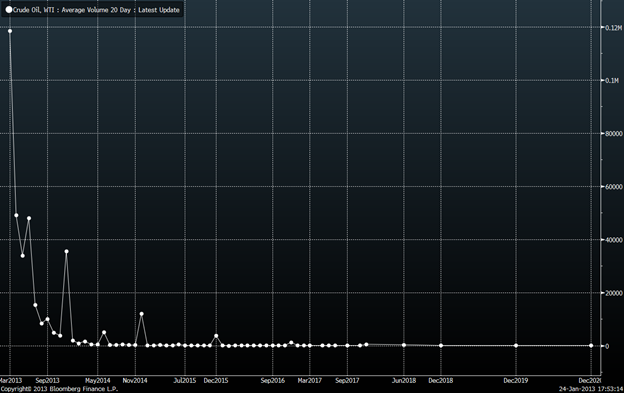
Source: Bloomberg