Expert TakeTrump’s Iran Deal Has Collapsed, Leaving the U.S. With Few Good OptionsJuly 13, 2026By Max Boot
Expert TakeThe Strait of Hormuz Already Faces a Tough Recovery. Now Trump’s Iran Deal Is Unraveling.July 8, 2026By Edward Fishman, Clara Gillispie, Elisa Ewers, Max Boot and Sam Vigersky
Expert TakeA Year Later, Trump’s Big Beautiful Bill Act Has a Clean Tech Silver LiningJuly 3, 2026By David M. Hart
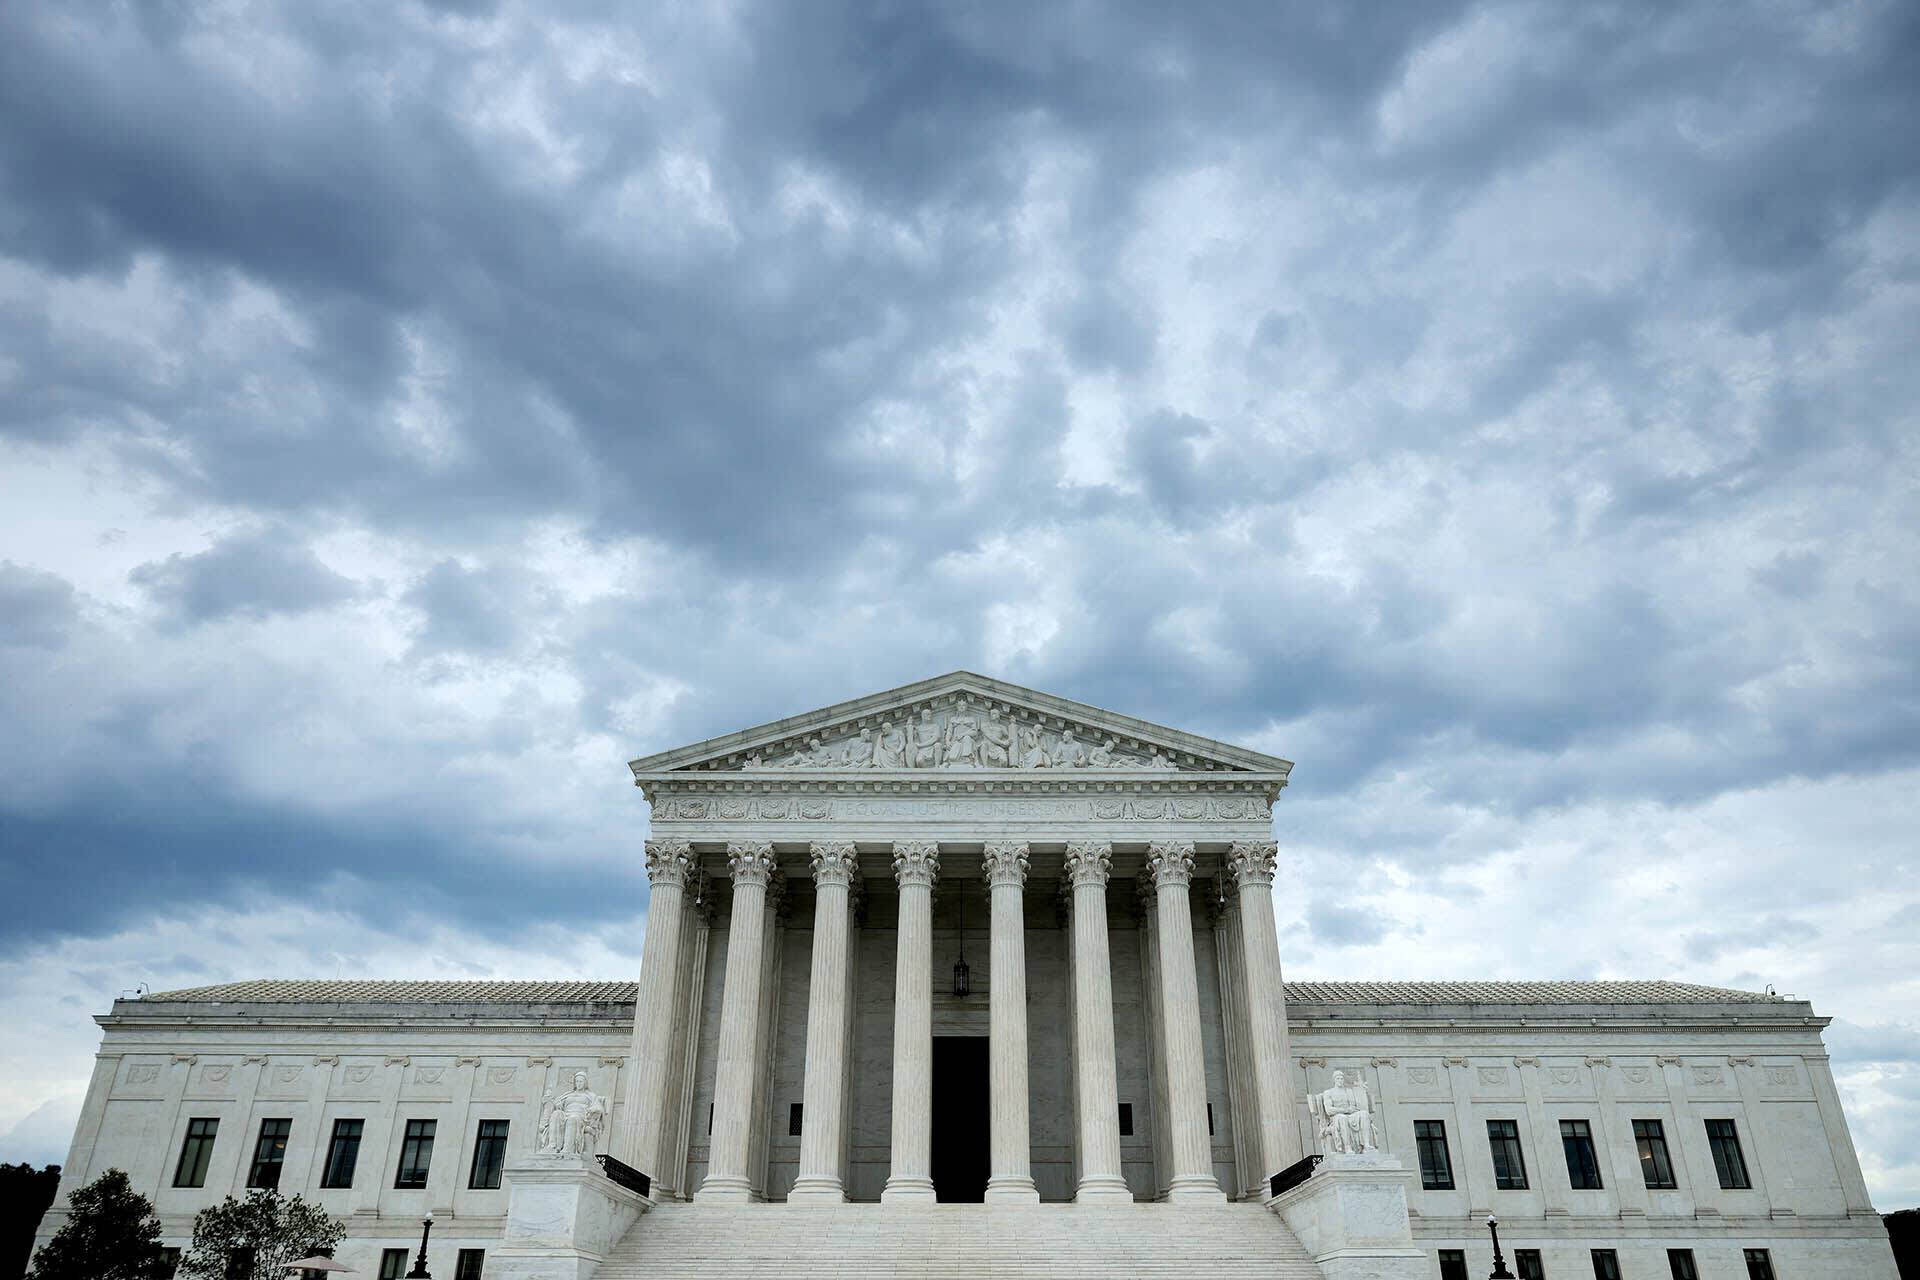
Expert TakeThe Supreme Court’s Cisco Ruling Clears the Way for U.S. Tech to Aid Repression AbroadJune 30, 2026By David J. Scheffer
Expert TakeWhy Anthropic Is Sounding the Alarm on the Next Generation of AIJune 18, 2026By Gordon M. Goldstein
FIFA Promised a World Cup Economic Boom, But U.S. Stands May Be Emptier Than UsualJune 11, 2026By Mariel Ferragamo
 Expert TakeExpert Take
 51:39Podcast
 Expert Take
 38:39Podcast
 Expert Take
 Expert Take
 Expert Take
 Expert Take
 Expert Take
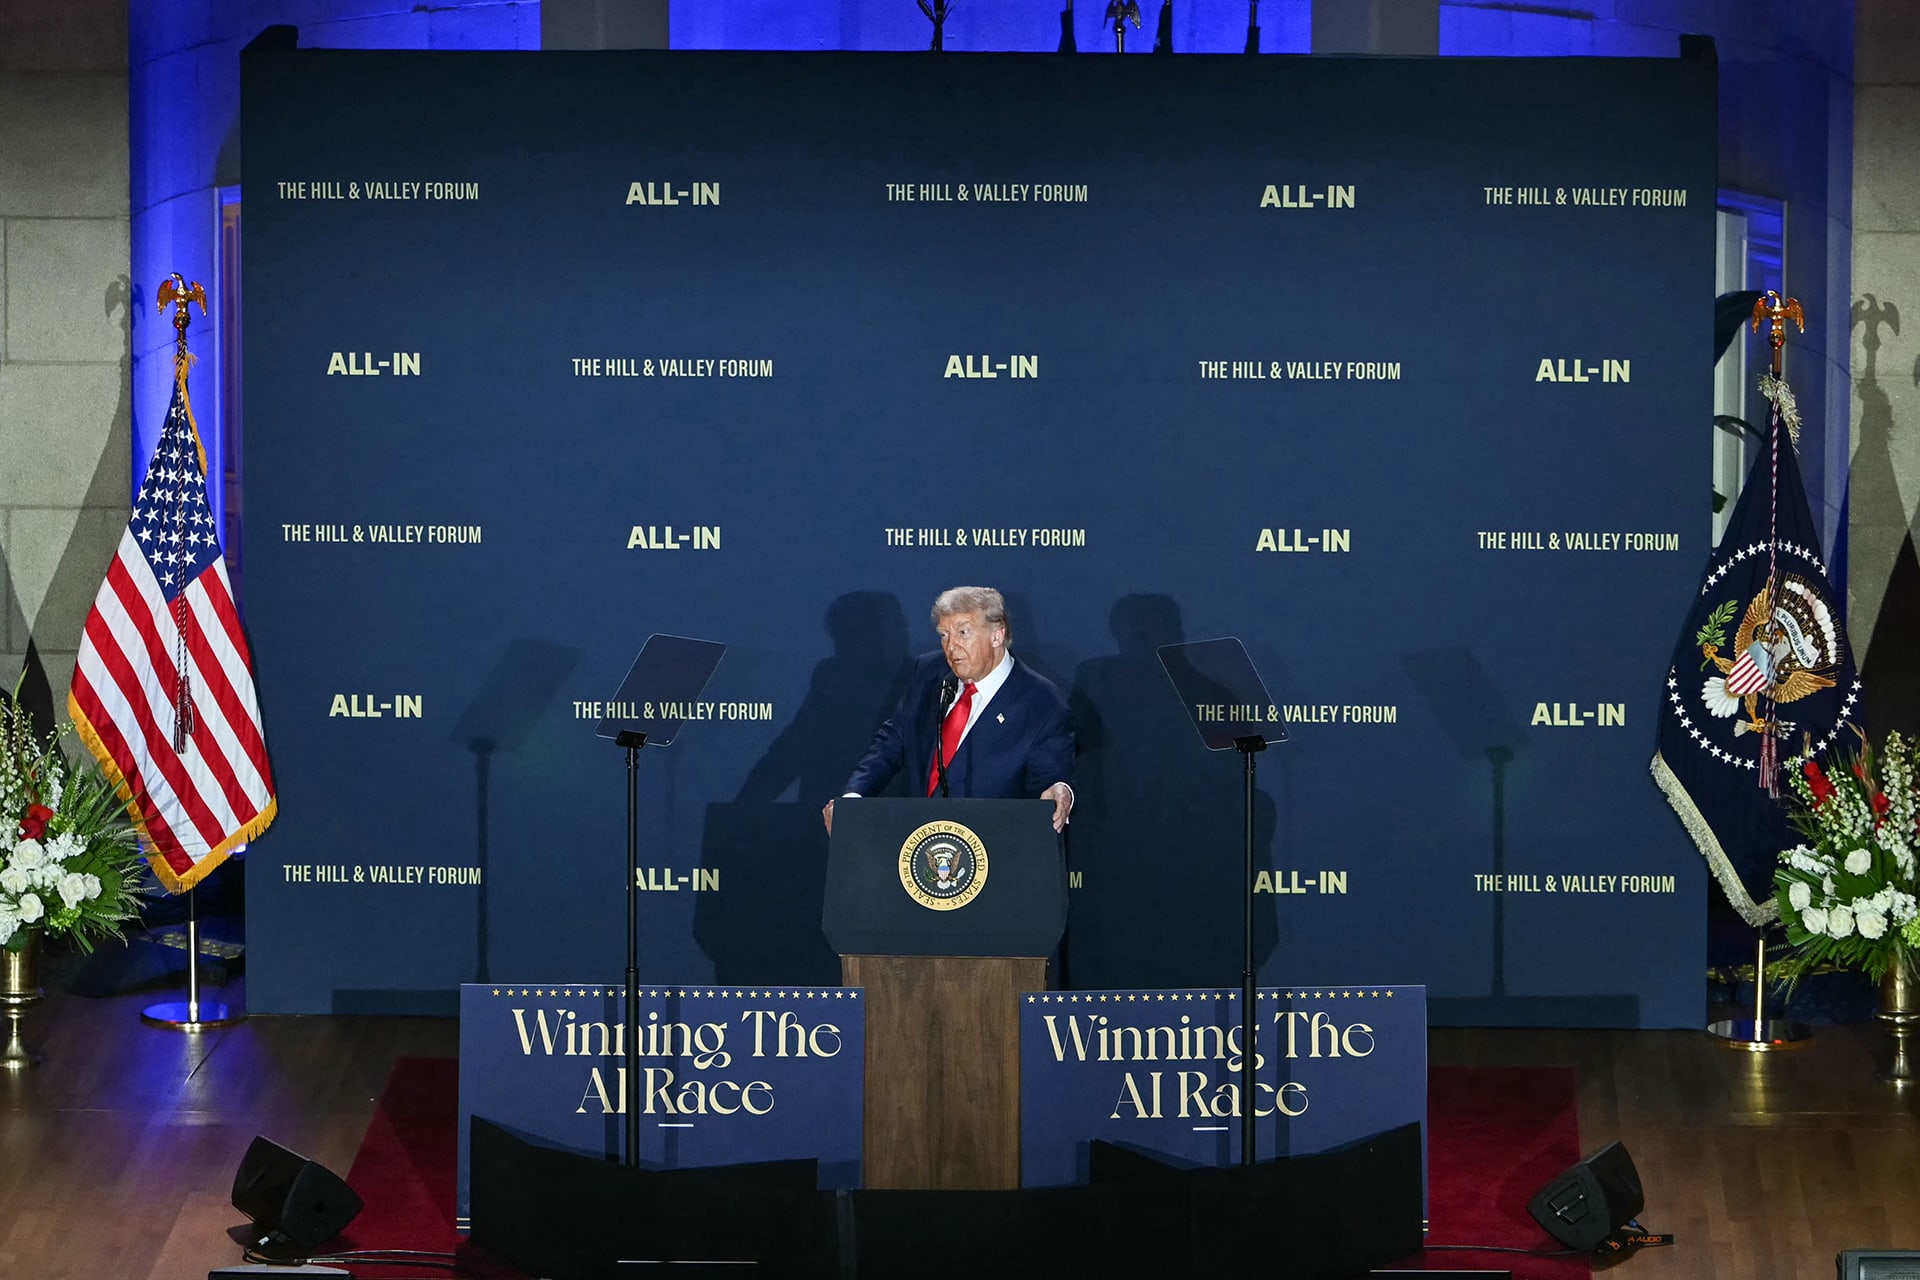 Expert Take
 Expert Take
 Expert Take
 Expert Take
 Meeting
 Meeting