Budget Deal Oil-for-Renewables Trade Would Substantially Reduce Carbon Emissions


This post is coauthored by Varun Sivaram and Michael Levi.
Congress is set to vote on a budget deal that would permanently end the long-standing ban on crude oil exports in exchange for temporary extensions of tax credits that support solar and wind energy. Michael wrote on Tuesday about the market, climate, and geopolitical impact of lifting the oil export ban. In this post we’re going to estimate the climate impact of the renewables tax credit extensions. We focus on 2016-2020 for three reasons: (a) it’s the period for which we have the best data; (b) beyond 2020, complex interactions with the Clean Power Plan make things much tougher to model; and (c) most important, beyond 2020, the primary effect of the ITC/PTC extension should be to make reducing emissions cheaper, and thus enable stronger policy, something that can’t be quantitatively modeled.
Our bottom line: Extension of the tax credits will do far more to reduce carbon dioxide emissions over the next five years than lifting the export ban will do to increase them. While this post offers no judgement of the budget deal as a whole, the deal, if passed, looks like a win for climate.
What the Budget Deal Includes
The tax credit extensions would be a big deal for the renewable energy industry.
The solar investment tax credit (ITC) is especially lucrative—new solar installations that begin operating before 2020 will continue to receive a tax credit equal to 30 percent of their system cost. The ITC steps down to 10 percent by the end of 2021, but projects that commence construction in 2020 and 2021 are still eligible for 26 and 22 percent tax credits, respectively. Given that solar industry leaders like SolarCity and First Solar have tailored their business models to withstand the impending ITC cliff (without this deal, the ITC would plunge down to 10 percent for any project completed after 2016), the six-year extension/phasedown is an unexpected Christmas present.
The revival of the currently expired PTC is also a welcome development for the wind industry. The PTC—which compensates wind generators for ten years after they begin operating for the power they produce—would return to its full value of 2.3 cents per kilowatt-hour (kWh) for any project under construction by the end of 2016. The proposed budget bill articulates a five-year phase-out (1.84 cents/kWh for projects commencing construction in 2017, 1.38 cents/kWh in 2018, 0.92 cents/kWh in 2019, and nothing thereafter) that gives the industry visibility into the future. This is important because over the last decade, the wind industry has been plagued by boom and bust cycles driven by uncertainty over the future of the PTC. Even though the PTC would phase out faster than the ITC, then, the wind industry arguably needs policy stability as much as policy support. That should make the PTC deal a welcome development for the wind industry.
Impact of the Budget Deal on Wind and Solar Deployment
The first step toward estimating climate benefits is to project the effect of the new tax credit policies on renewable energy adoption.
GTM Research published a helpful research note projecting solar adoption through 2020 with and without the proposed ITC extension. The contrast is stark—whereas installed solar capacity was set to peak in 2016 and then plunge over a cliff as the ITC expired, under the budget proposal there is a smaller pause in solar deployment in 2017 as the glut of projects in the current pipeline get built. From 2017 onward, all three industry segments—residential, commercial, and utility-scale solar—grow faster than without the ITC extension. This leads to around 25 gigawatts (GW) of additional capacity under the budget proposal by 2020.
To estimate the impact of the PTC extension, we used analysis released this week by Bloomberg New Energy Finance comparing wind deployment under the proposed PTC phase-out to deployment without any PTC support at all for the next five years. Again, there is a stark contrast between the two projections. Without the extension, wind deployment is projected to peak in 2016, as developers rush to take advantage of the Internal Revenue Service’s determination that projects operational before 2017 will be eligible for the full 2.3 cent/kWh PTC that expired in 2014. Now, under the budget proposal, the steep cliff in capacity coming online in 2017 is replaced by a gentle hill and then a flurry of new construction to take advantage of the PTC extension. By 2020, around 19 GW of incremental wind capacity is projected to come online because of the budget proposal.
The resulting projections are displayed in Figure 1. The two panels at left show the cumulative installed capacity of solar and wind in a world without tax credits and under the budget proposal. The middle panel plots the annual capacity that is incremental to the budget proposal—that is, all new solar and wind excluding projects that would be built anyway without the budget proposal. The rightmost panel shows the cumulative capacity additions due to the new policy.
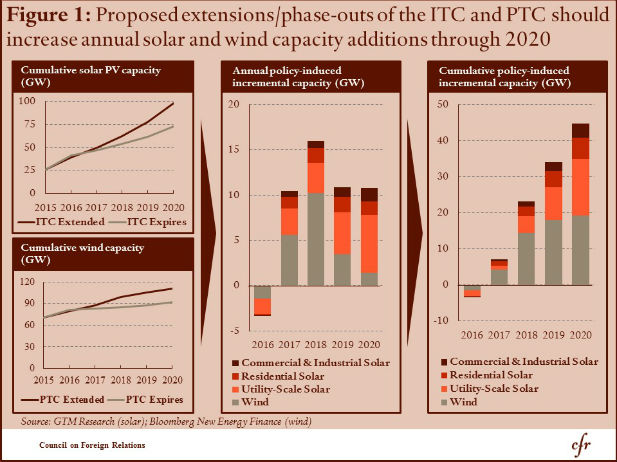
Two trends are important to note. Both incremental solar and wind deployment are actually negative in 2016, reflecting the forecast that under an extended ITC and PTC, there would no longer be a mad rush to build projects before a 2016 cliff. However, solar and wind deployment trends diverge in later years. Through 2020 incremental solar construction accelerates as solar becomes cheaper while the tax credit remains at 30 percent. But incremental wind deployment peaks in 2017–2018, because developers that begin construction on projects in 2016 will be eligible for the full value of the PTC (even if the projects are only operational in subsequent years). Then as the PTC phases out to zero in 2020, additional wind capacity spurred by the budget deal will decline, so by 2020 the additions under the budget proposal are roughly similar to the additions without any tax credit extensions.
Emissions Impact
We can use these projections of incremental capacity additions to estimate the climate benefits of the new renewable energy. We conservatively focus on the 2016–2020 period before Clean Power Plan incentives kick in fully; this means that we’re going to underestimate the climate benefits of the ITC/PTC extension.
Figure 2 details the assumptions in this calculation. First, we assume that new solar and wind will on average displace a mix of fossil-fuels—coal and natural gas—as well as nuclear power in some cases. (All other sources have zero marginal cost and therefore won’t be displaced.) Nuclear power will be displaced in big chunks (if it is displaced at all), corresponding to retirements of entire plants, because as a baseload, low marginal cost resource, nuclear plants either run at near-full capacity or not at all (and some argue that zero-marginal cost renewable energy like wind and solar can make a nuclear plant’s operation unprofitable enough that it may have to shut down). To be safe, we investigated a range of values of the carbon intensity—or the emissions per unit power—of the electricity sources that solar and wind displace. At the low end, we considered the emissions intensity of a mix of nuclear, coal, and gas, weighted by their generation. And at the high end, we assumed that no nuclear reactors close because of renewable energy and instead stipulated that renewable energy displaces a mix of coal and natural gas, again weighted by generation.
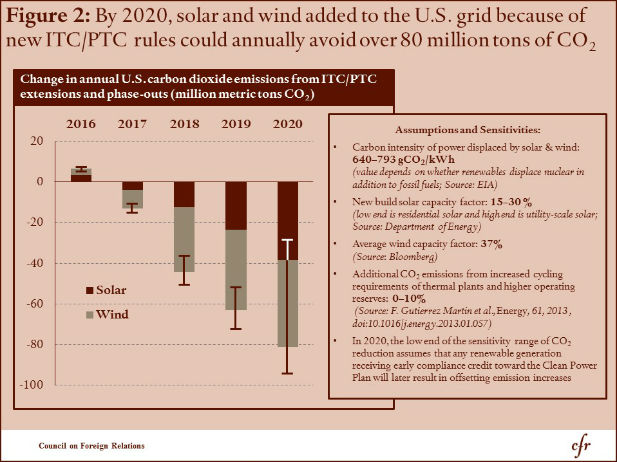
Second, we assume that since the solar and wind plants that will be incentivized by the tax credit extensions will be new projects, they will have high capacity factors—that is, they will be relatively efficient at generating power compared with older counterparts. New utility-scale solar plants now boast capacity factors of 30 percent. New residential solar installations deliver half that. New wind plants perform at a capacity factor of around 37 percent.
Third, to be conservative, we consider an effect of up to 10 percent additional emissions from integrating renewable energy into the grid. Because renewable energy is intermittent—that is, solar and wind only produce when the sun shines and the wind blows—the rest of the power plant fleet must compensate for this added unpredictability. This leads to natural gas plants changing their power output rapidly, which reduces their efficiency and requires them to emit more CO2 per unit of generated electricity. Moreover, more power plants may have to be kept running on standby as “reserve margin” to compensate for any unanticipated shortage of renewable energy.
Our final assumption deals with an early compliance mechanism for the Clean Power Plan, the Clean Energy Incentive Program, which kicks in from 2020 onward. Under the proposed program, which has not yet been finalized, states can claim credits for renewable energy projects commencing construction after September 2018, and they can use these credits to avoid equivalent emissions cuts from 2022 onward when the Clean Power Plan takes full effect. This suggests that any savings in emissions from renewable energy that gets built thanks to the tax credit extensions may result in a future emissions increase because states will have additional emissions headroom to comply with the Clean Power Plan. Because this early compliance mechanism has yet to be finalized, we excluded the effect of future offsetting emissions from our central 2020 estimate of CO2 reductions; we do, however, include it in assessing the full range of possible impacts.
To express the sensitivity of our central emissions estimates to the assumptions outlined above, we have added uncertainty ranges to the bars in in Figure 2 to indicate uncertainty. The pronounced uncertainty range in 2020 reflects the open question of whether emissions saved by renewable energy will be offset by future Clean Power Plan compliance headroom.
The take-home point from this figure is that the emissions reductions from solar and wind energy through 2020 is substantial, reaching as much as 90 million metric tons of avoided CO2 per year in 2020. The average annual emissions reduction over the 2016-2020 period is 25-46 million metric tons with a most likely value around 40 million metric tons. For reference, the Obama administration’s Clean Power Plan is projected to reduce CO2 emissions by about six times that level, or 240 million metric tons per year, in 2025.
Putting It All Together: Renewable Energy Climate Impact Overwhelms That of Oil Exports
In contrast to the considerable emissions savings from renewable energy, the climate impact of lifting the crude oil export ban is likely to be small. A previous post estimated the average annual emissions impact of lifting the oil export ban as around 10 million metric tons of CO2 per year over 2016-2025 (with a possible range of 0–20). Over the time period we have examined in this post, 2016–2020, the same methodology yields an estimate of 2 million metric tons of CO2 annually (with a possible range of 0–5).
Figure 3 extends the previous figure by adding the range of positive emissions from crude oil exports to the emissions savings from new renewable energy incentivized by the budget deal. The diamonds represent the central estimates of the net emissions impact of oil exports and new renewable energy, and the dotted bars represent the uncertainty range of how much oil exports could increase emissions.
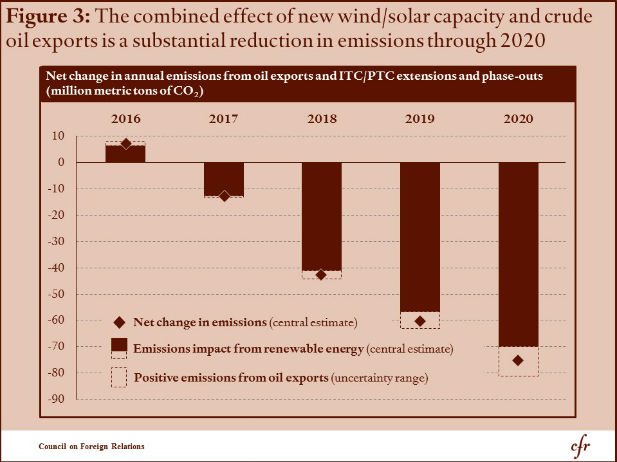
The net impact of the exports-for-renewables-credits trade, then, is to reduce carbon dioxide emissions by at least 20-40 million metric tons annual over the 2016-2020 period. The most likely emissions reduction in our estimate is around 35 million metric tons. The climate benefit of the tax credit extension is over a factor of ten larger than the climate cost of removing the oil export ban over this period.
What About the Longer Run?
This of course does not answer the question of what will happen over the longer run. The impact of lifting the oil export ban will persist while the ITC/PTC will be phased out.
One could, in principle, extend the analysis above through 2025. (A very simple extension of the central estimates through 2025, assuming no emissions savings from the PTC/ITC after 2020, leaves one with an ITC/PTC impact considerably outweighing that of oil exports.) This would, however, be misleading. Extension of the PTC/ITC should drive down zero-carbon energy costs and reduce business as usual emissions beyond 2020. Both factors should enable stronger rules under the Clean Power Plan (or other policies that are additional to the plan). This is part of the potential payoff of an ITC/PTC extension. This can’t, of course, be modeled quantitatively. But it is the right way to think about the longer run impact of the budget deal.