The Trump Affordable Clean Energy Policy: Deciphering Emissions Math

By experts and staff
- Published
- Amy M. JaffeDavid M. Rubenstein Senior Fellow for Energy and the Environment and Director of the Program on Energy Security and Climate Change
- Guest Blogger For Energy Realpolitik
This post is co-written by Daniel Scheitrum, an assistant professor at the University of Arizona’s Department of Agricultural and Resource Economics.
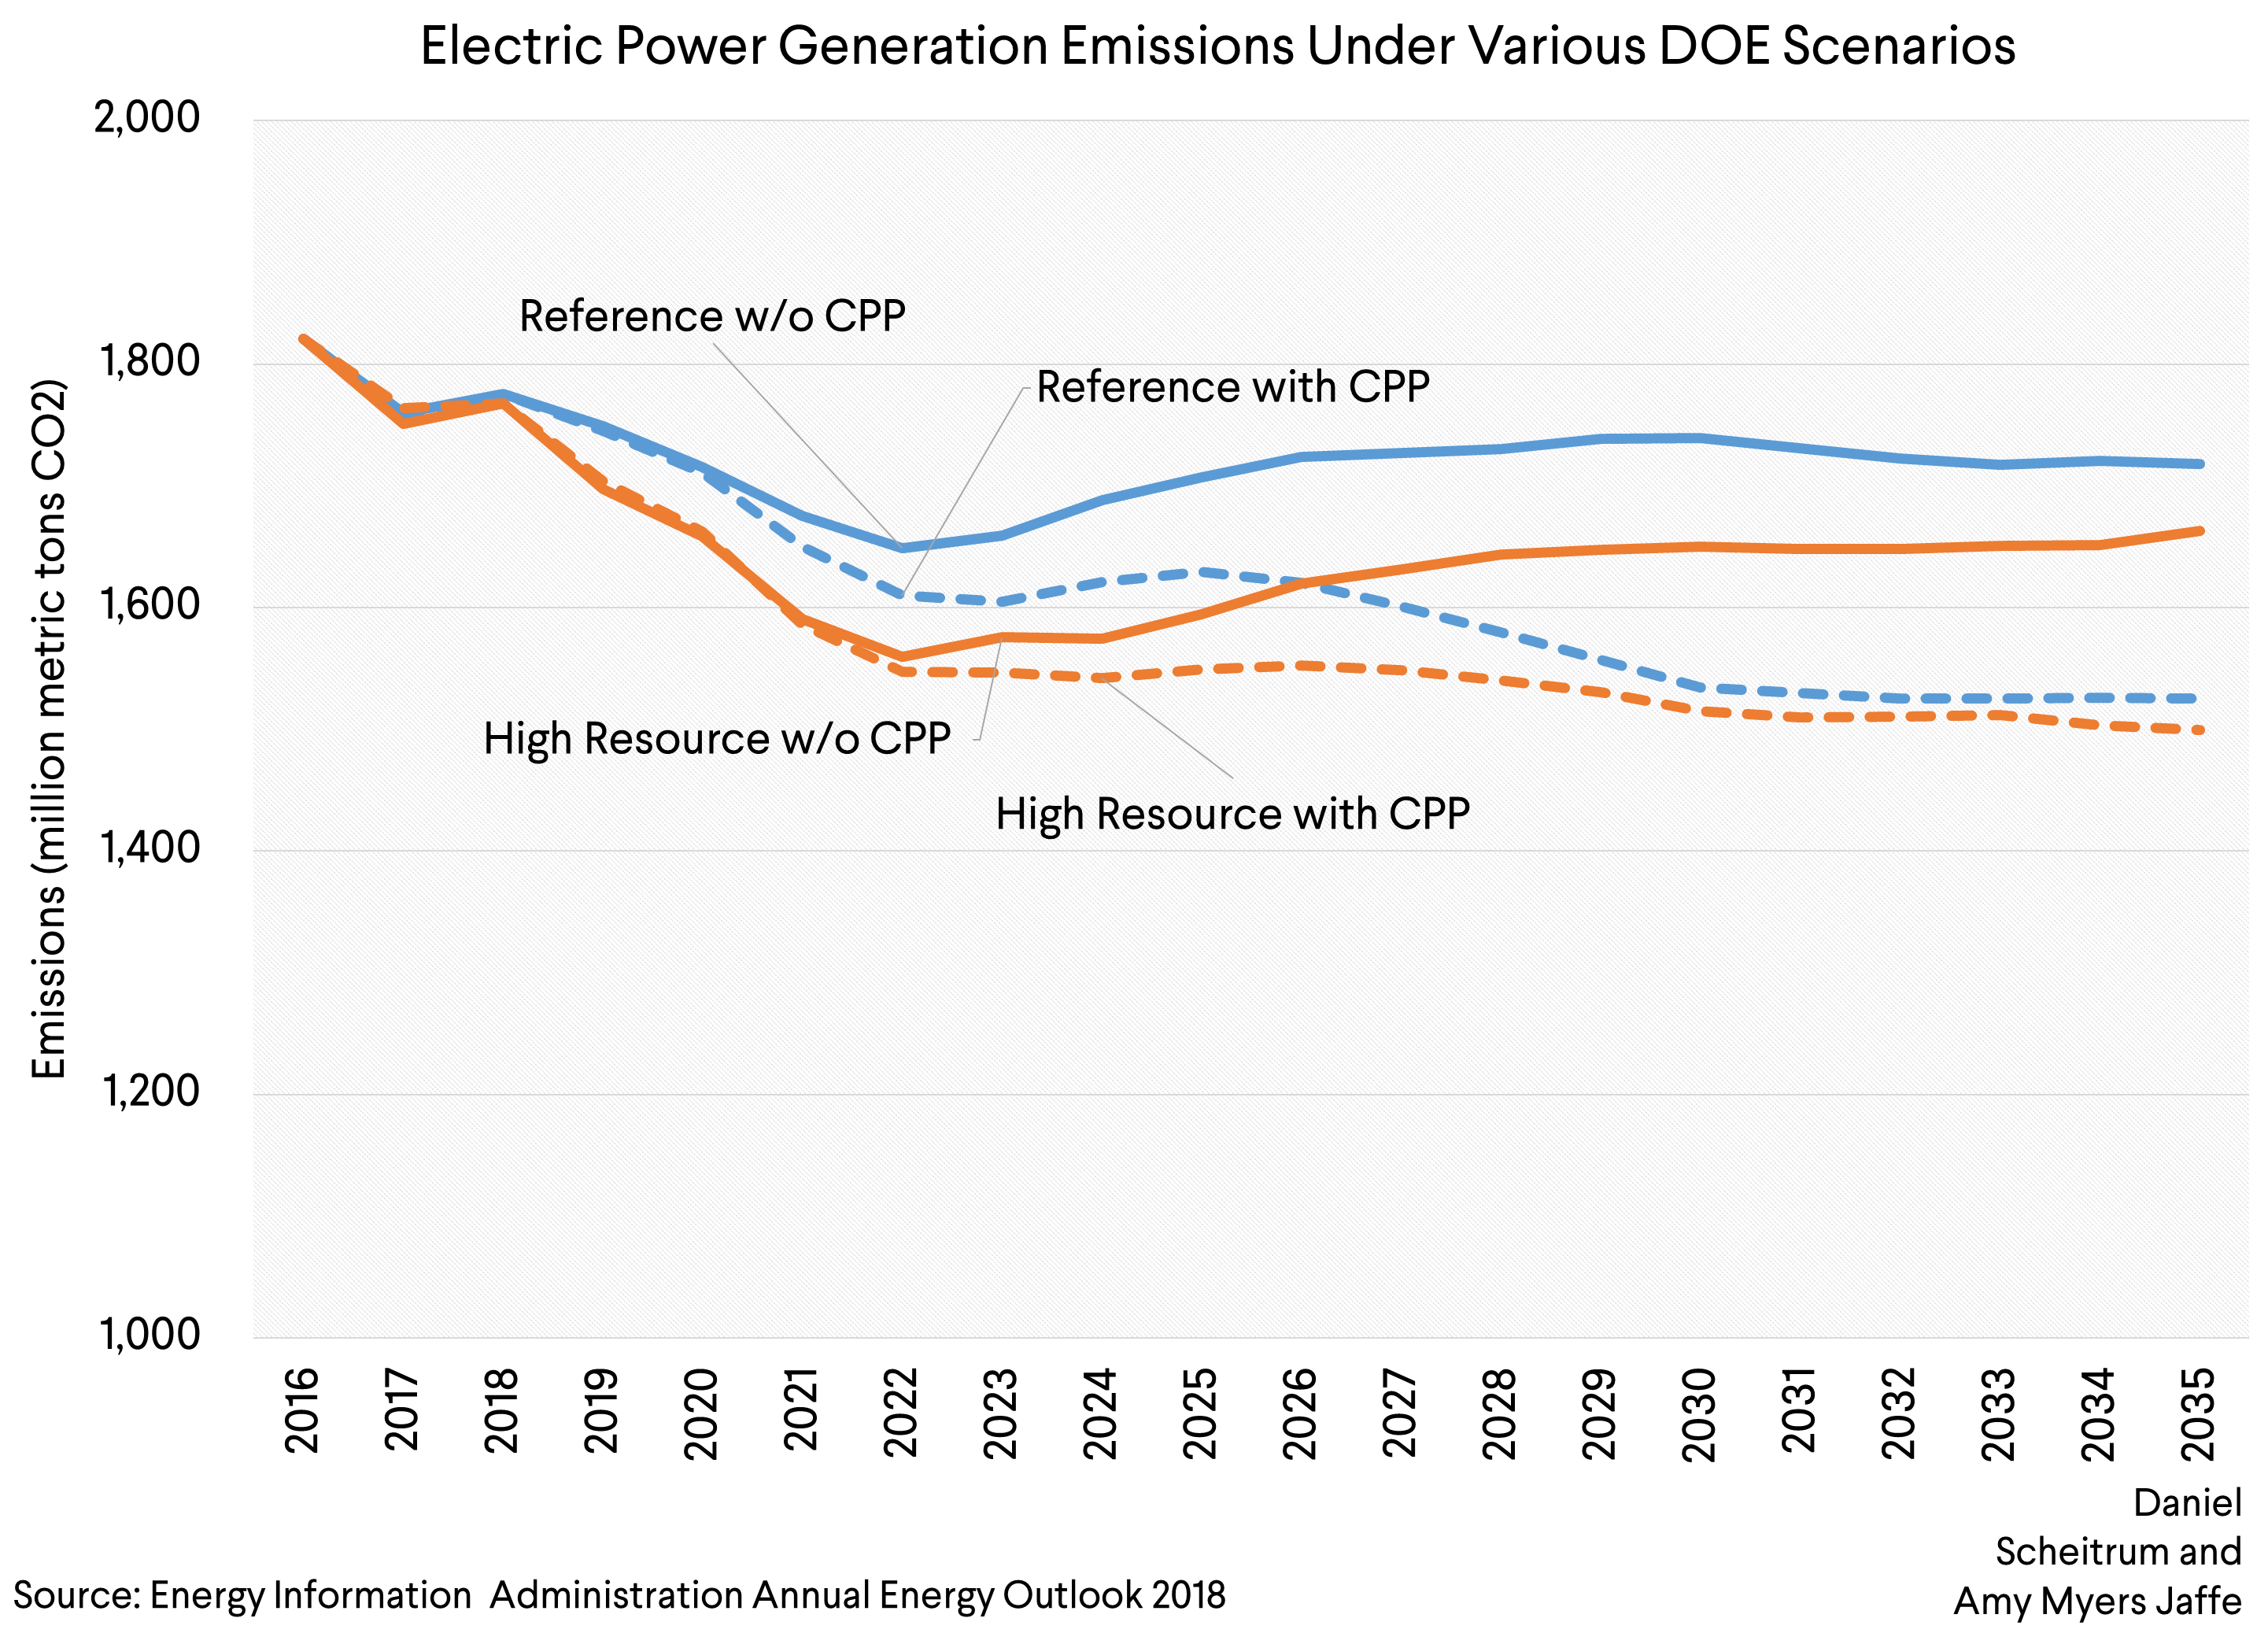
In the U.S. Environmental Protection Agency document summarizing the newly proposed Affordable Clean Energy rule (ACE), the notice correctly points out in the background section of the executive summary that carbon dioxide emissions in the U.S. power sector have steadily declined in recent years “due to a variety of power industry trends, which are expected to continue.” The EPA document specifically mentions an expectation that the price of natural gas will remain low and solar capacity will continue to grow. It notes that some power plant generators have announced plans to change their generation mix “away from coal-fired generation towards natural gas fired generation, renewables and more deployment of energy efficiency measures” and cites the U.S. Energy Information Administration’s (EIA)’s 2018 Annual Energy Outlook, “the cumulative effect of increased coal plant retirements, lower natural gas prices and lower electricity demand in the AEO2018 reference case is a reduction in the projected CO2 emissions from electric generators even without [implementation of] the [CPP].”
These same market trends have been noted by independent experts who also contend that the ACE is unlikely to change the trajectory for U.S. coal. S&P Global Market Intelligence reported last week that it saw no evidence that electric and municipal utilities were going to reevaluate plans to shut down coal generation as a result of the shift to the new ACE plan. S&P Global’s analysis forecasts that 23,700 Megawatts (MW) of coal-fired capacity is scheduled to be retired between 2018 and 2032, including thirty-six coal units expected to shut down prior to 2020. Some major utilities have already publicly confirmed retirement plans will continue unchanged. For example, AEP and Dominion Energy have announced that they will not adjust plans. Dominion still plans to retire its Yorktown coal units while Duke Energy will retire coal at Asheville, North Carolina and bring on natural gas-generation in the same location. Duke also has plans to retire plants in Gaston County, North Carolina and Citrus County, Florida in a business decision the company says was not related to the CPP. Notably, First Energy Corporation has said the new proposed ACE will not change the planned retirement or transfer of the 1,300 MW Pleasants coal plant in West Virginia. FirstEnergy Solutions announced it plans to shut down four coal fired power plants, including three in Ohio, by 2022. Colorado’s Public Utility commission also gave preliminary approval this week for Xcel Energy to close 660 MW of coal fired generation and replace it with renewable energy plus battery storage. The utility says the plan will save ratepayers $213 million.
While there seems to be a lot of agreement on these basic trends, the numbers on anticipated emissions reductions from the U.S. electricity sector between now and 2035 vary considerably. We take a closer look at the differences and offer some background.
The Clean Power Plan, proposed by the Obama administration in 2014, prescribed that each state would meet specific standards for carbon dioxide emissions based on their individual energy consumption. States were free to determine how to achieve the reductions through a state action plan to be approved by EPA. The plan was challenged in court by twenty-seven states. At issue, among other objections, was the plan’s broad scope covering actions that went beyond regulating steps to be taken at the individual plants themselves. The new proposed ACE rule limits regulation to plant-specific compliance to performance standards.
Estimates for the emission reductions that will come via the ACE diverge from other forecasts for the U.S. power sector and are lower than reductions projected for the Clean Power Plan. To delve into the differences, we start by pointing out that estimates from 2015 regarding the CPP’s expected effect on emissions are considered out of date. That’s because so much change in fuel sources for U.S. generation has already taken place in the power sector that emissions reductions have gone beyond estimates for the current time made four years earlier. There are even notable differences between the EIA’s AEO 2017 and AEO 2018 estimates which makes sense since market driven changes in the sector are happening so rapidly.
One important input variable producing differences in analysis for 2025 to 2035 is assumptions about future U.S. domestic natural gas prices. The EIA reference case assumes natural gas prices of $3.40-$5.00 per million Btu (mmBtu) while its “high resource” case projects natural gas prices in the range of $2.90-$3.30/mmBtu. We believe the high resource case estimate for U.S. natural gas prices is most likely given that prices have averaged $3.15/mmBtu over the past five years. Futures prices out to the year 2025 range from $2.91/mmBtu at the end of 2018 to $2.70 in summer 2025 and while they are not predictors per se, they reflect the amalgamation of current bets by natural gas traders.
Barclays raised its natural gas forecast for fourth quarter 2018 to $2.83 mmBtu, up from $2.58 mmBtu, noting that injections of natural gas to storage this year have been the lowest in almost a decade. Cheniere’s new liquefaction trains at Corpus Christi, Texas and Sabine Pass are also expected to come on line soon ahead of schedule, originally scheduled for early 2019. A new plant at Elba Island will also start operations this year. The three projects together will boost U.S. export capacity by about 1.5 billion cubic feet a day. Barclay’s also notes that U.S. natural gas production will reach record highs next year, growing by 4.5 bcf/d.
EIA’s 2018 reference case for greenhouse gas emissions without the CPP in place expected emission reductions of 694 million metric tons (MMT) by 2025 compared to 2005, 662 MMT in 2030, and 683 MMT in 2035. By comparison, the high resource case without the CPP projects emissions reductions of 807 MMT in 2025 compared to 2005, 751 MMT in 2030, and 738 MMT in 2035.
The EPA’s ACE proposal does not provide estimate of total levels of emissions, but rather changes in the baseline emissions. EPA’s models differ from those of EIA and focus on changes on a state by state, facility by facility level and caps only existing sources. That is in contrast to EIA’s model which looks across state lines at regional balances and projections for competition among new sources. EPA’s estimates in the rollout of the ACE projects that repealing the CPP would increase emissions by 45 MMT in 2025, 67 MMT in 2030, and 60 MMT in 2035. The proposed emissions reductions of the ACE program are provided in comparison to these values. For instance, the ACE scenario of Replacing the CPP with Heat Rate Improvements of 4.5 percent at a cost of $50/kW projects emissions to increase by 34 MMT by 2025, 55 MMT in 2030, and 50 MMT in 2035. The contribution of the ACE in 2025 is then reducing emissions by 11 MMT compared to replacing the CPP with no policy.
Jason Bordoff of Columbia University’s Center for Global Energy Policy (CGEP) noted the gaps in these estimates in a recent op-ed, and compared them to Rhodium Group’s baseline forecast, which anticipates higher emissions reductions of about 35 percent by 2030 and assumes similar natural gas prices as the high resource case for EIA. In his op-ed, Bordoff notes that a recent joint Columbia-Rhodium study calculated that a carbon tax starting at $50 per ton and rising each year by 2 percent could double the 36 percent emissions reduction previously expected from the CPP by 2030 by accelerating the switch to renewables.
The bottom line is that there is much uncertainty about the ultimate level of emissions changes that could result by 2025 depending on both market trends and policy frameworks. One interesting aspect of the proposed rule-making under the ACE is that it would give individual states up to two years to develop and submit their climate action plans for the power sector to EPA for approval. That would kick the can into the next U.S. presidential election cycle. Since polling shows that a majority of Americans are in favor of some kind of climate policy and climactic weather events are likely to stay in the news through 2020, it’s anyone’s guess how individual states will choose to proceed. This fall’s midterm elections could provide some hints.