 Online Store
International efforts, such as the Paris Agreement, aim to reduce greenhouse gas emissions. But experts say countries aren’t doing enough to limit dangerous global warming.

President Obama: The World’s Best Oil Market Manager?
More on:
Okay, so the title of this post is tongue-in-cheek: the U.S. president has far less power to influence gasoline prices than campaign-season banter would lead you to believe. But I figure if a sitting president can take the blame for high and volatile oil prices, maybe the White House should take a little pride in the fact that, by some measures, oil prices reflect the lowest volatility in years. (There’s a bit more to the story, though.)
Figure 1 shows the annualized 30-day historical volatility of spot WTI prices since 1984, the first full year after the benchmark launched based on that crude stream. Since the start of 2013, volatility by this metric hasn’t been so low on average since 1995. Were it to drop below 15 percent and stay there consistently, it would be the first time since 1992.
Figure 1. Annualized 30-day historical volatility of spot WTI prices (1984 – present)
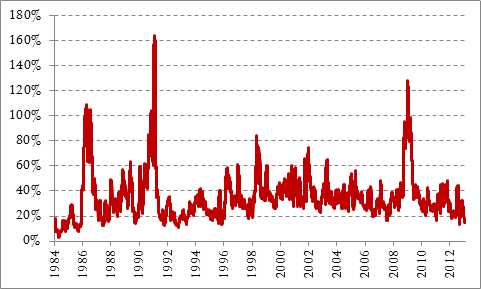
Source: Bloomberg
Note implied volatility as well. The so-called “Oil VIX,” a barometer of market expectations of 30-day volatility of crude prices, dropped to 21.67 percent on January 22, the lowest reading since the index began tracking the market in 2007. The index is an oil-specific version of the VIX, a measure of equity market volatility, derived from volatility skew from a range of option strike prices on the United States Oil Fund.
Figure 2. CBOE Oil ETF VIX Index (2007 - present)
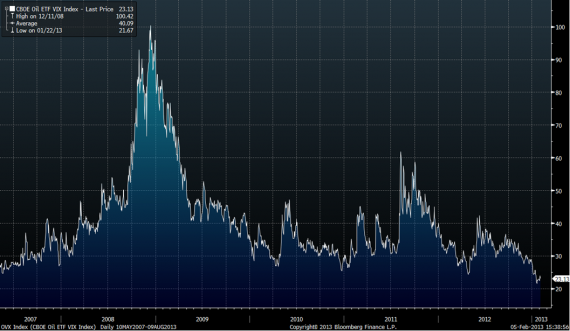
Source: Bloomberg
Looking at historical volatility only in percentage terms, though, can mask the magnitude of the changes in absolute prices and thereby gloss over the potentially harmful macroeconomic effects of large price swings. If you were to look only at Figure 1, you couldn’t tell that the oscillation in flat price has been of an order of magnitude higher between 2010 – 2012 than it was from 1996 - 1998. These absolute changes are not always quantitatively discernible when viewed in relative terms, but they matter to net effects on the macroeconomy.
Figure 3. WTI spot prices (1983 – present)
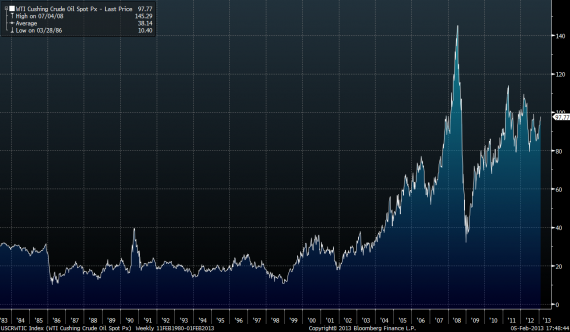
Source: Bloomberg
One way to see how noisy today’s oil prices are in absolute terms is to multiply prices by volatility. Figure 4 shows WTI spot prices since 1984 times the same rolling 30-day volatility depicted in Figure 1. The result is striking: the market’s gotten a whole lot rowdier when it comes to the magnitude of the price swings in dollar terms, even if volatility by other measures has fallen.
Figure 4. Annualized 30-day historical volatility of spot WTI prices * spot WTI prices (1984 - present)
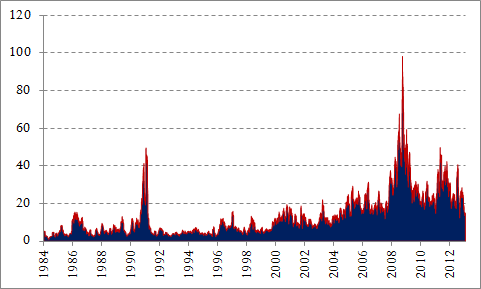
Source: Bloomberg
More on: