China’s Q3 Balance of Payments Data Helps Explain Why Q3 Reserves Fell So Much

I want to step back a bit from the rather extraordinary moves in the offshore yuan market over the past few days. It seems quite clear that China’s authorities felt the need to signal that the yuan isn’t currently a one way bet against the dollar. And stepping back in this case means taking a deep dive into the details of the balance of payments data -- details that come out with a quarter lag, and thus provide information that is stale from the point of view of a forward-looking market. A lot, and I mean a lot, changed in the fourth quarter.
I generally like it when China’s data series line up. Line up with each other. And, when possible, when China’s data also lines up with data reported by China’s trading partners.
So I have been bothered for some time by the large discrepancy between the fall in China’s foreign exchange reserves (as reported on the PBOC’s balance sheet, $108 billion in the third quarter) and the much smaller net sales of foreign exchange by China’s banks (as reported in the FX settlement data, $50 billion in the third quarter without adjusting for the forwards reported in the settlement data, $63 billion with the forward adjustment). Fx settlement includes all the banks, not just the central bank. Historically, though, it has been very correlated with overall reserves.
The initial balance of payments (BoP) data for the third quarter showed large reserves sales ($136 billion), sales on a scale that was consistent with the PBOC balance sheet numbers. The BoP reserves sales thus seemed to suggest a big pickup in capital outflows in the third quarter.
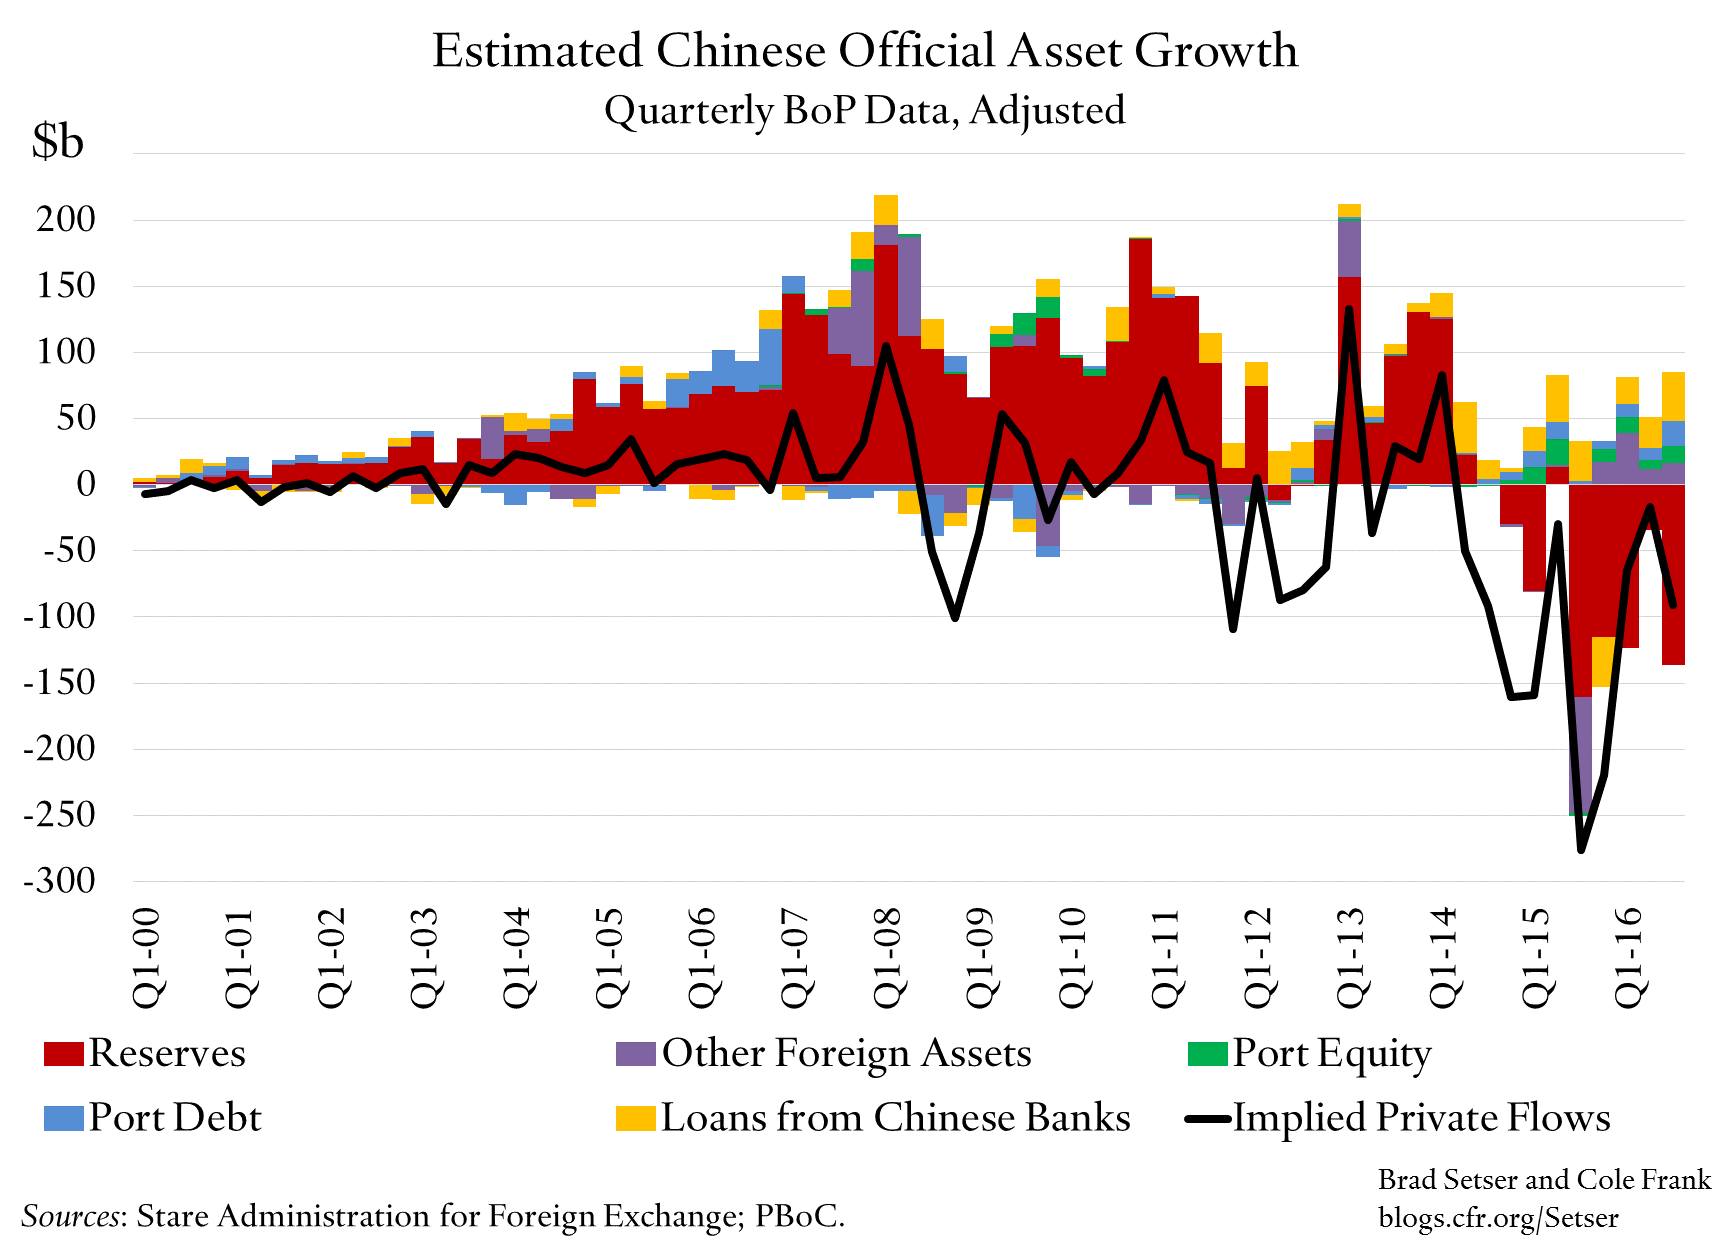
However, the detailed balance of payments data suggests that the signal from the FX settlement data may be more accurate. Much of the q3 fall in China’s reserves seems tobe explained by the buildup of foreign assets by other state controlled financial institutions, not “private” capital outflows. I see a likely increase of around $85 billion in the foreign assets of state institutions other than the PBOC in q3.
Which implies that the actual fall in “official” assets might be as low as $50 billion in the third quarter, and estimated private outflows (estimated as the difference between net inflows from the current account and net FDI flows and the buildup/sale of official assets) might have been about $100 billion.
The ongoing build-up of foreign assets by the state banks and other state institutions also implies that the net sale of foreign assets by China’s state might have been as low as $200 billion in the four quarters from q4 2015 to q3 2016, with $400 billion in reserve sales offset in part by a rise of around $200 billion in the foreign assets of China’s other state financial institutions.
Two hundred billion dollars is a large sum -- but one that also suggests that depreciation pressures earlier this year were significantly smaller (when official sales are scaled relative to China’s GDP) than the appreciation pressure back in 2006, 2007 and 2008 (and, for that matter, 2010).
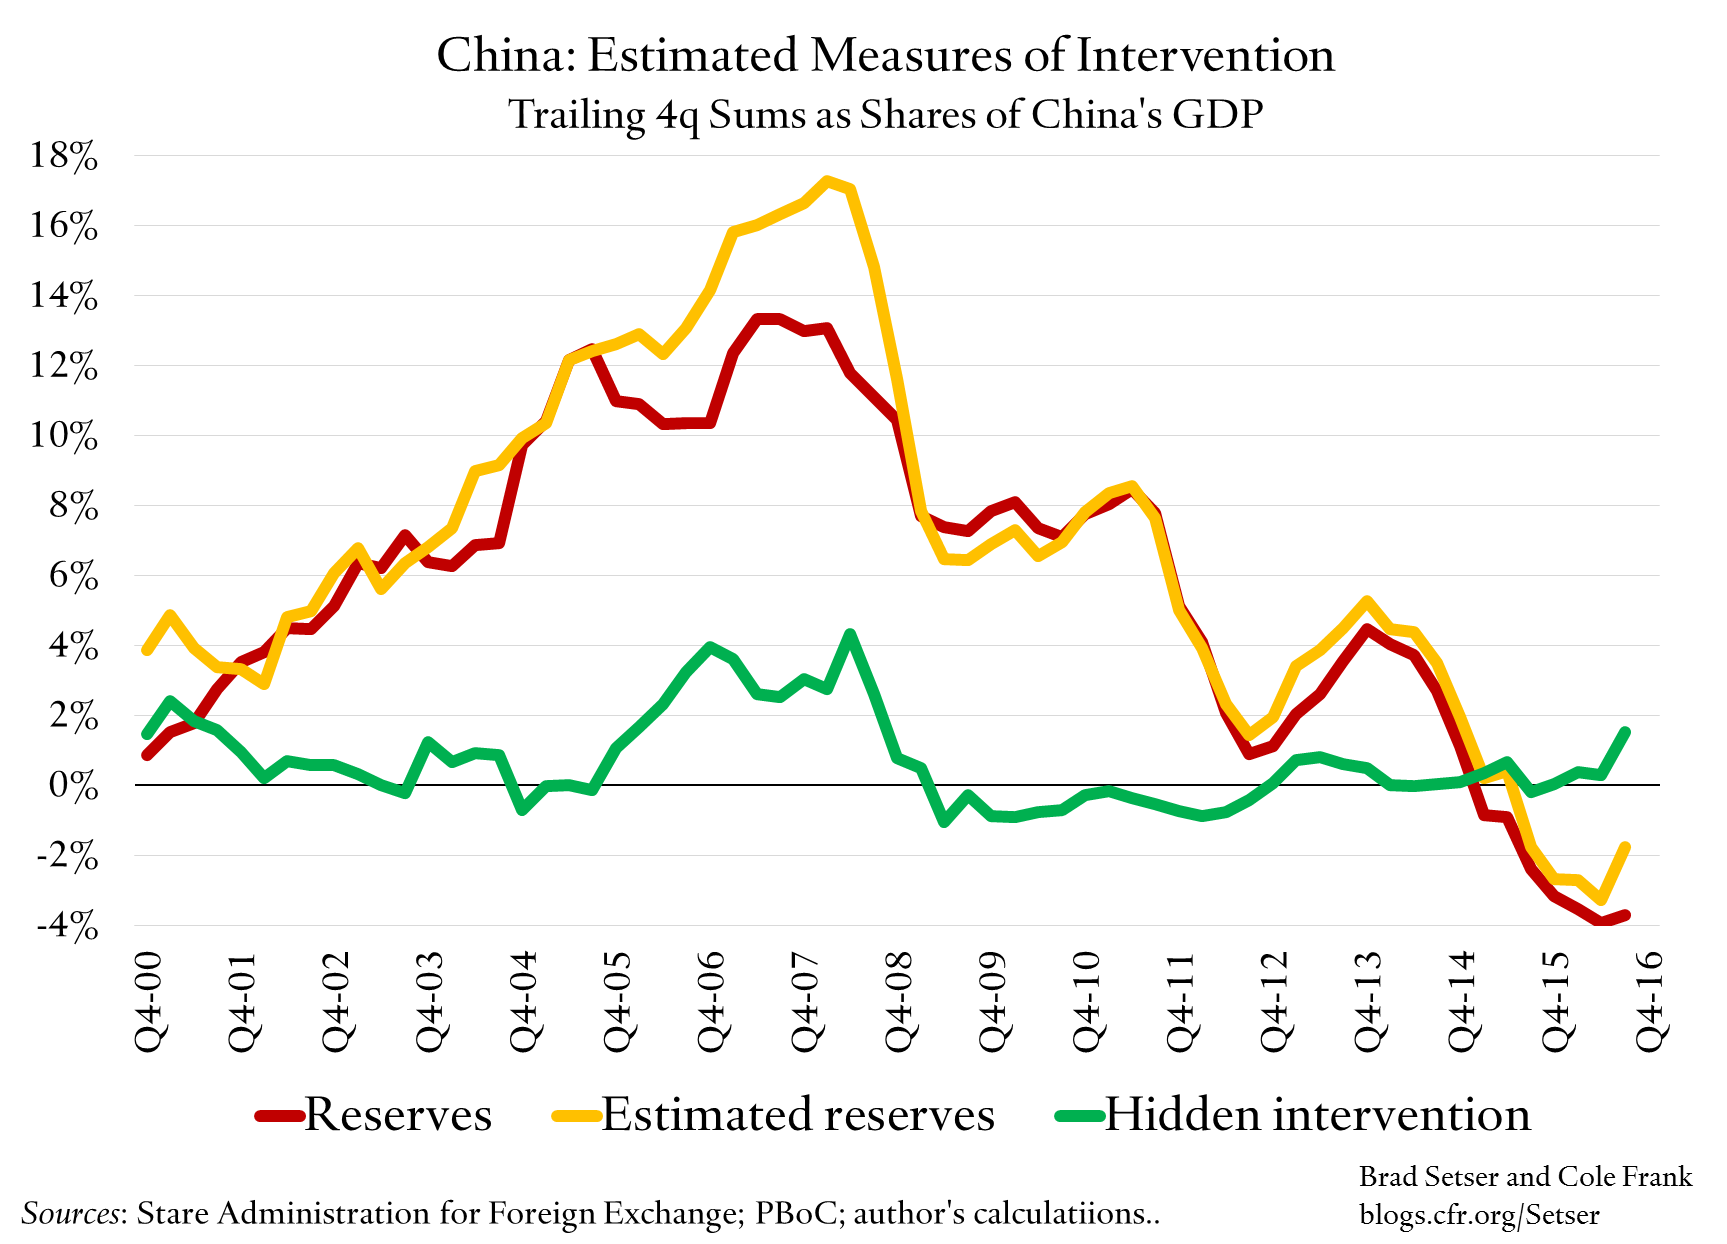
(In the chart above estimated reserves is a bit mislabeled; it should be either “augmented reserves” or “estimated official outflows”)
To be clear, my adjustments change the timing of the sales (and thus the timing of the peak outflow pressure) more than the cumulative magnitude of sales. They imply that state financial institutions sold a lot of foreign assets in the third quarter of 2015 to help the PBOC support the currency, and then rebuilt their foreign asset position over the next few quarters -- most obviously through a fall and then a rise in the state banks holdings of foreign exchange as part of their required reserves (reported as “other foreign assets” on the PBOC’s balance sheet).
And I also have little doubt that outflow pressure increased in the fourth quarter of 2016. The modest sum in the trailing four quarter sum through q3 is thus in part a function of the fact that two quarters with large sales are just outside the covered time period.
Several other caveats are also needed.
First, I am trying to understand the outflows in the third quarter (July through September). The third quarter is now ancient history. The yuan was relatively stable against the dollar in most of the third quarter. The yuan decidedly was not stable against the dollar in q4 and outflow pressures seem to have increased. The PBOC tightened its controls in the fourth quarter for a reason.
Second, even if I am right and “true” private outflows are smaller than implied by reserve sales in the balance of payments in the third quarter —the obvious measure of “hot” outflows from China is either the difference between reserves (sales/purchases) and the current account, or the difference between reserve sales and the combined surplus from the current account and net FDI flows—there is no question that outflows were larger in the third quarter of 2016 than in the second quarter of 2016. The question is one of magnitude, not of direction.
Third, to keep it simple, my estimate of “private” financial outflows in the first chart doesn’t include outflows that are disguised in the current account. It thus likely under-states actual capital outflows, as I clearly think there are financial outflows embedded in the current account. I tried to keep the chart relatively simple, and the adjustments relatively transparent -- so I didn’t adjust for hidden outflows.**
Fourth, these estimates hinge on a set of educated guesses about who appears where in the balance of payments data, as China doesn’t release the kind of details that would allow outside observers to know for sure which set of institutions inside China’s financial system built up their foreign assets. I want to emphasize that these estimates are subject to change as my understanding of what drives different categories in the balance of payments changes.
So why precisely do I suspect official (or quasi-official) asset growth provided a significant offset to reserve sales in the third quarter?
A) The balance of payments data shows a $16 billion increase in the line item that corresponds to the rise in the PBOC’s other foreign assets -- the technical term for the foreign exchange the banks are required to hold as part of the regulatory reserve requirement.
B) There was a big rise in lending by the state banks to the rest of the world (“loans” by the banks to the world rose by $37 billion in q3). I have always assumed that the term “state commercial bank” has real meaning in China, and that such lending could be stopped if the government really wanted it to stop. It was more or less non-existent before 2011, and much of the rise since then clearly comes from the China Development Bank.
C) The balance of payments data shows large purchases of foreign portfolio debt and foreign portfolio equity (just over $30 billion in q3). This is a bit puzzling because there was no reported change in the Qualified Domestic Institutional Investor (QDII) quotas. So it wasn’t, I assume, from small private investors. And it wasn’t totally hidden either. After all, it shows up in the official data as an outflow, and also as a rise in foreign assets in the international investment position data. My best guess is that this is coming from some kind of state institutions —be it the social security fund, the China Investment Corporation (CIC), the state banks or even perhaps the life insurers.
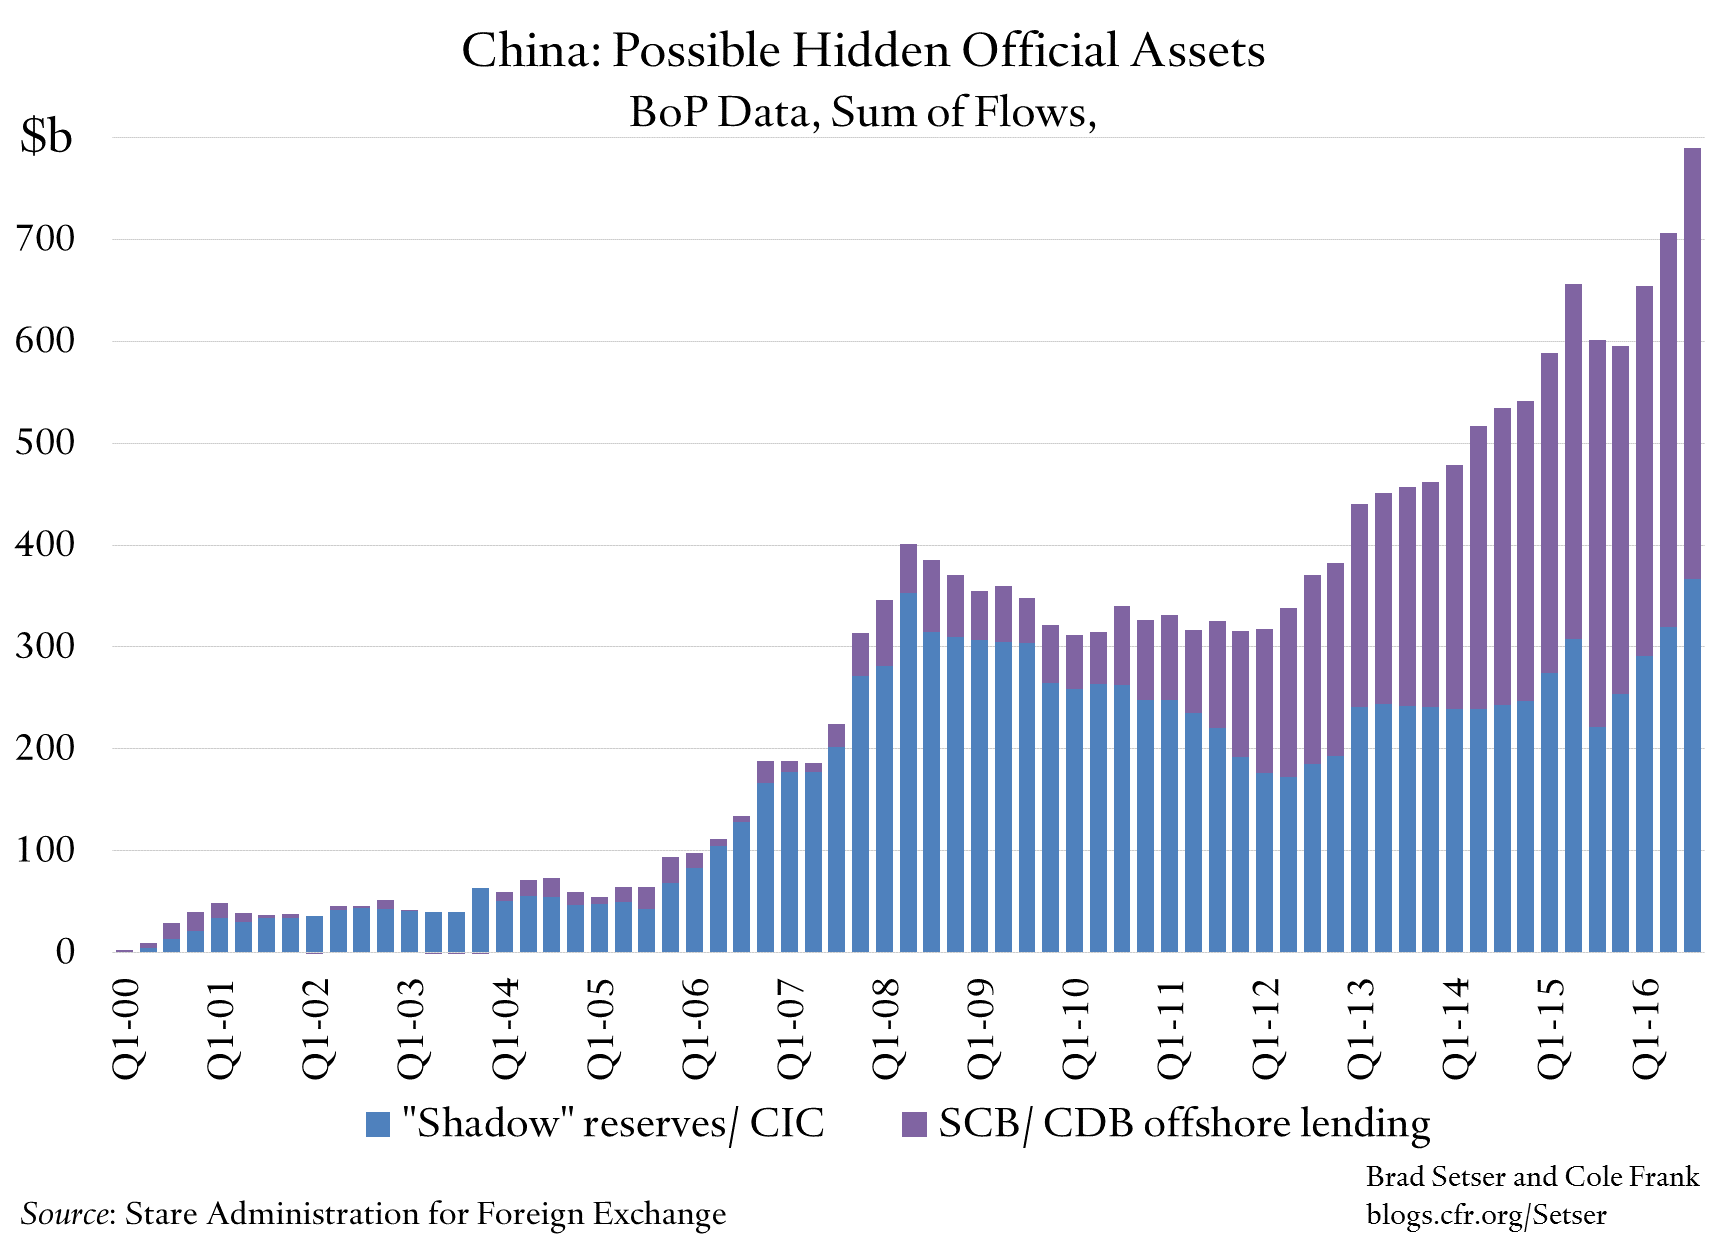
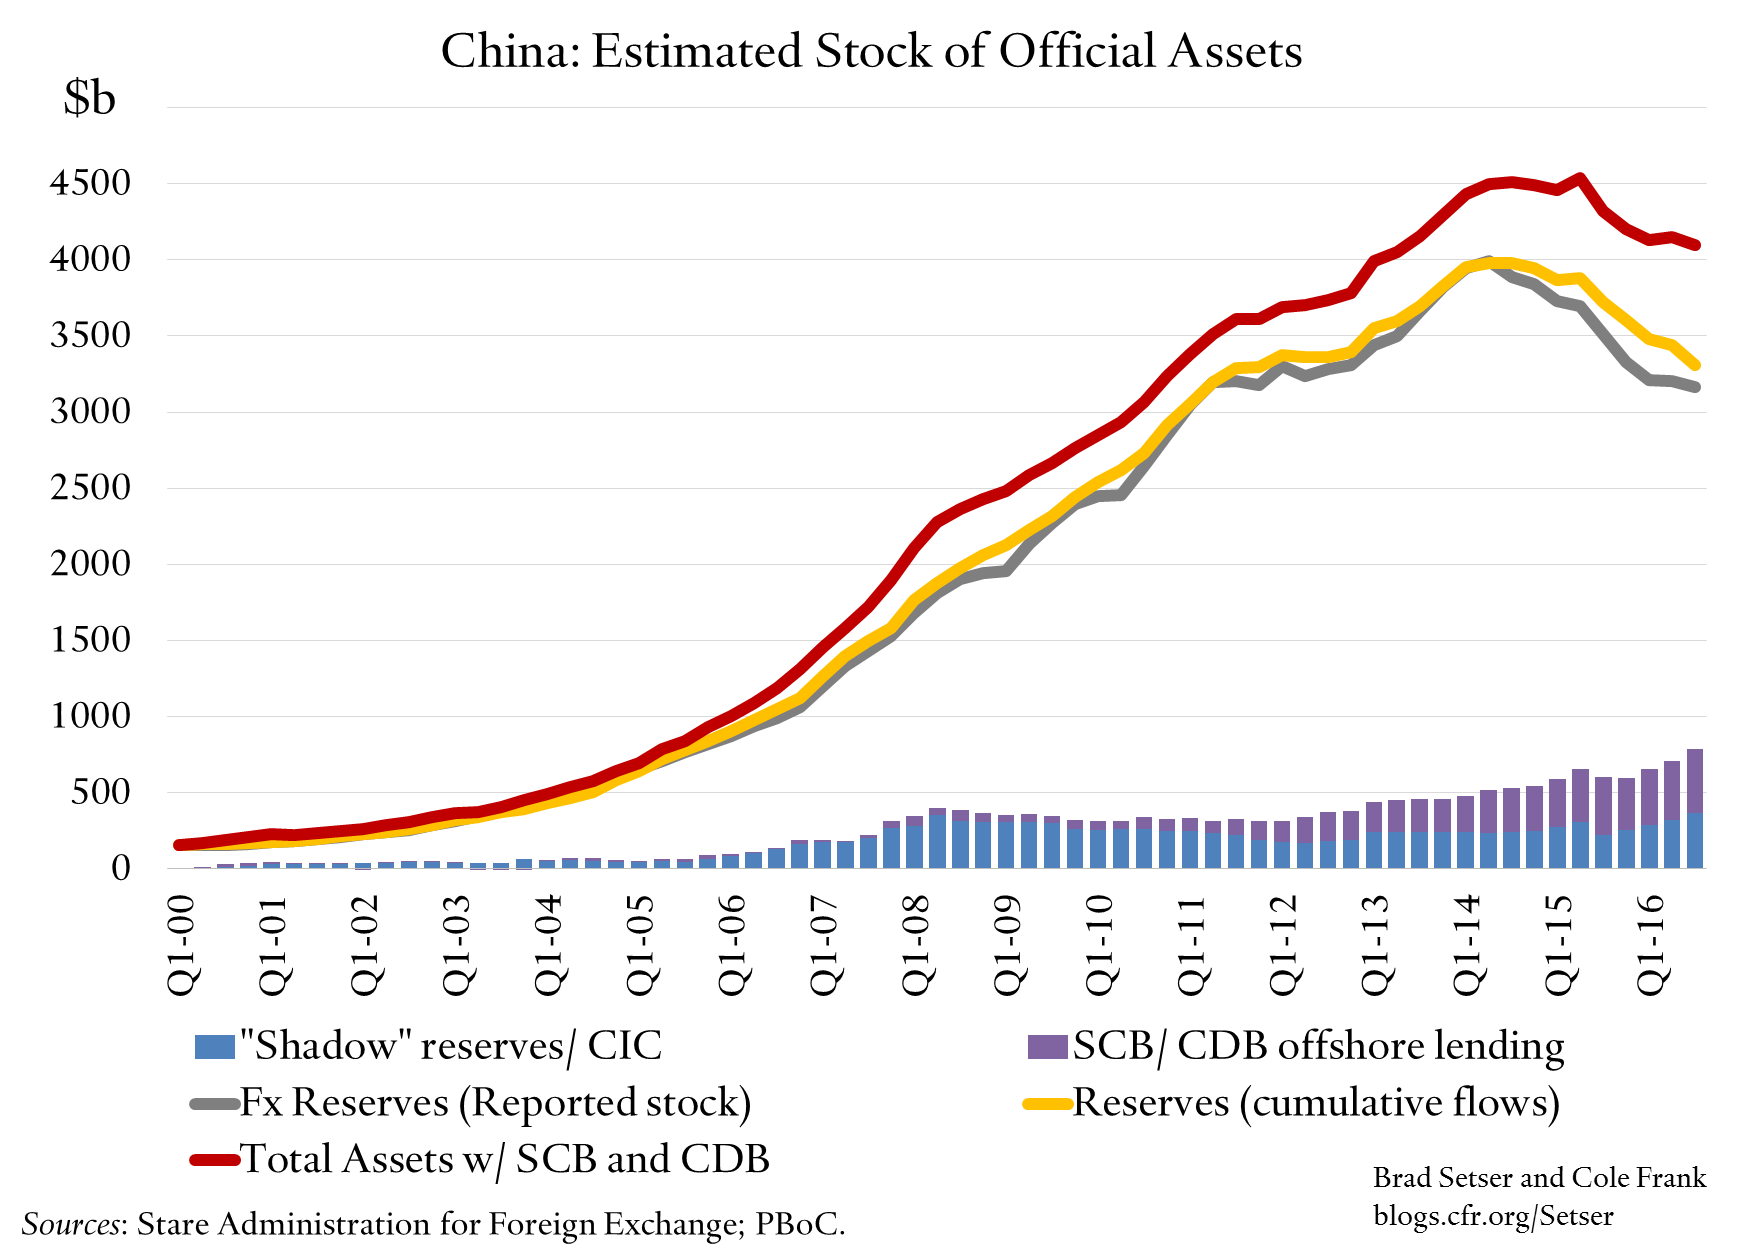
As a result, my estimate of the total stock of foreign assets under China’s state control fell by significantly less than the PBOC’s reserves in the third quarter.**
All this implies that one arm of the state is betting against another, with state financial institutions building up assets abroad even as the PBOC runs down its reserves. And it thus raises a simple question: why would the government want to draw down its central bank reserves to allow the state commercial banks and other state financial institutions to raise their foreign assets?
My gut is that some folks at the PBOC started asking similar questions over the last year, which could in part explain the tightening of controls toward the end of this year—cracking down on FDI outflows sent a signal that the “go out” policy no longer dominates all other considerations. Chinese policy coordination isn’t always perfect.
Finally, my gut also says that while the pressure in q3 wasn’t as severe as the fall in reserves suggests, the fourth quarter is different. The squeeze now underway in the offshore yuan market suggests that the PBOC is working hard to discourage further outflows and to fight expectations of further depreciation.
* Technically, I am assuming that “other, other, assets”, “other, loans, assets”, “portfolio debt, assets”, “portfolio equity, assets” are all driven by state controlled institutions, and not making further adjustments The portfolio flows data could be adjusted for QDII, but I think it is clear that “portfolio debt” historically has been driven by the state banks (05 to 06 purchases, then sales) and portfolio equity has been in part driven by the CIC given the timing, and the recent run-up isn’t a function of QDII. “Other, other” is the foreign exchange the banks hold at the PBOC as part of their required reserves, other, loans seems historically to have been driven by the CDB. Of course the recent rise could come from different channels, but it almost certainly comes from the large state banks.
** This is all based on “on balance sheet assets,” it doesn’t attempt to adjust for China’s rumored forward book. See this post for more on the forwards (with apologies for the level of technical detail).