Reserve diversification — what does the IMF data tell us?

There is a lot of interest in reserve diversification.
And most of those present at the May Euromoney fx conference in London—judging from the audience poll – believed that at least some central banks are diversifying.
My comments back then emphasized the unprecedented pace of reserve growth rather than diversification. Large-scale diversification seems hard to square with the record growth in central bank custodial holdings of Treasuries and Agencies reported by the New York Fed.
My argument fell flat. I sort of understand why.
Flows drive markets and at the time the most visible flow in the currency market came from ongoing central bank sales of dollars for euros, pounds and a few other currencies. G-10 currency traders care far more about the amount of dollars central banks sell than the amount they keep. Presumably those trading US treasuries or agencies have a slightly different point of view.
So I decided to step back and look at the data -- and specifically the data from emerging economies countries that report to the IMF. That doesn’t tell us what central banks are doing now. But it provides the most detailed picture available of what central banks – or at least those central banks that report data on the currency composition of their reserves to the IMF – have done in the past.
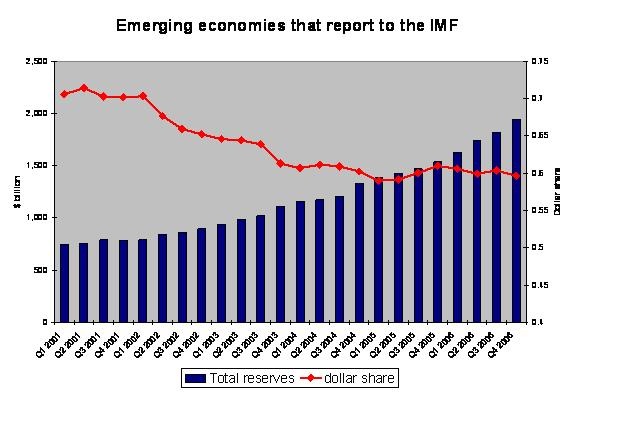
The first chart shows the stock of reserves and the dollar share of those reserves on different axis.
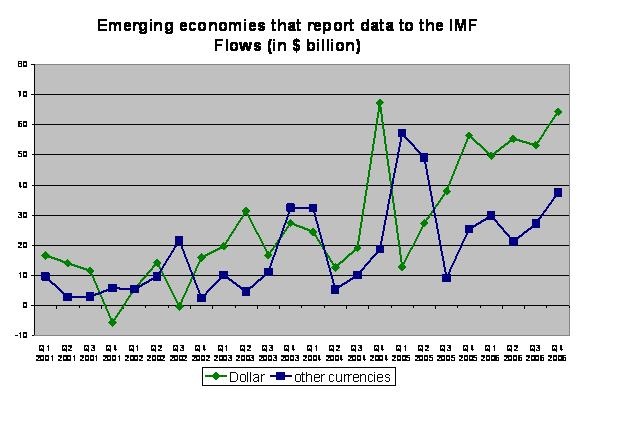
The second chart shows flows – i.e. the change in dollar reserves and the change in non-dollar reserves – implied by the stock data reported in the COFER data set. Calculating flows is fairly straight-forward: the COFER stock data makes it easy to strip out the impact of valuation gains (losses) and thus to infer flows.
 A couple of things jumped out at me.
First, those reporters who equate changes in the dollar’s share of total reserves with changes in total dollar holdings do their readers a disservice. Emerging market central banks clearly added a lot of dollars to their portfolio in q4 even though the dollar’s share of their reserves slipped a bit. Overall reserves are growing fast. Too much attention – in my view – is given to changes in the dollar’s share of reserves and too little to the actual flows.
Second, those emerging economies that report data to the IMF did diversify – in the sense of lowering the dollar share of their reserves – between the end of 2001 and the end of 2003.
If you match the flows data to the chart showing the dollar share, there two quarters of what might be called “active” diversification. In both q3 2002 and q4 2003, reporting central banks bought a lot of euros and other currencies even as the dollar was falling.
In those quarters central banks added to the pressure on the dollar.
Central banks also engaged in “passive” diversification. Through the end of 2003, if not a bit later, they allowed the rising dollar value of existing euros and pounds to reduce the dollar’s share their portfolio.
Third, emerging economies bought a lot of euros and pounds in q1 and q2 of 2005 – enough to lower the dollar share of their reserves slightly (it subsequently rebounded). It is hard though to call this diversification, though, as the dollar rose in these quarters and they basically held the dollar share of their reserves constant.
The flows in Q1 2005 perhaps to represent some true diversification – the dollar was reasonably strong that quarter, and, based on the flow data, a lot of emerging economies sold some of the dollars that they had bought in q4 2004 for euros and pounds. But in q2 2005 the dollar rose sharply in value (the euro fell). Central banks bought euros when private markets wanted to sell. Their demand for euros was stabilizing.
Fourth, the salient feature of the past quarter and indeed the past year, at least to me, has been the strength of dollar reserve growth. Reporting emerging economies added $200b to their dollar reserves – a record for this group. That kept the dollar’s share of their reserves roughly constant even as the dollar slid against the euro, increasing the dollar value of their existing euro and pound reserves.
Fifth, central banks that report data on the currency composition of their reserves to the IMF also bought over $100b in non-dollar assets. If one assumes that they generally intervene by buying dollars (for their own currency), that means that they were constantly selling dollars. But they weren’t actually diversifying. They consistently kept far more dollars than they sold, maintaining the dollar’s overall share of their total reserves.
Let’s look specifically at the data for q4 2006. Both dollar and non-dollar reserve growth spiked up in q4 2006. Emerging economies that report the currency composition of their reserves to the IMF added $64b to their dollar reserves, and $37b to their non-dollar reserves (this data has been adjusted for valuation, it is measure of the “flows”). The dollar’s share of the reserves of those emerging economies that report to the IMF fell slightly, going from 60.35% at the end of q3 to 59.7%
To me, the most important data point is the $64b in dollar reserve growth from those emerging economies who report data to the IMF. $64b is the second highest quarterly total for this group of countries, topped only by the $67b in q4 2004. It was enough to finance roughly a third of the United States current account deficit in q4.
Those who interpret the slight fall in dollar’s share of emerging market – and total – reserves as evidence that central banks are reducing their dollar holdings haven’t looked closely enough at the details of the data. A fall in the dollar’s share doesn’t imply any reduction in dollar holdings so long as reserves are growing rapidly. Total dollar holdings increased very, very rapidly in q4 – just not quite rapidly enough to keep the dollar’s share of total reserves constant, especially given the large increase in the dollar value of existing euro and pound reserves.
I believe that emerging economies that don’t report added $117b to their reserves -- that total includes SAMA’s reported foreign asset growth and an estimated $15b in Chinese bank swaps in q4 so it is a bit higher than the total in the COFER data. If one assumes that a fairly large share of that flow – a flow which comes primarily from China and a set of oil exporting economies that manage their economies against the dollar – went into dollar assets, emerging economies potentially financed an exceptionally large share of the US deficit in q4 2006.
The COFER data, though, can also support a “diversification” story. Non-dollar flows were strong for one thing. And the dollar reserve growth, while large, wasn’t quite enough to keep the dollar share of these countries’ reserves constant. If those emerging economies that report data had wanted to maintain a 60.35% dollar portfolio share, they would have needed to have bought added about $79b to their dollar holdings, not $64 -- and correspondingly reduced the non-dollar purchases to around $22b.
However, the dollar share of these countries that report detailed reserve data to the IMF has bounced around a bit. It was as low as 59% in q1 and q2 2005 – and q4 isn’t that different from q2. I would want to see a bit more of a trend before arguing that a new era of diversification has started.
We can do a bit more with the data as well.
Russia almost certainly reports data on the currency composition of its reserves to the IMF. It also reported that it added $31b to its foreign exchange reserves on a flow basis in the fourth quarter. So Russia accounts for a little under a third of the total flows from reporting emerging economies.
Russia clearly diversified its reserves over the course of 2006. Indeed, Russia has reported that it brought the dollar share of its reserves down to around 50% (49%) by the end of the third quarter.
Suppose Russia maintained a constant 50/50 dollar/ non-dollar split during the fourth quarter. It would have needed to have added $18b to its dollar reserves, and $13b to its non-dollar reserves. The dollar slid in value, so its dollar reserve needed to be ‘topped up” out of the flow. That implies $46b in dollar reserve growth for other reporting emerging economies, and $24b in non-dollar reserve growth –
Suppose instead that Russia wanted to lower the dollar share of its reserves from 50% to 45%. In that scenario, it would have added $4b to its dollar reserves and $27b to its non-dollar reserves. Other emerging economies would have added $60b to their dollars, and $10b to their non-dollar reserves. In effect, other emerging market central banks would have facilitated Russia’s diversification by increasing their own dollar holdings to offset Russia’s sales (and the resulting dollar weakness).
I cannot yet be sure which of these two things happened.
But there is a puzzle in the data for 2006: Russia’s diversification doesn’t seem to have had much of an impact on the aggregate dollar share of the portfolio of reporting emerging economies.
And we know Russia diversified over the course of 2006. We actually now know that it more or less had completed the bulk of its diversification by the end of June 2006. The dollar share of its reserves was around 50% then. There is no shortage of supporting evidence either -- the large valuation gains Russia reported in q4 2006 are consistent with a low dollar reserve share. The US data shows a sharp fall in Russia’s holdings of US assets in q1 2006.
Indeed, based on the US data (along with data on the valuation gains on Russia’s reserve portfolio reported by the Bank of Russia), it seems unlikely that Russia started diversifying in a big way before the beginning of 2006, and it is pretty clear that it had large completed that diversification by the end of June. The dollar’s share of reporting emerging markets also slid a bit during this period – but not by as much as one might have expected. The same is even more true for data for the year.
Suppose Russia’s dollar share fell from 70% at the end of 2005 to 50% by the end of 2006. This is a hypothesis, not a fact. My favorite data source – the US portfolio survey – suggests that the basic path is right. Russia’s reported “onshore” US dollar holdings were 68% of Russia’s reserves at the end of q2 2004, 66% of Russia’s reserves in q2 2005 and only 48% of Russia’s reserves at the end of q2 2006. Russia presumably has a few offshore dollar deposits as well. That data thought doesn’t tell us whether Russia started to diversify at the end of 2005 or waited until 2006. However the higher frequency US TIC data shows a steady rise in Russian short-term claims on the US through December 2005 and then a sharp fall. That fits the basic story pretty well – but this is an art as much as a science.
But let’s assume that the basic scenario is right. To bring the dollar share of its portfolio down from 70% to 50%, Russia would have added about $25b to its dollar holdings in 2006 and $83b to its non-dollar holdings. If Russia does report to the IMF – as I think is the case -- other reporting emerging economies necessarily added $197b to their dollar reserves, and only $32b to their non-dollar reserves.
That is kind of stunning. So stunning that it calls into question my proposed diversification path. Russia may have had slightly less than 70% of its reserves in dollars at the end of 2005.
But Russia clearly reduced its dollar share over the course of 2006. Consequently, the fact that the dollar share of those emerging economies that do report to the IMF didn’t fall even as Russia’s dollar share fell implies fairly rapid growth in dollar reserves elsewhere.
Maybe Brazil offset Russia. Most of Brazil’s reserves are in dollars, and Brazil’s reserve growth really picked up over the course of 2006.
But Brazil alone cannot explain the overall data. Moreover, Brazil’s reserve growth was concentrated in the second half of the year, and Russia’s initial diversification came in the first half of the year. My best guess is that some oil exporters – perhaps African oil exporters – report data to the IMF and hold a lot of their reserves in dollars. Oil shot up in the first part of 2006, and so did reserve growth in almost all the oil exporters.
I’ll put it another way. Either I am reading the COFER data wrong or some other emerging economy added an awful lot of dollars to their portfolio in 2006, offsetting Russia’s diversification.
And since we are not getting close to the end of June, I should soon have COFER data for q1 as well. I can hardly wait (seriously). The COFER data should tell us a lot about the global flow of funds in the first quarter.