 Online Store
Introduction
Over the last several decades, governments have collectively pledged to slow global warming. But despite intensified diplomacy, the world is already facing the consequences of climate…

Secrets from the Treasury’s Survey: It looks like China bought a lot of equities just before the stock market tumbled
More on:
Late on Friday, the US Treasury released the preliminary results of its annual survey of foreign portfolio investment in the US. That always makes for an interesting weekend.
The survey offers the best picture of the impact large central banks and sovereign funds have had on global financial markets. It just comes out with a long lag. And as I will argue later, it is, for all its virtues, it still paints an incomplete picture of the activities of official investors.
But it still reveals a few secrets, not the least about China.
It turns out that China bought significantly fewer Treasuries from the middle of 2007 to the middle of 2008 than I had projected – and a lot more equities. China also was – as expected – a very large buyer of Agencies (particularly mortgage backed securities with an Agency guarantee, often called "Agency pass-throughs”) from mid-2007 to mid-2008.
China consequently entered the “Lehman” crisis with a somewhat riskier portfolio than I thought. The bulk of China’s portfolio, to be sure, was in Treasuries, Agencies and comparable European bonds. But it now looks like well over 10% of SAFE’s portfolio was invested in "risk" assets of various kinds -- equities and corporate bonds.
That likely explains why China reversed course and fled to safety this fall. China got burned. SAFE (not-so-SAFE?) especially.
The survey data indicates that China had $521.91 billion of long-term Treasuries at the end of June 2008 (up $53.4 billion from June 2007) and $527.05 billion of long-term Agencies at the end of June 2008 (up $150.73 b from June 2007). China consequently entered into the crisis with more exposure to the Agencies than to the Treasury.
My estimates for China’s Agency portfolio weren’t far off. In the summer of 2008, I argued China’s Agency holdings topped $500b. As Arpana Pandey and I suspected, China was buying more Agencies than showed up in the monthly TIC data. However, our estimates over-stated China’s Treasury purchases. The June 2007 survey re-attributed about 60% of the UK’s Treasury purchases to China. The June 2008 survey only re-attributed about 15% of the UK’s Treasury purchases to China.
The survey indicates China held $26.3b of US corporate bonds at the end of June 2008, down $1.3b from June 2007. Throw that number out. The TIC data indicates that China bought about $45b of corporate bonds from June 2007 to June 2008. There is a reasonable explanation for the discrepancy: China isn’t using a US custodian for its corporate bonds. And it hasn’t been using a US custodian since June 2006. Since June 2006, the survey data suggests that China has sold about $32b of long-term corporate bonds while the monthly TIC data implies about $77b of purchases …
Finally, the survey indicates that China held $99.5b of US equities at the end of June 2008, up over $70b from the end of June 2007.
That confirms a rumor I heard in the spring of 2008: China (and specifically SAFE) was a large, visible buyer of US equities. The rise in China’s equity holdings from June 07 to June 08 cannot be explained by valuation gains on China’s $30b (end-June 07) portfolio. It was new purchases.
Nor is it a direct result of the formation of the CIC. The CIC bought $3b of Blackstone (bad call; Blackstone is now down 88%) and $5b of Morgan Stanley. But that is only about $8b in total purchases. $8b isn’t $70 billion. And the CIC is now bragging that its external portfolio was mostly in cash – as it didn’t invest most of the $90 billion or so of foreign exchange that it bought off SAFE (I am setting aside the CIC’s domestic equity portfolio). Moreover, it is hard to square the CIC’s reported returns with large investments in global equities.
The big jump in China’s equity holdings in the survey therefore likely implies that SAFE bought a lot of equities from mid-2007 to mid-2008. SAFE wanted to show that it could manage a portfolio of “risk” assets, and thus there was no need to hand over more funds to the CIC. If SAFE had $80-90b of US equities in June 2008, it easily could have had about $150 billion of global equities then …
SAFE may have gotten authorization to have put more than 5% of its portfolio in equities. Given the size of SAFE’s portfolio, that meant that SAFE was one of the largest sovereign investors in US equities even thought it wasn’t formally a sovereign wealth fund. Only ADIA obviously has larger holdings of US equities.
And, well, it is quite likely that China’s $90b of equities aren’t still worth $90 billion now. In aggregate, SAFE likely took larger mark-to-market losses on its equity portfolio than the CIC took on Blackstone and Morgan Stanley.
I suspect that SAFE is still carrying its equity portfolio on its books at their purchase prices, which implies that it is sitting on a quite large loss. But I don’t have total confidence on this. SAFE supposedly reports the book not the market value of its bond portfolio, but I am not sure how it accounts for its equities. It is possible that the rise in the value of SAFE’s Treasuries helped offset the fall in the value of SAFE’s equities.
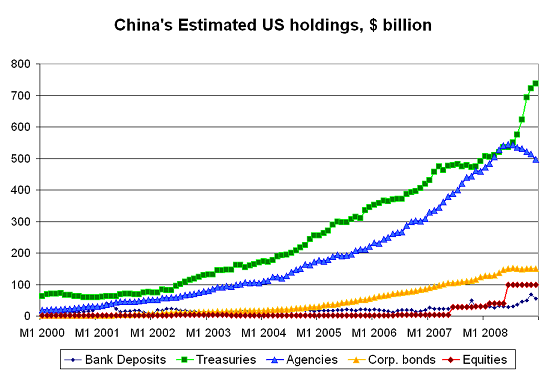
The attached chart shows the evolution of China’s portfolio over time. I have used my adjusted data series for the Treasury and agency holdings. The adjustment smooths the increase in China’s Treasury and Agency holdings associated with the survey over the course of the year so there isn’t a jump when the survey comes out. I used the sum of flows rather that the survey data to estimate China’s holdings of corporate bonds. But I haven’t smoothed China’s equity purchases (that is a project for next week … ). The “Survey” jump stands out.
The survey also tells us something about total official purchases. Official holdings of Treasuries -- as expected – jumped by about $160.4b as a result of the revisions, while the UK’s holdings were revised down by $224b. Official holdings of Agencies were also revised up, with offsetting falls in the holdings of Hong Kong and the UK.
Three points here:
-- China’s holdings of Treasuries were revised up by a comparatively modest $32b. China consequently accounted for a relatively small share of the downward revision in the UK’s holdings. The survey also reduced the Gulf’s Treasury holdings. The Treasury portfolio of Russia was revised up by $30b or so. That is the Bank of Russia. India was revised up by $10b or so. That is the Reserve Bank of India. Japanese Treasury holdings also got revised up by close to $50b, but it isn’t clear if that is the MoF or Japanese carry traders.
-- The upward revision in the official sector’s Treasury holdings was smaller than the downward revision in the UK’s holdings – or, to put it a bit differently, the survey shows an increase in private holdings of Treasuries abroad ($675b at the end of June 08 v $579b in June 07). That is quite different from 2006 and 2007. In both 2006 and 2007, official investors accounted for all the increase in the stock of Treasuries held abroad. In 2007, for example, the UK’s holdings fell $142b and official holdings rose $170b. My models, which assumed a similar pattern of revisions, consequently overestimated official purchases of Treasuries from mid-2007 to mid-2008.
-- I don’t believe that there were quite as many private purchases as implied by the TIC data either. Some private holdings are likely an indirect reflection of central bank demand. I suspect that some oil exporters do not manage their entire Treasury portfolio in house. Here is one hint. The last survey that showed a lot of “private” purchases of Treasuries by foreign investors was the June 2005 survey. And during the period from June 2004 to June 2005 oil prices surged unexpectedly, delivering a large windfall to a host of oil-exporting economies. The period from June 2007 to June 2008 was also marked by an unexpected surge in oil prices. I cannot prove this, but I suspect that some of the “private” purchases of Treasuries by foreign investors implied by the June 2008 survey are an indirect reflection of the rise in the reserves of a host of oil exporting economies (Saudi Arabia, Algeria, etc)
Indeed, there is a broader puzzle in the survey data. It doesn’t seem to be capturing as high a fraction of official flows as it did in 2006 or 2007.
Some data. I apologize, but it is important for the argument. And I haven’t had time to put it into a simple graph.
From mid 2005 to mid 2006, the survey showed a $308 billion increase in official holdings of long-term bonds. The COFER data (adjusted for SAMA’s non-reserve foreign assets and the PBoC’s other foreign assets) suggests a $686b (valuation-adjusted) increase in the world’s reserves over this period. About 45% of the increase in reserves showed up in the survey.
From mid 2006 to mid 2007, the survey showed a $517 billion increase in official holdings of long-term bonds. The adjusted COFER data suggests a $1141b (valuation-adjusted) increase in the world’s reserves over this period. Again, about 45% of the increase in reserves showed up in the survey.
From mid 2007 to mid 2008, the survey showed a $449 billion increase in official holdings of long-term bonds. The adjusted COFER data suggests a $1328b (valuation-adjusted) increase in the world’s reserves over this period. About 34% of the increase in reserves showed up in the survey. (The ratio of the survey to reserve growth from mid-04 to mid 05 was 34%).
Throw in the growth in the foreign assets of the world’s sovereign funds during this period and there is a gap of over $1 trillion dollars between the growth in the world’s official assets from mid-June 2007 to mid-June 2008 and the increase in official assets in the US survey. That is a large gap.
Or to put it a bit differently, my efforts to follow the growth in sovereign money hit a dead-end in the latest survey data.
So what might be going on?
Part of the story is that some central banks, notably SAFE, bought more equities. And part of the story may well be that those central banks were diversifying out of the dollar into other currencies, whether pounds, Australian dollars or euros (another bet that hasn’t paid off in the crisis).
But even if China’s equity purchases are factored in, the increase in China’s holdings in the survey is far smaller than one would expect based on the growth in China’s foreign assets. China’s long-term holdings rose by $276b in the survey. Its short-term holdings (including bank deposits) rose by $10.5b. The roughly $286-287b rise is still small relative to China’s $726b in (estimated) foreign asset growth over this period. And that $726b estimate isn’t subject to much doubt. We know that the China’s reserves and the PBoC’s other foreign assets rose by $681b over this period, and this is also the period when funds were shifted over to the CIC.
Even if China’s $45 b for corporate debt purchases are added to the total, implied China’s purchases are in the $330-335b range – or only about 45% of the estimated growth in the foreign assets of China’s government. That either implies a lot of diversification away from the dollar from June 2007 to June 2008 – or it implies that the survey isn’t picking up all of China’s holdings.
I would bet on a bit of both. The period from June 2007 to June 2008 was marked by huge institutional changes in the way China manages its foreign assets. The state banks dollar reserve requirement (and the associated rise in China’s other foreign assets) and the formation of the CIC meant that around $300b of the total increase in China’s foreign assets didn’t come from the increase in the PBoC’s formal reserves. A plot showing the 12m change in China’s holdings (using my adjusted Treasury and Agency data, with the data updated to reflect the results of the last survey) suggests that recorded purchases have tracked the growth in China’s formal reserves more closely than the growth in China’s total foreign assets.

This is just a hunch though.
And well the same basic story applies to the Gulf and the oil exporters.
Here is one way of looking at it.
The Saudis held $354.4b of foreign securities as part of SAMA’s non-reserve foreign assets at the end of June 2008 (I am leaving out the SAMA’s $60b reported non-reserve foreign deposits and its $28b in formal reserves). Other GCC central banks reported an additional $101b in reserves – for a total of $455b of foreign assets. The survey shows the gulf held $204b of US Treasuries and Agencies ($139.6b of Treasuries and $64.6b of Agencies). That seems low for a region that pegs to the dollar – especially as the region’s central banks are widely thought to have a high dollar share of their reserves.
Just compare the Gulf central banks to Russia’s central bank. Russia’s central bank has about 45% of its reserves in dollars (see Danske bank; the stabilization funds has a lower dollar share than the rest of Russia’s reserves but the central bank manages the whole lot). It has said as much. Russia had $554.1b of reserves at the end of June 2008 (the world has changed since then!), with $359b in securities, $100.6 in deposits and $94.5b in reverse repos. This is all disclosed on the IMF’s web site. The survey shows $222.6b in Russian holdings of US debt, with $95.1b in Treasuries and $127.2b in Agencies. It all more or less lines up, unlike the data on the Gulf. $222b is a little under 50% of Russia’s securities and reverse repos.
The December TIC data incidentally suggests that Russia now holds very few Agencies. It has redeemed almost all of its $65.1b of short-term Agencies (at the end of June), and it likely sold some of its $62b in long-term Agency bonds as well. Unlike China, Russia held the bonds the Agencies issued to finance their retained portfolio, not pass-throughs.
This is a lot of detail for a blog post, especially a weekend blog post.
The big picture is relatively simple:
From mid-2007 to mid 2008, the survey shows a large increase in the assets of official investors -- but not as large as the increase from mid-2006 to mid-2007. That is somewhat surprising, since we know that inflows into central banks and sovereign funds increased in late 2007 and the first part of 2008. Consequently, the increase in the assets of official investors in the survey seems small relative to the growth in their foreign portfolio. By implication, there is a huge gap between estimated inflows into central banks and sovereign funds (and this estimate if quite robust) and the growth in official holdings of US assets. That gap is around $1 trillion.
We also know that from mid-2007 to mid-2008, China and the oil exporters account for most of the overall growth in official assets. They generally aren’t very transparent. They don’t report the currency composition of their reserves to the IMF for example. So it is possible that a shift in the currency composition of their reserves (one not echoed in the data from the countries that do report data to the IMF) away from the dollar explains the relatively small share of the total increase in their assets that show up in the survey.
Such a shift would also be consistent with a general shift toward riskier assets on the part of central banks. China at least continued to increase its risk profile after the August 2007 subprime crisis. It then reversed course in a big way after Lehman. SAFE could have gotten authorization to take more currency risk as well as more equity market risk. At the end of June 2008, less than 60% of China’s total foreign holdings (counting the PBoC’s other foreign assets, the CIC and the state banks) shows up in the US data.
But the comparatively small increase in official assets in the survey is also consistent with a world where the survey doesn’t pick up all of China’s holdings. Over the past several years, China has started to manage its foreign assets a bit more like the Gulf -- and a large chunk of the Gulf’s assets don’t show up in the survey. The fall in China’s dollar share consequently may reflect the difficulties capturing all of China’s activities as more of China’s foreign assets were being held outside of SAFE’s formal reserves. We just don’t know.
And I am quite sure that the surge in China’s recorded holdings since June -- along with the surge in its Treasury holdings -- reflects a decision to reverse course and take less risk in China’s reserve portfolio.

SAFE is acting more like a traditional reserve manager once again, and less like a sovereign wealth fund. The CIC’s isn’t growing. And the PBoC’s non-reserve foreign assets are falling …
More on: