 Online Store
International efforts, such as the Paris Agreement, aim to reduce greenhouse gas emissions. But experts say countries aren’t doing enough to limit dangerous global warming.

Still Struggling to Make Sense of the 2016 U.S. Trade Data
More on:
U.S. nominal goods exports, excluding petrol, fell by around 6 percent in the first half of 2016, relative to the first half of 2016 (source).
U.S. nominal goods imports, excluding petrol, fell by just under 3 percent in the first half of 2016, relative to the first half of 2015.
(Nominal petrol imports were down a lot in the first half of 2016, as the price of imported oil averaged $32-a-barrel in the first six months of 2016 relative to about $50-a-barrel in the first six months of 2015)
Some of the fall in goods trade stems from price changes. The fall in actual volumes shipped around the world is smaller.
Real goods exports are down between 2.5 and 3 percent year-over-year. This makes sense. The dollar is strong, and that has an impact. And it maps, roughly, to the port data.
Real goods imports, excluding petrol, though are also flat. Technically they are down around 0.25 percent year-over-year.
And that is much harder to explain.
U.S. demand growth is slow; total demand increased by about 1.5 percent year-over-year. But that should still generate some increase in import volumes. Historically, about 20 percent of the increase in demand shows up in imports—so one might expect a 30 basis point of GDP increase in real imports and growth in non-petrol imports volume of 2-3 percent, rather than nothing.
In the first half of 2015 for example domestic demand rose by about 3.5 percent and real imports rose by about 6 percent (70 basis points of GDP, annualized).
And even if the income elasticity of U.S. imports is now lower, perhaps about 1, positive demand growth should generate positive import growth.
The best explanation for weakness in imports is that imports are linked to investment more than consumption, and investment has been weak.
But that isn’t totally satisfactory either. Real imports of consumer goods are down about as much as real imports of capital goods: consumer goods imports are down 1.6 percent, while capital goods imports are down about 2 percent. (Autos are in a separate category, and auto imports are up about 2 percent).
Weakness in imports in turn is translating into other rather bizarre facts.
U.S. exports to China are down around 8 percent year-over-year in the first half of 2016. Not good.
But even with the fall in exports, the bilateral deficit with China shrank in the first half of 2016.
U.S. imports from China are down 7 percent year-over-year, and with goods imports about four times greater than goods exports the fall in imports dominates.*
Nor can the fall in imports be fully explained by price changes. The price of U.S. imports from China was down about 2 percent year-over-year. But that still means goods imports from China are down around 5 percent in real terms.
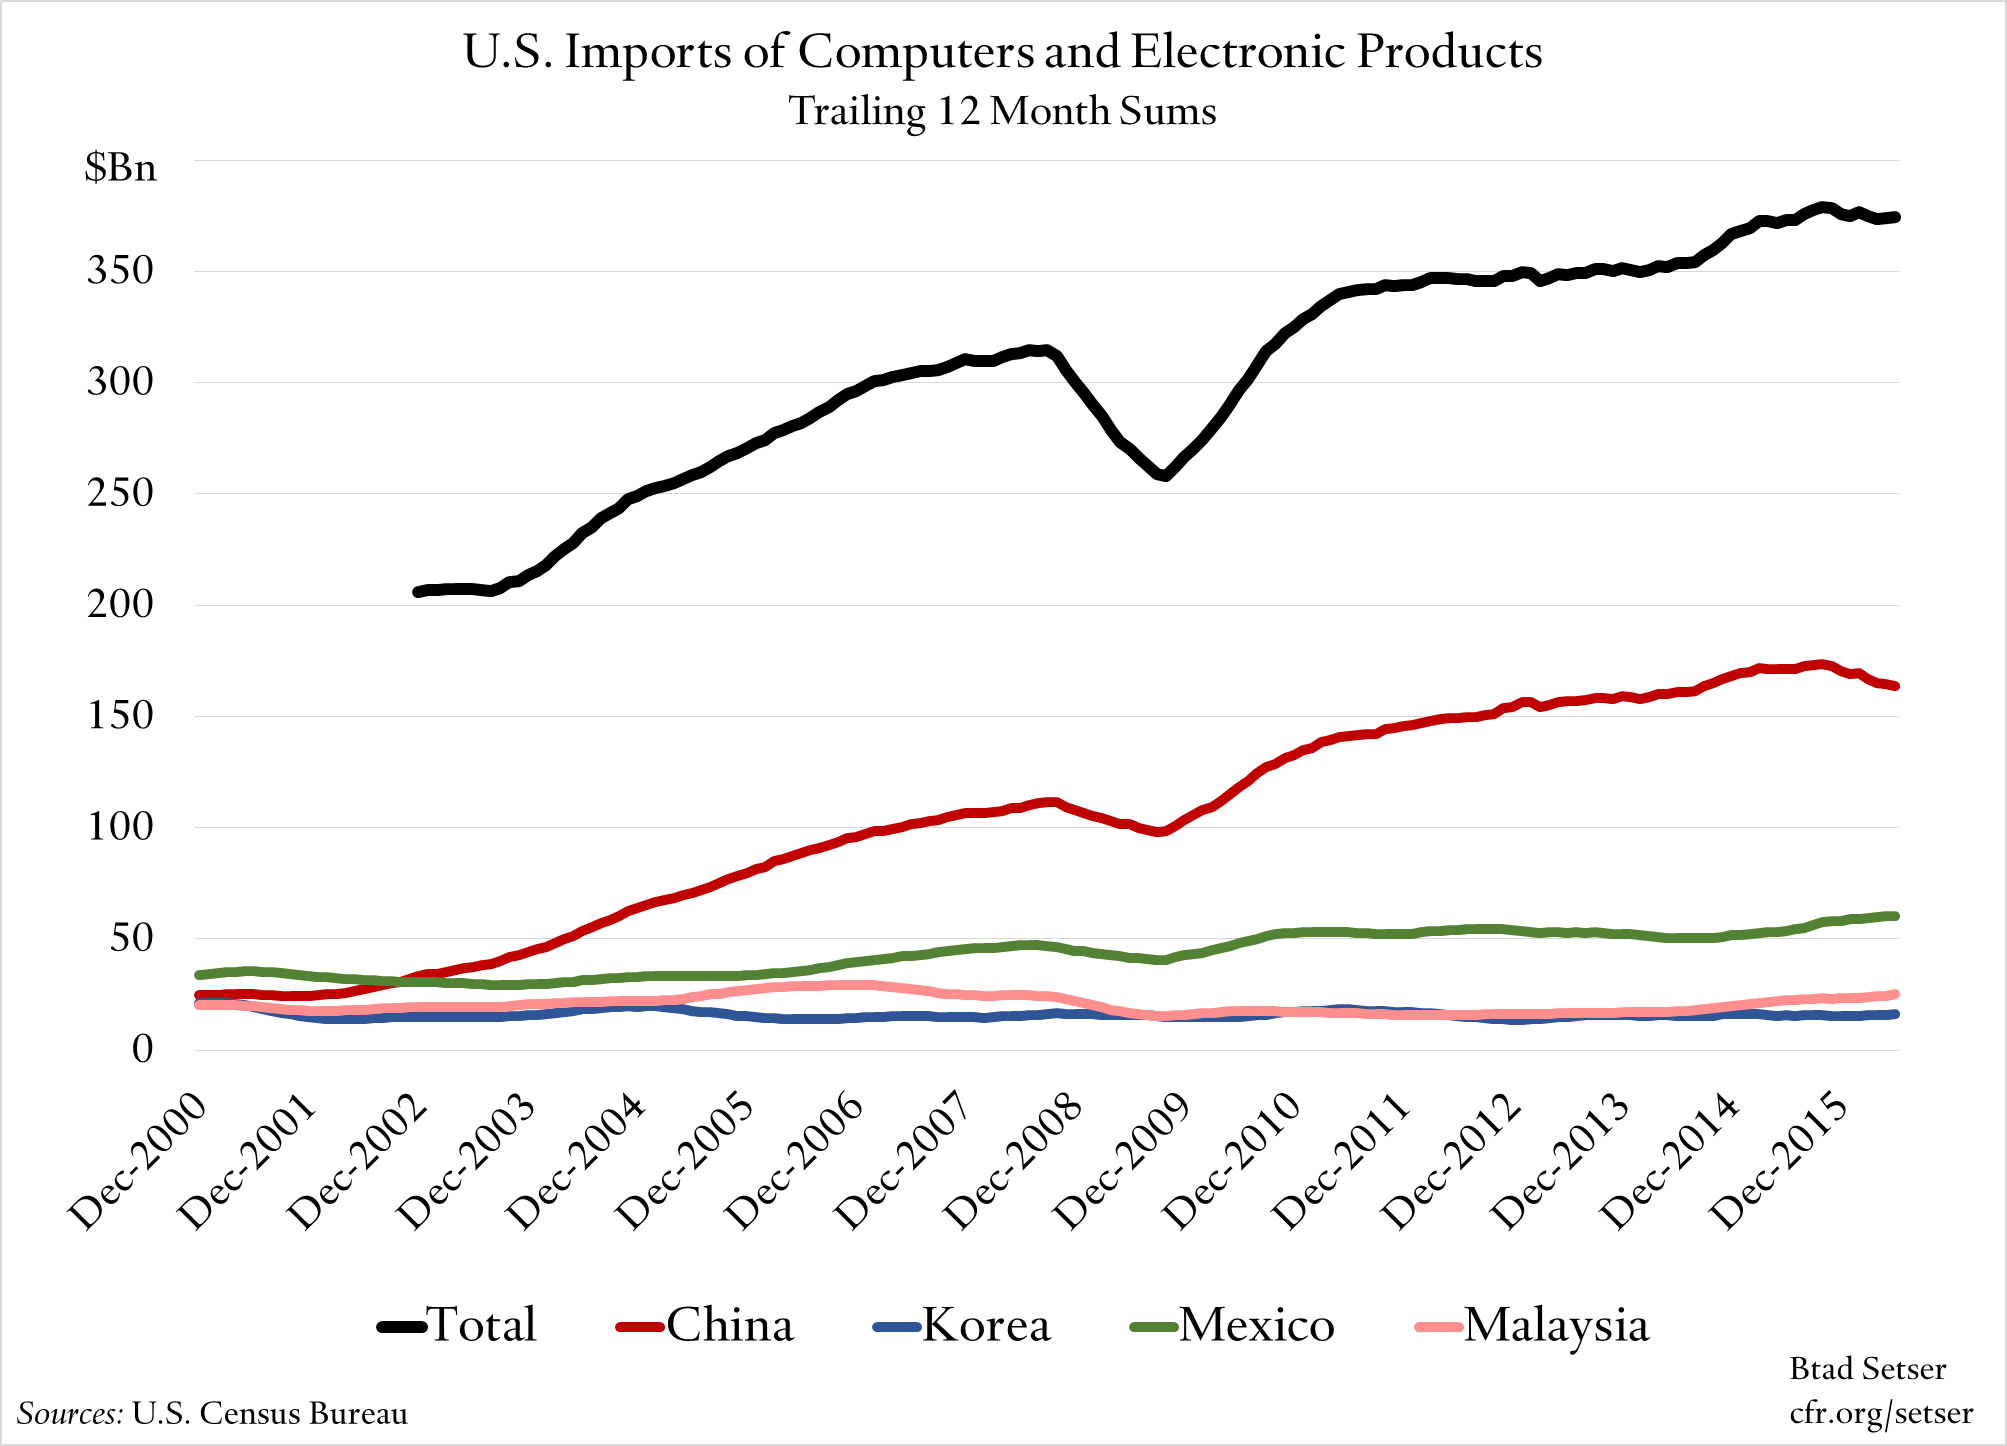
And I do not have a great story for that. Electronics imports from China are down, and electronics imports from Malaysia and Mexico are up. Maybe there is a story there (both the peso and ringgit depreciated in 2015 as oil fell), but maybe not.
All in all, I suspect that at some stage import growth will pick up, and, with the yuan down versus the dollar, that growth in imports from China will pick up. Exchange rate moves have an impact with a lag. The price of Chinese made goods is falling right now. Over time that tends to have an impact on volumes. But for now this is a forecast, not a fact. U.S. prices for finished goods are also down, but the U.S. data is likely more influenced by commodity prices than the series on the price of Chinese imports.
One last note: I am leaving services out because there isn’t much of a story on the nominal side (imports and exports are both flat, more or less) and there isn’t monthly “volume” data on the services side. Plus the monthly services data, setting tourism aside, is mostly an estimate with little real information content.
* The 4:1 ratio is a bit deceptive, and some U.S. goods exports to China register in the U.S. data as exports to Hong Kong. Combined imports from China and Hong Kong are about 3 times combined exports to China and Hong Kong. And of course some of the content of U.S. imports from China reflects components made elsewhere in Asia; on a value-added basis some of the U.S. bilateral deficit with China shifts to Korea, Taiwan, and Japan.
More on: