Expert TakeTrump’s Iran Deal Has Collapsed, Leaving the U.S. With Few Good OptionsJuly 13, 2026By Max Boot
MeetingA Conversation With Panama Canal Authority Deputy Administrator Ilya Espino de MarottaMay 11, 2026
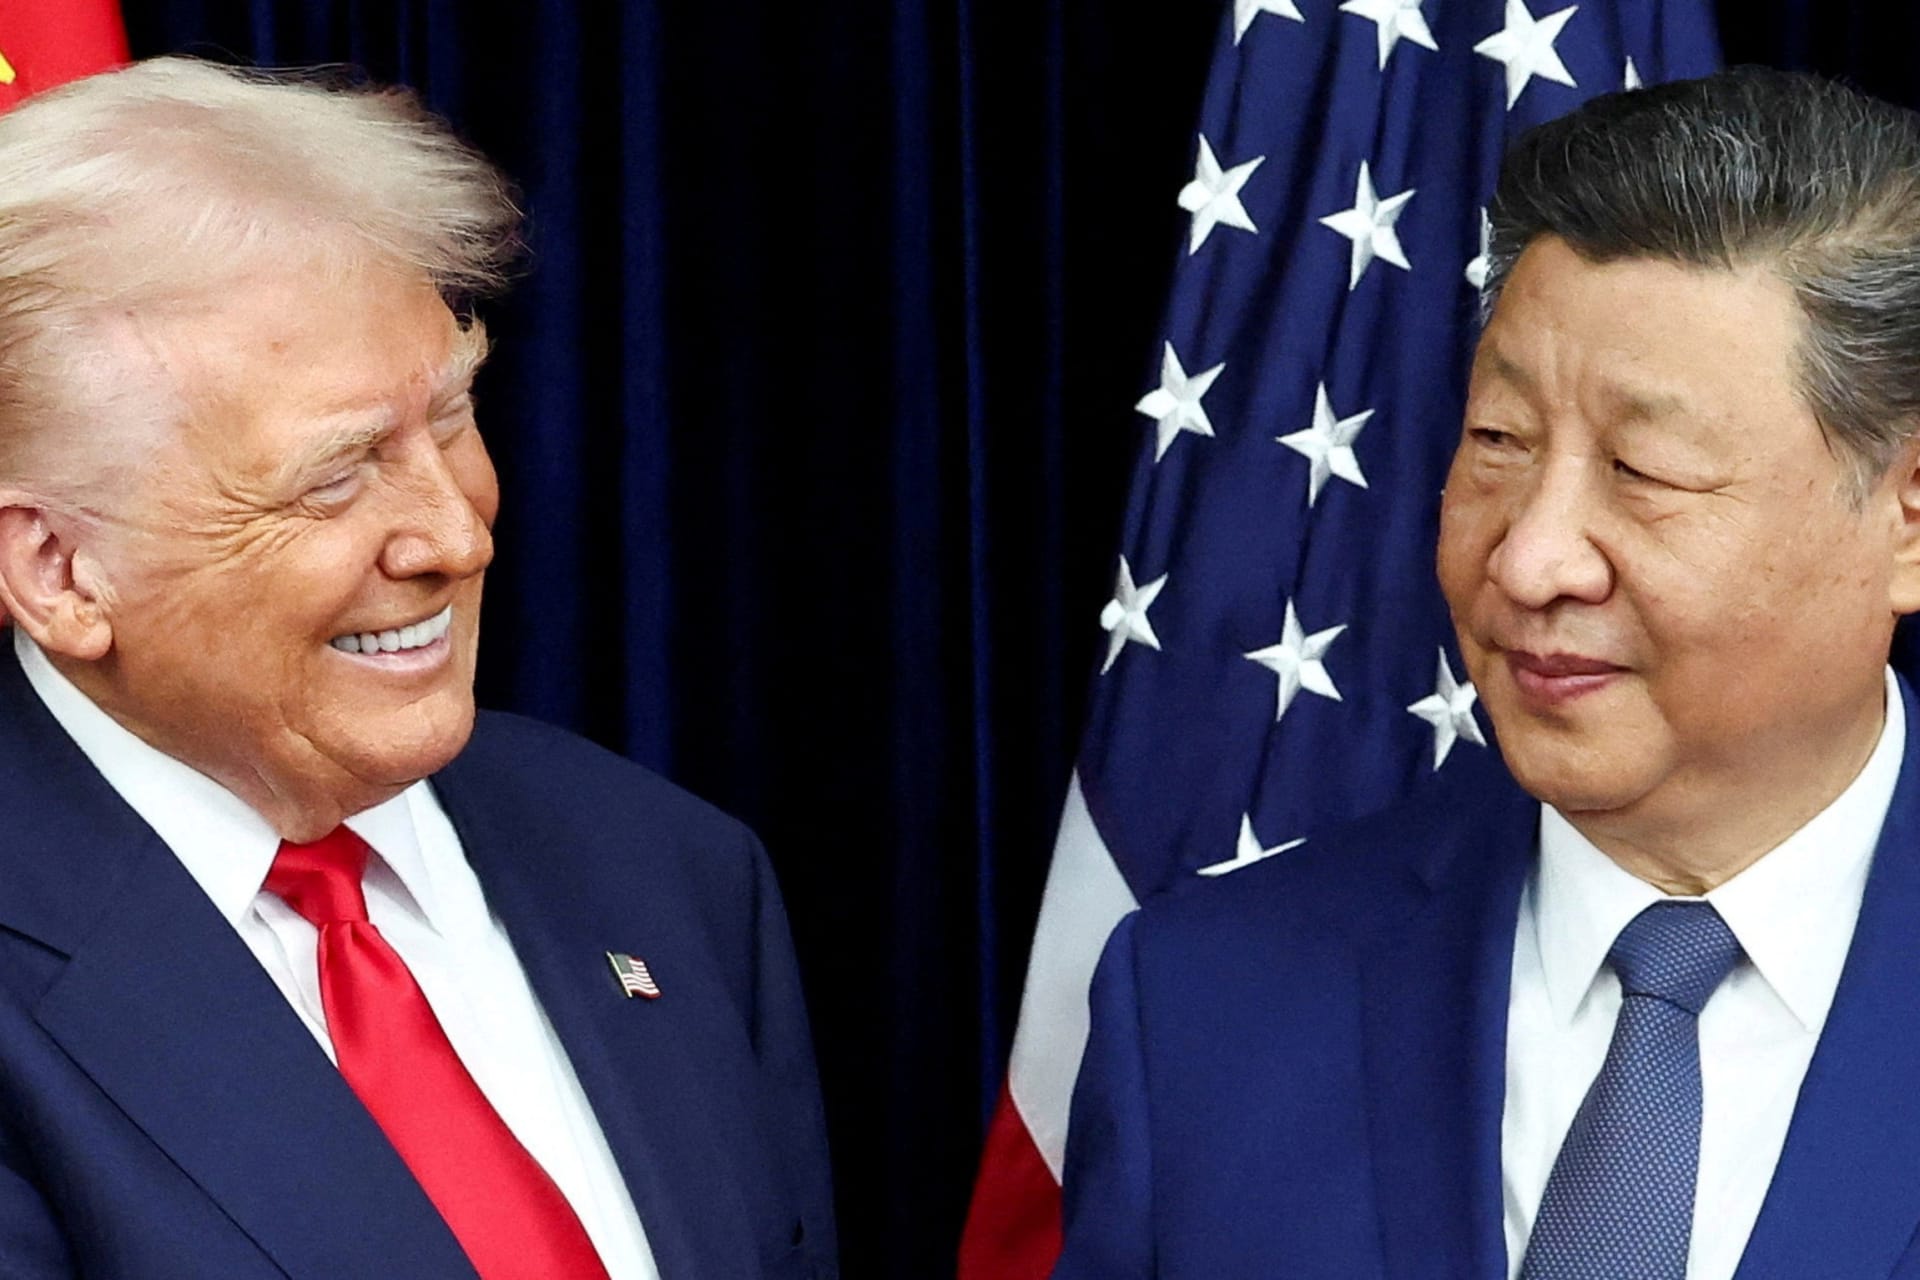
Expert TakeAt the Trump-Xi Summit, China Will Have the Upper HandMay 10, 2026By Rush Doshi, Chris McGuire, Heidi E. Crebo-Rediker, David Sacks and David M. Hart
Expert TakeAfter Hormuz, Southeast Asia Sees the Potential Value of Tolling the Strait of MalaccaMay 6, 2026By Joshua Kurlantzick
How Cross-Border Chinese RMB Flows May Weaken U.S. SanctionsMarch 6, 2026By Benn Steil and Yuma Schuster
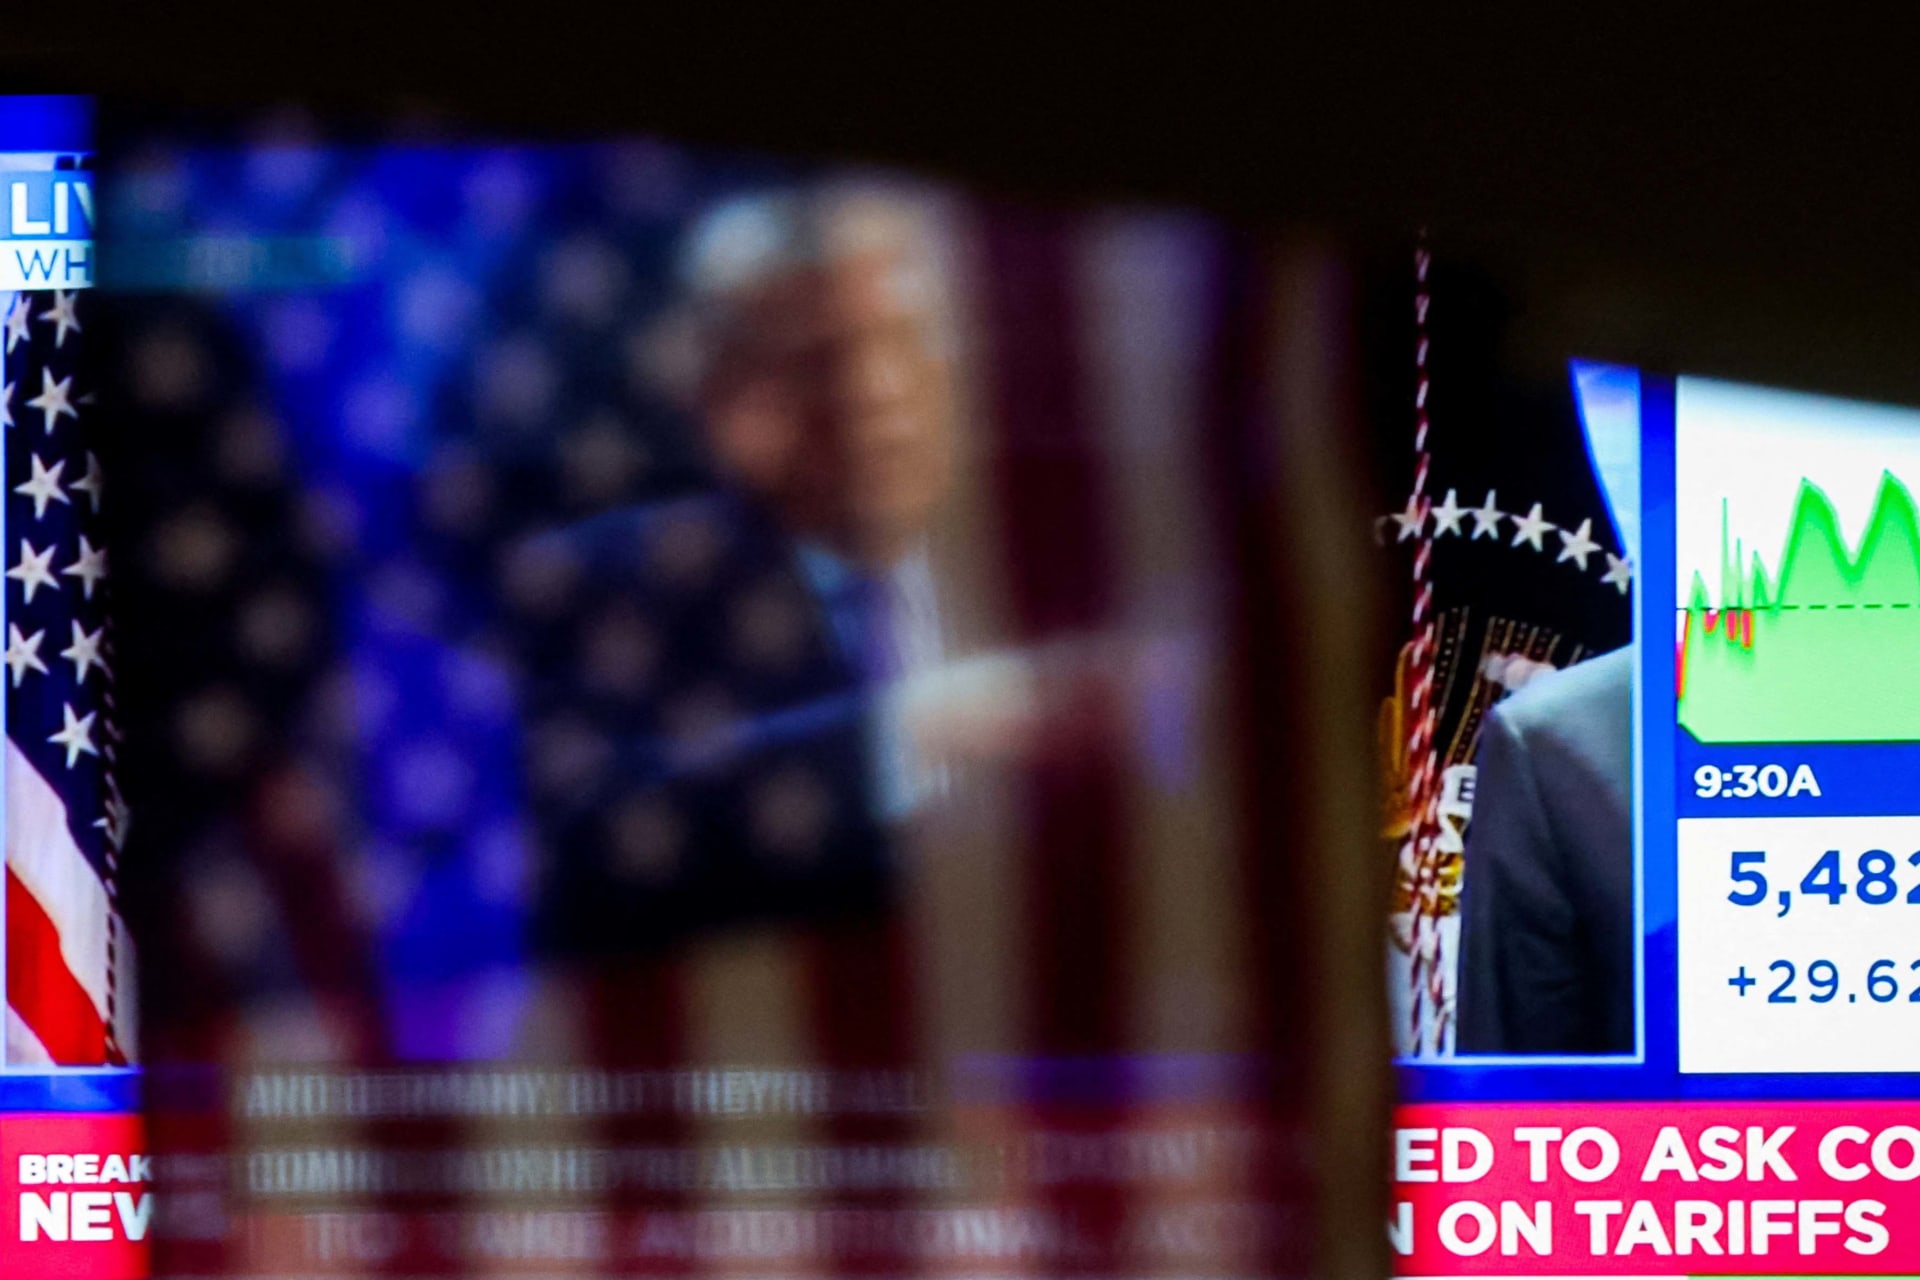
Expert TakeThe Supreme Court Clipped Trump’s Tariff Powers—and Opened New Trade BattlesFebruary 23, 2026By Jennifer Hillman
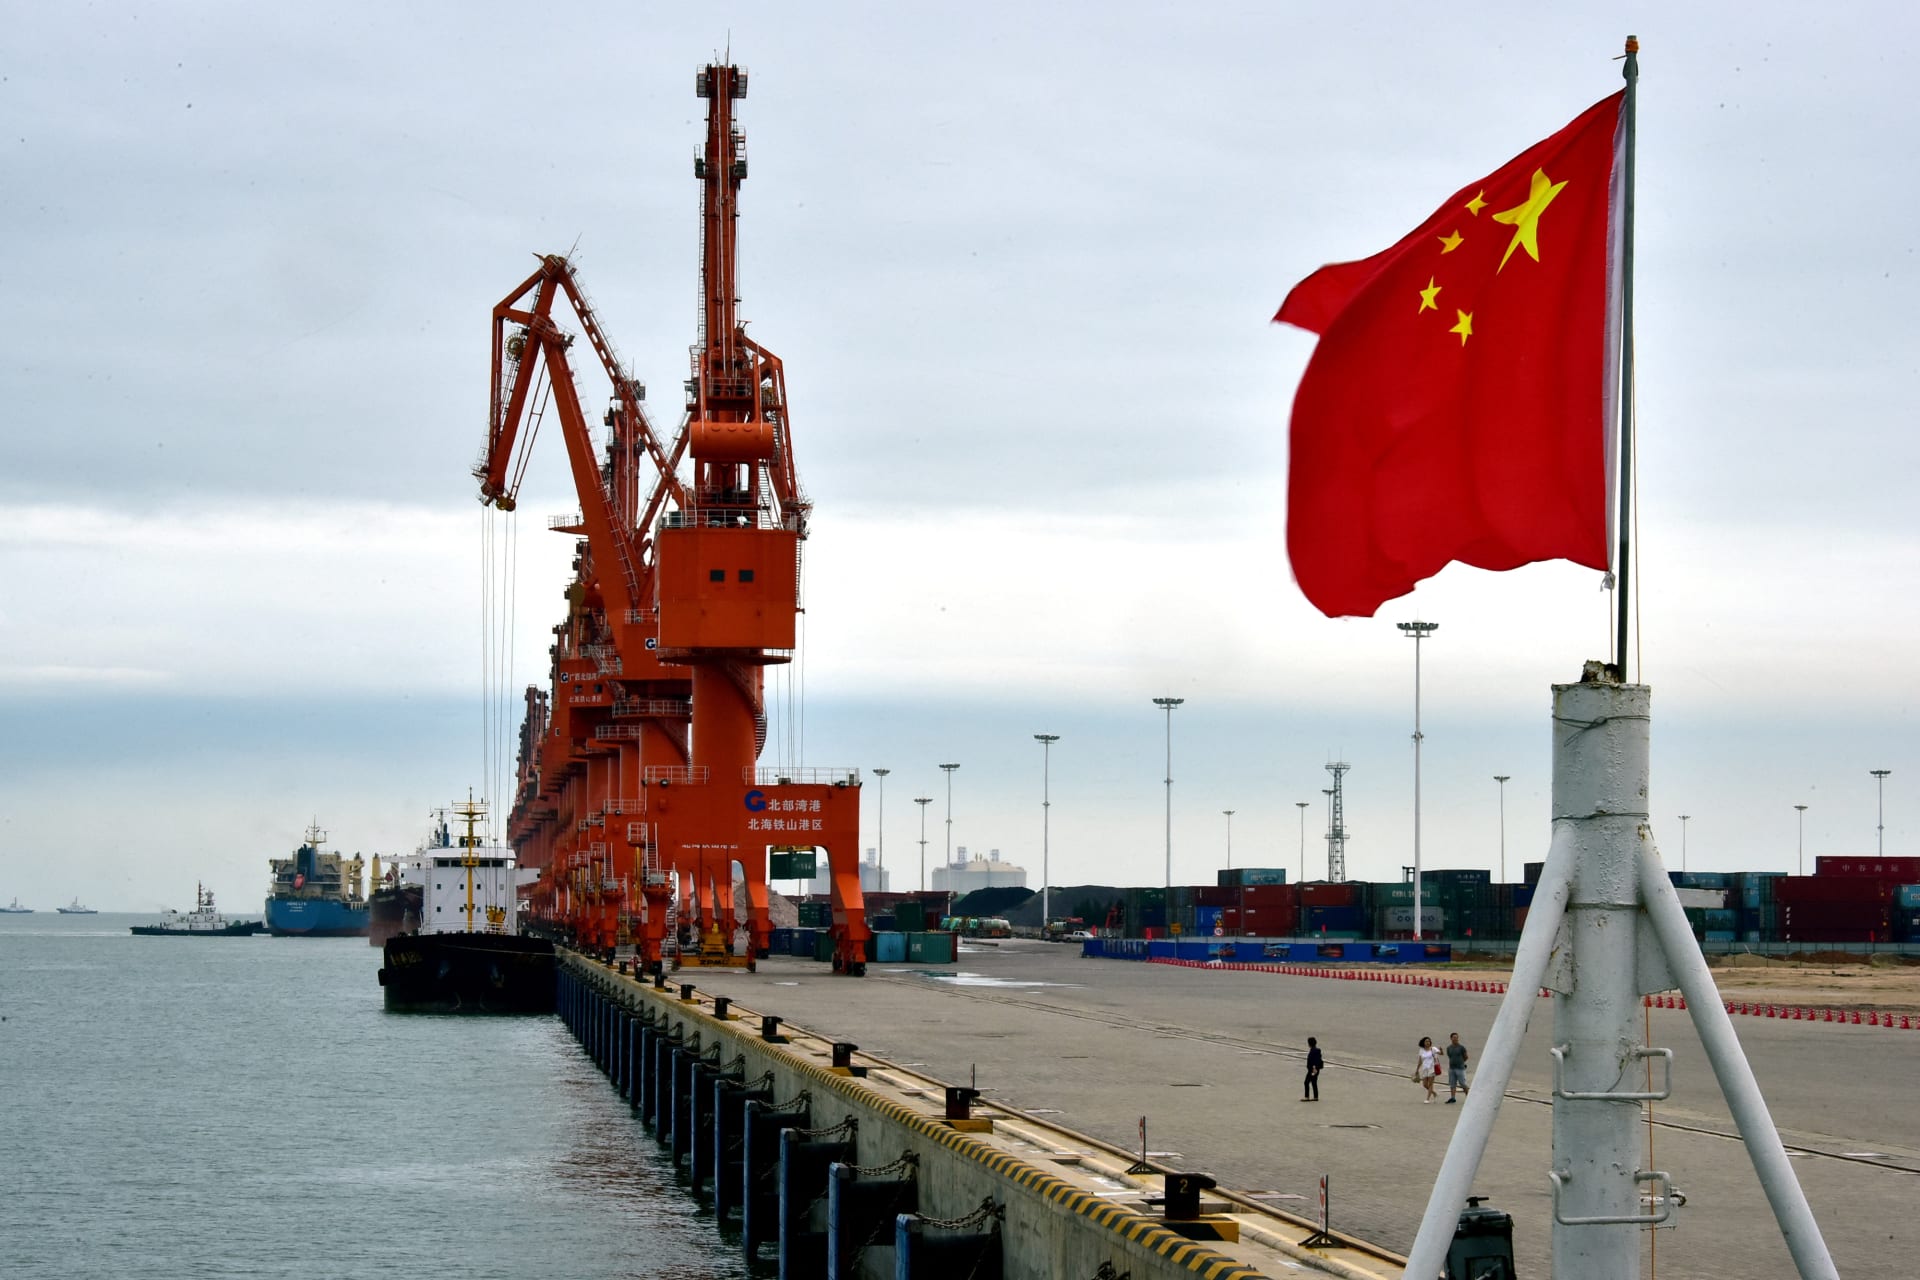
Expert TakeThe Supreme Court’s Tariff Decision Could Affect U.S.-China NegotiationsFebruary 23, 2026By Zongyuan Zoe Liu
 Expert Take
 Expert Take
 Expert Take
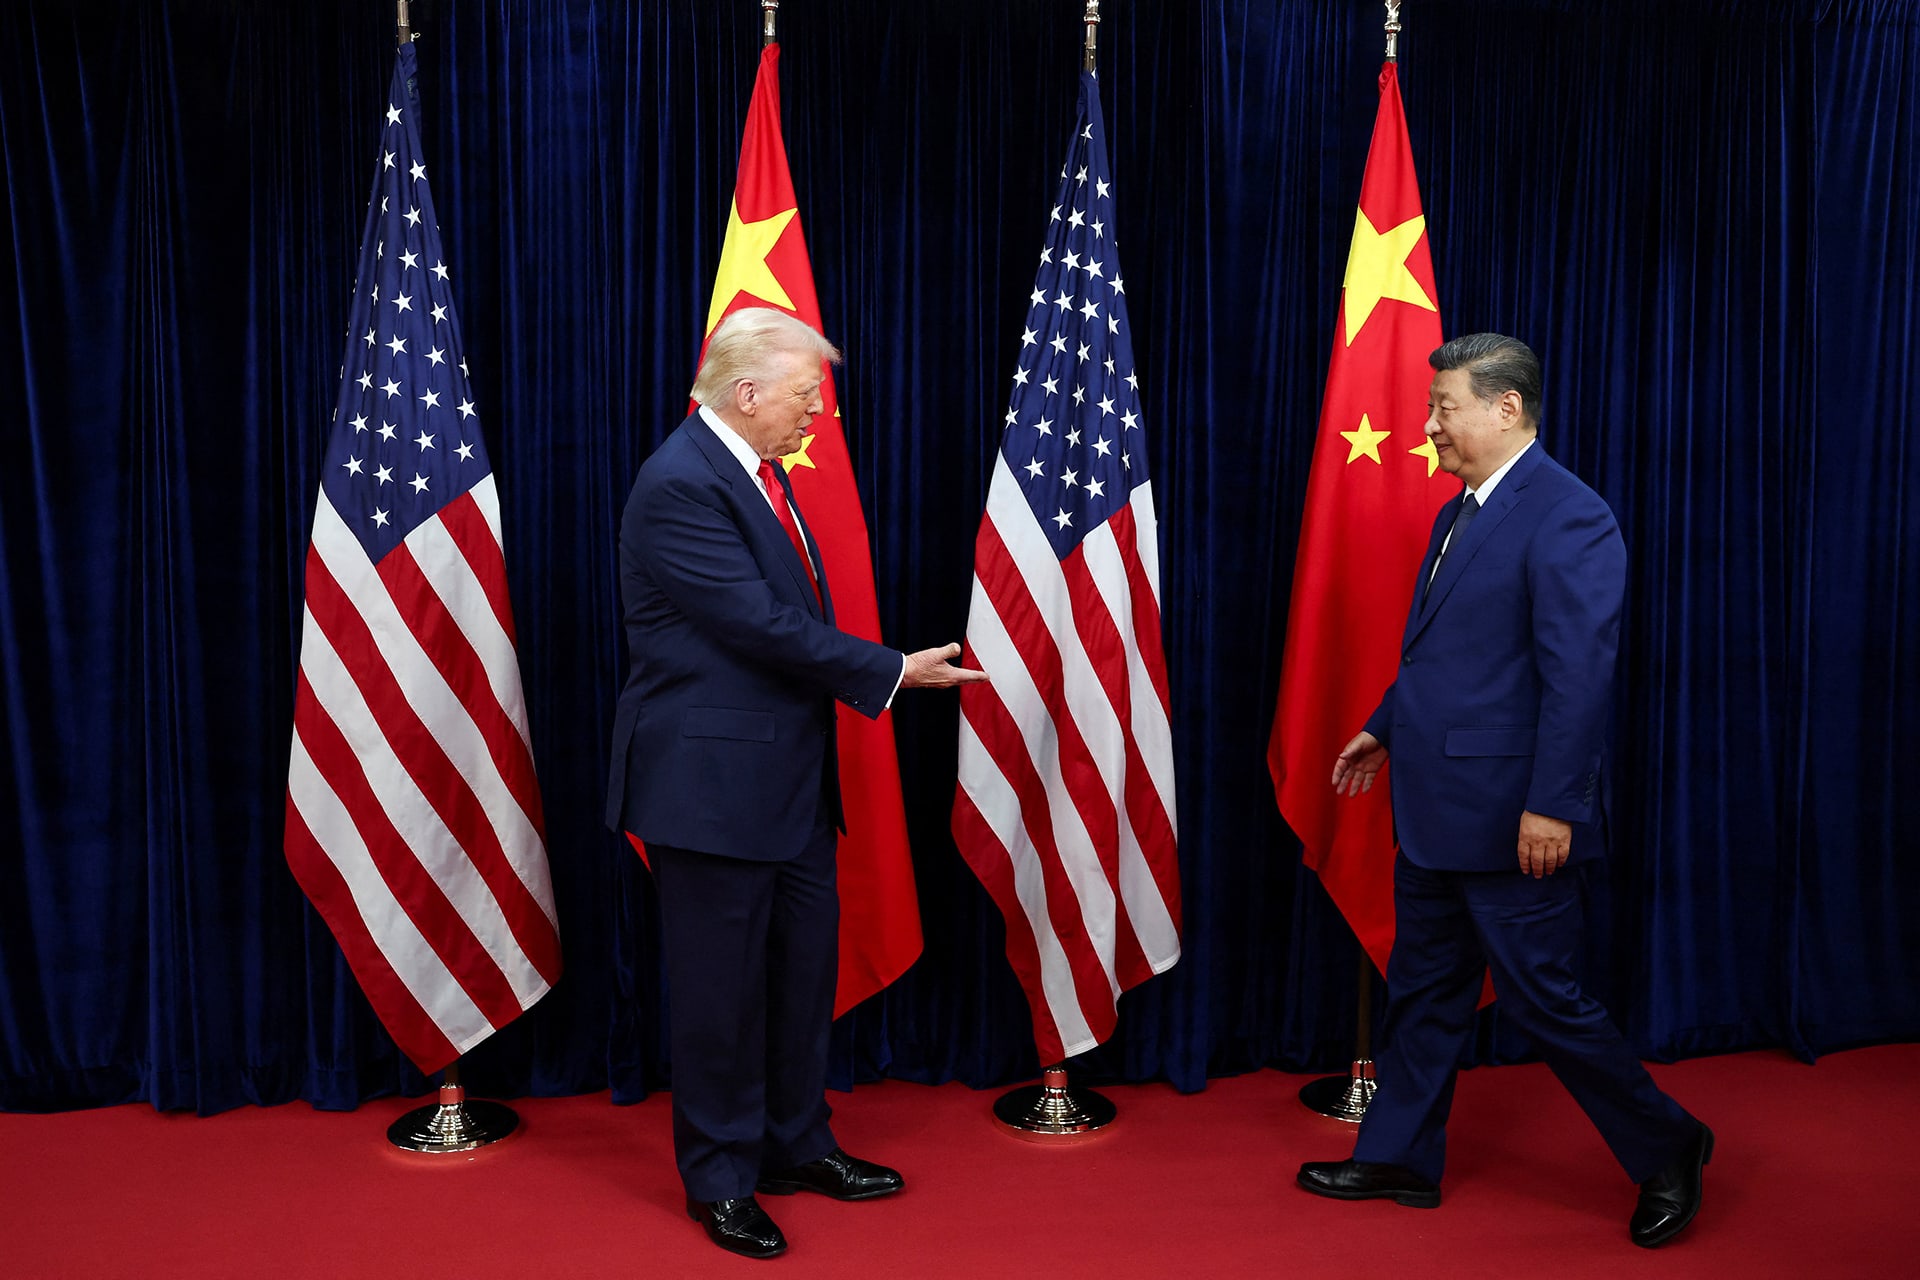 Expert Take
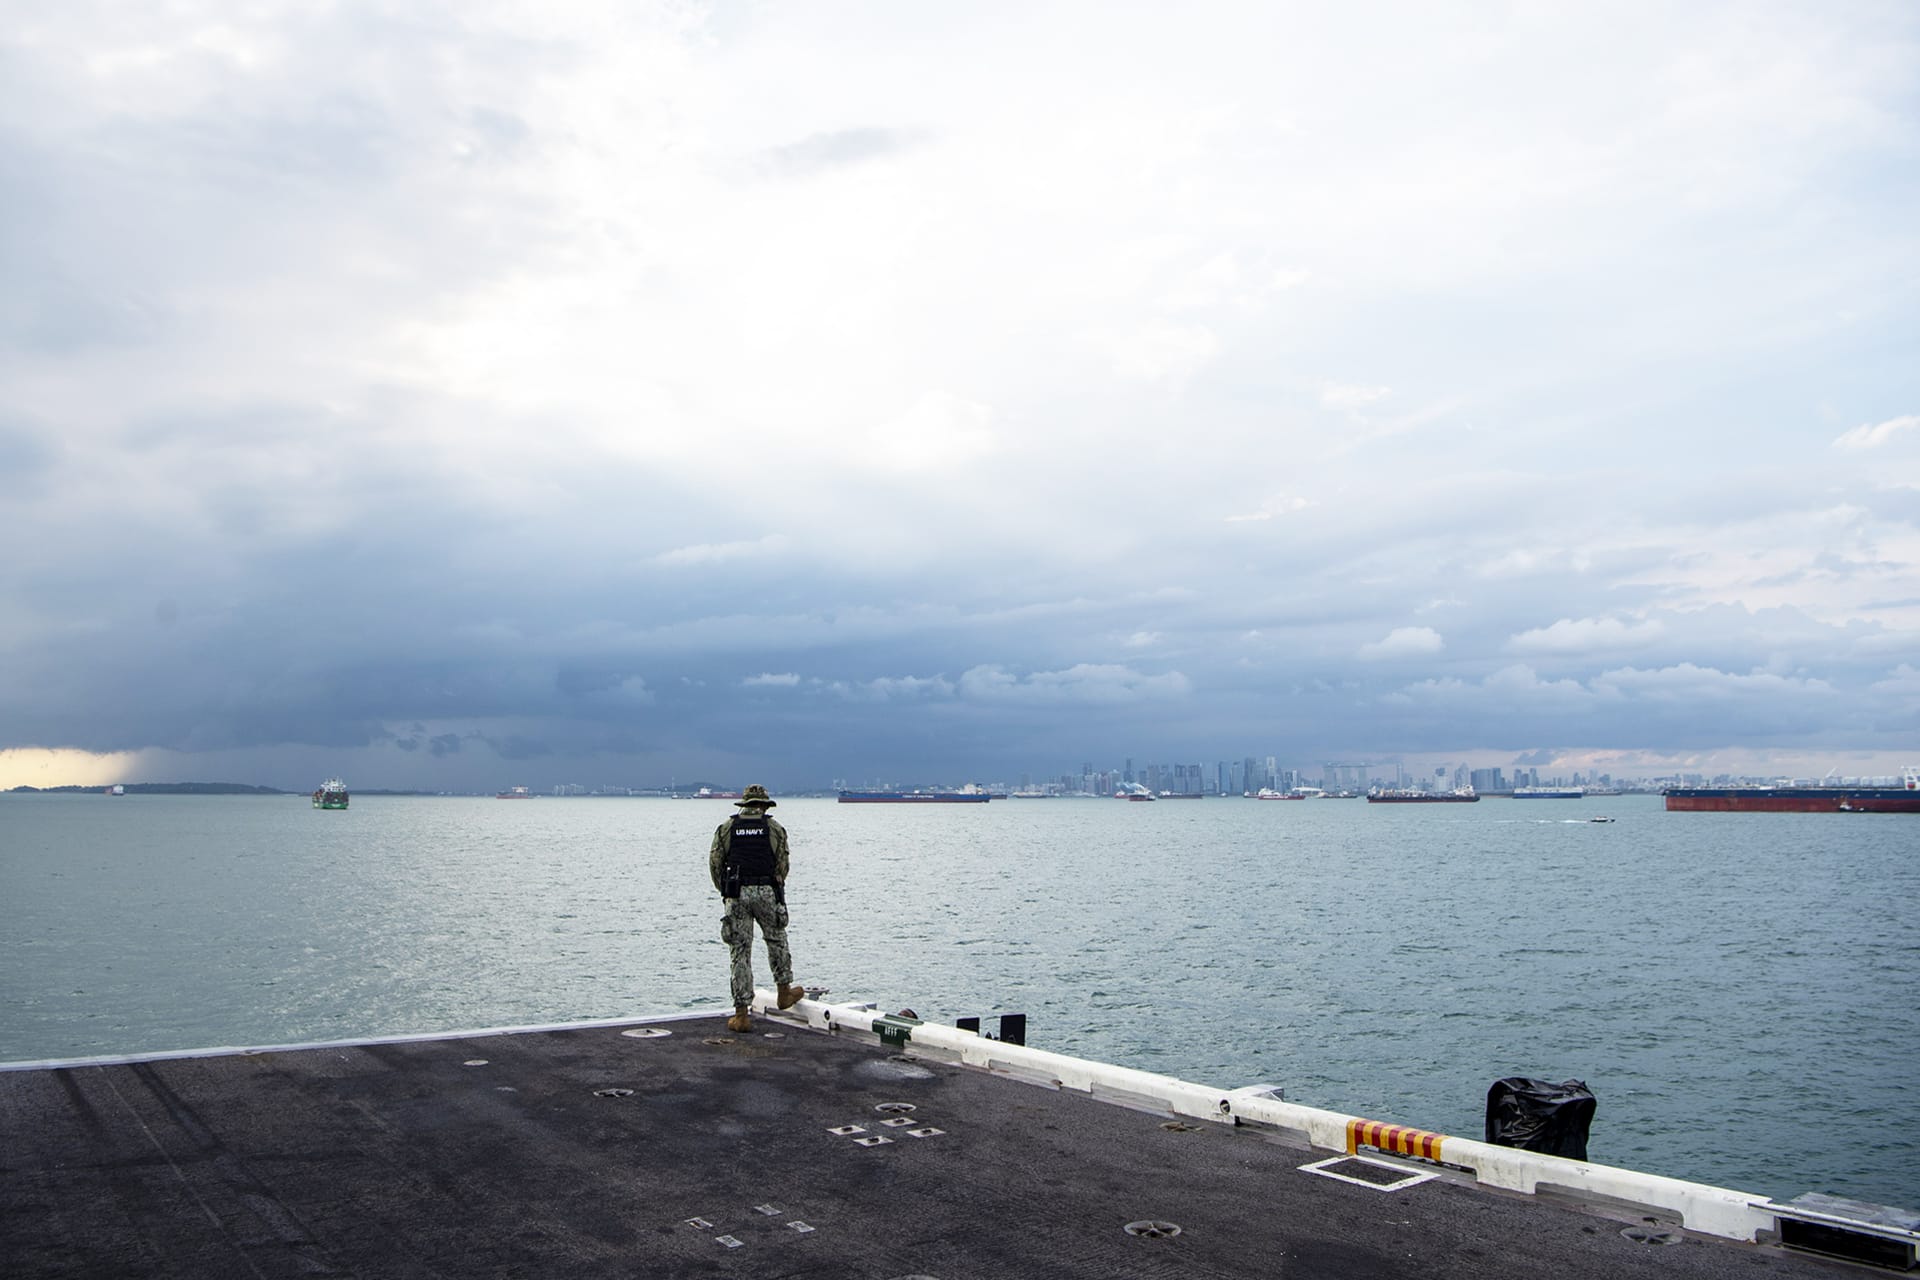 Expert Take
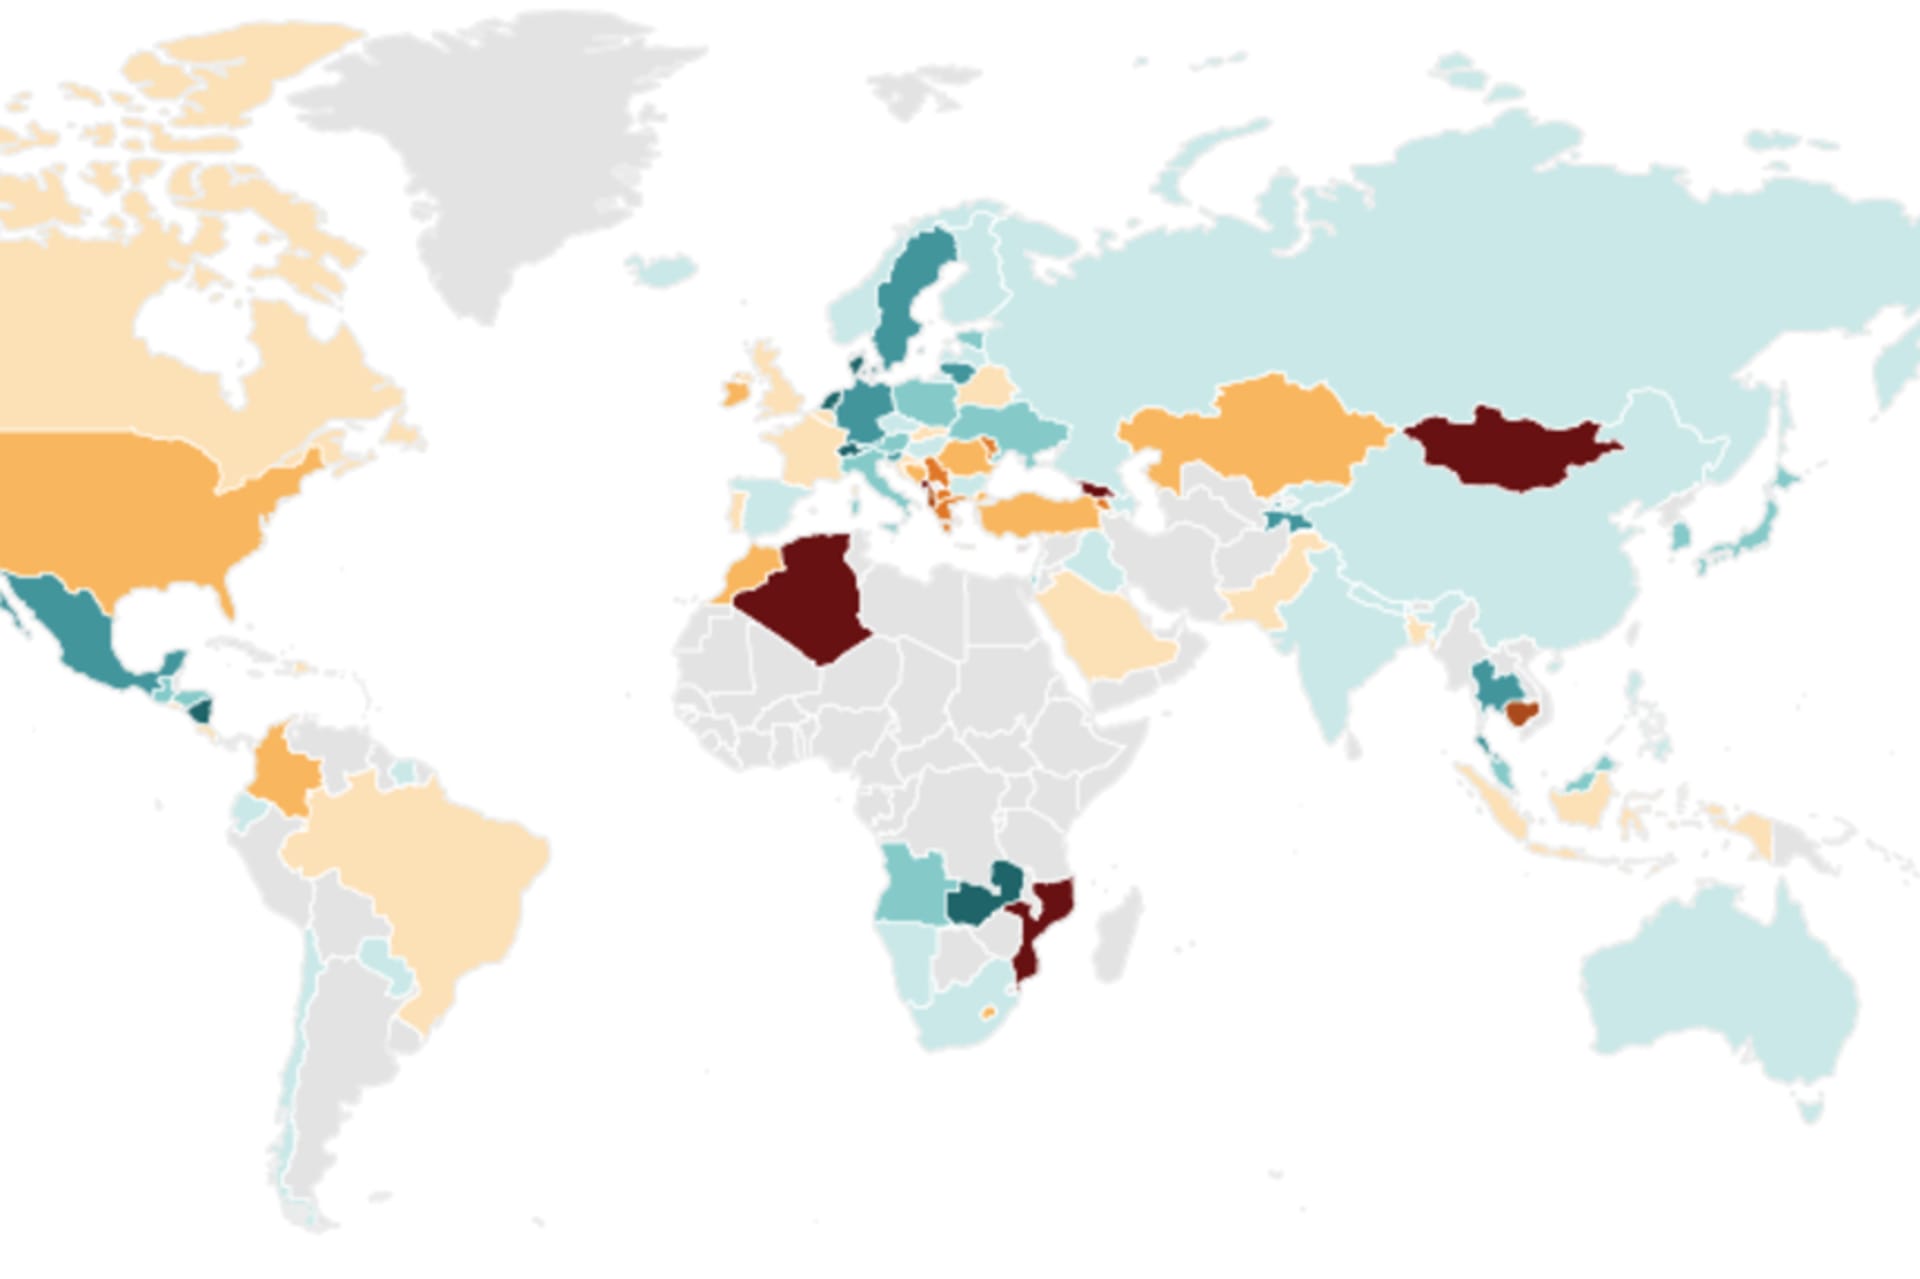
 Expert Take
 Expert Take
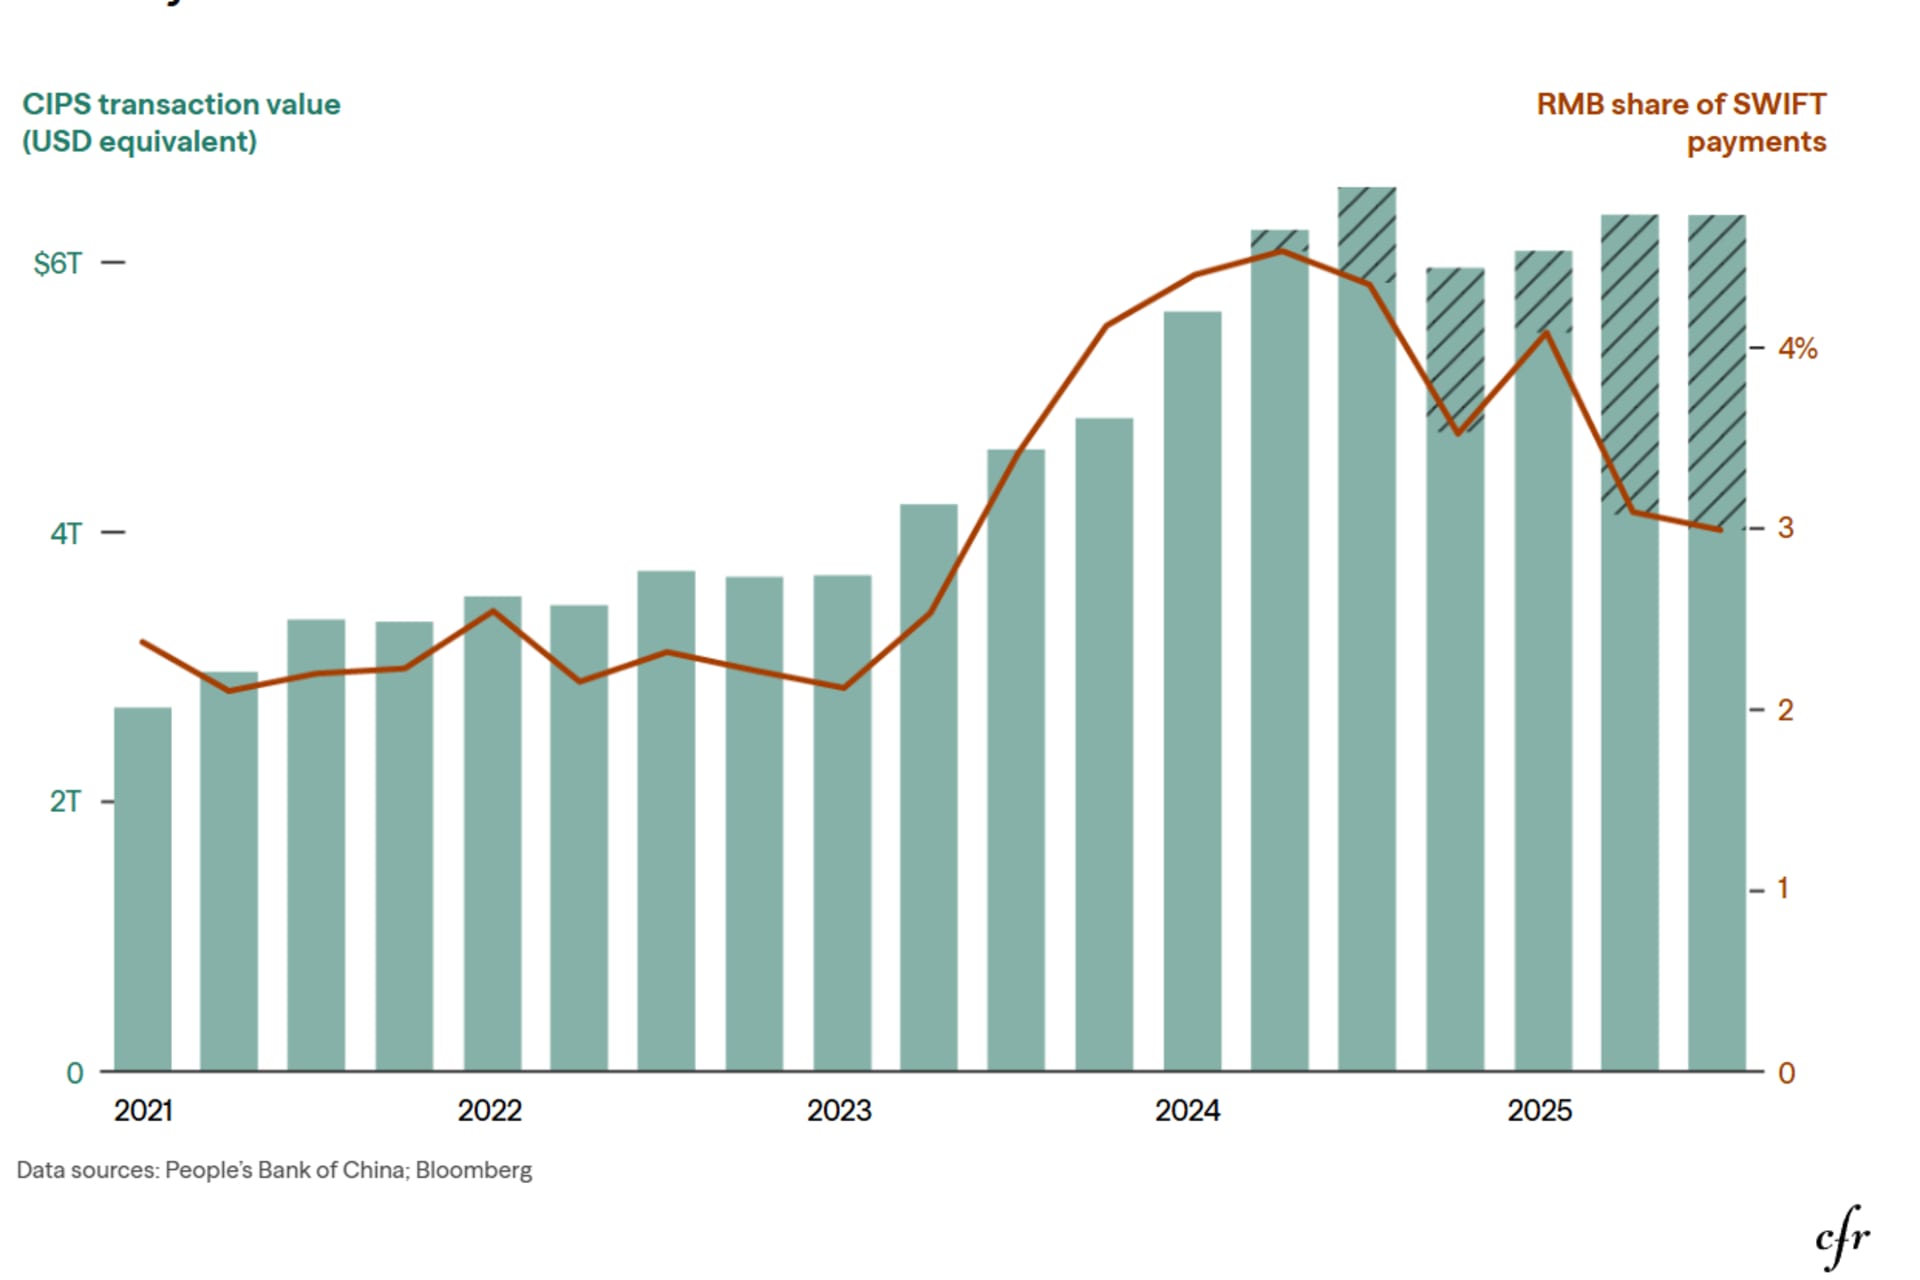
 Expert Take
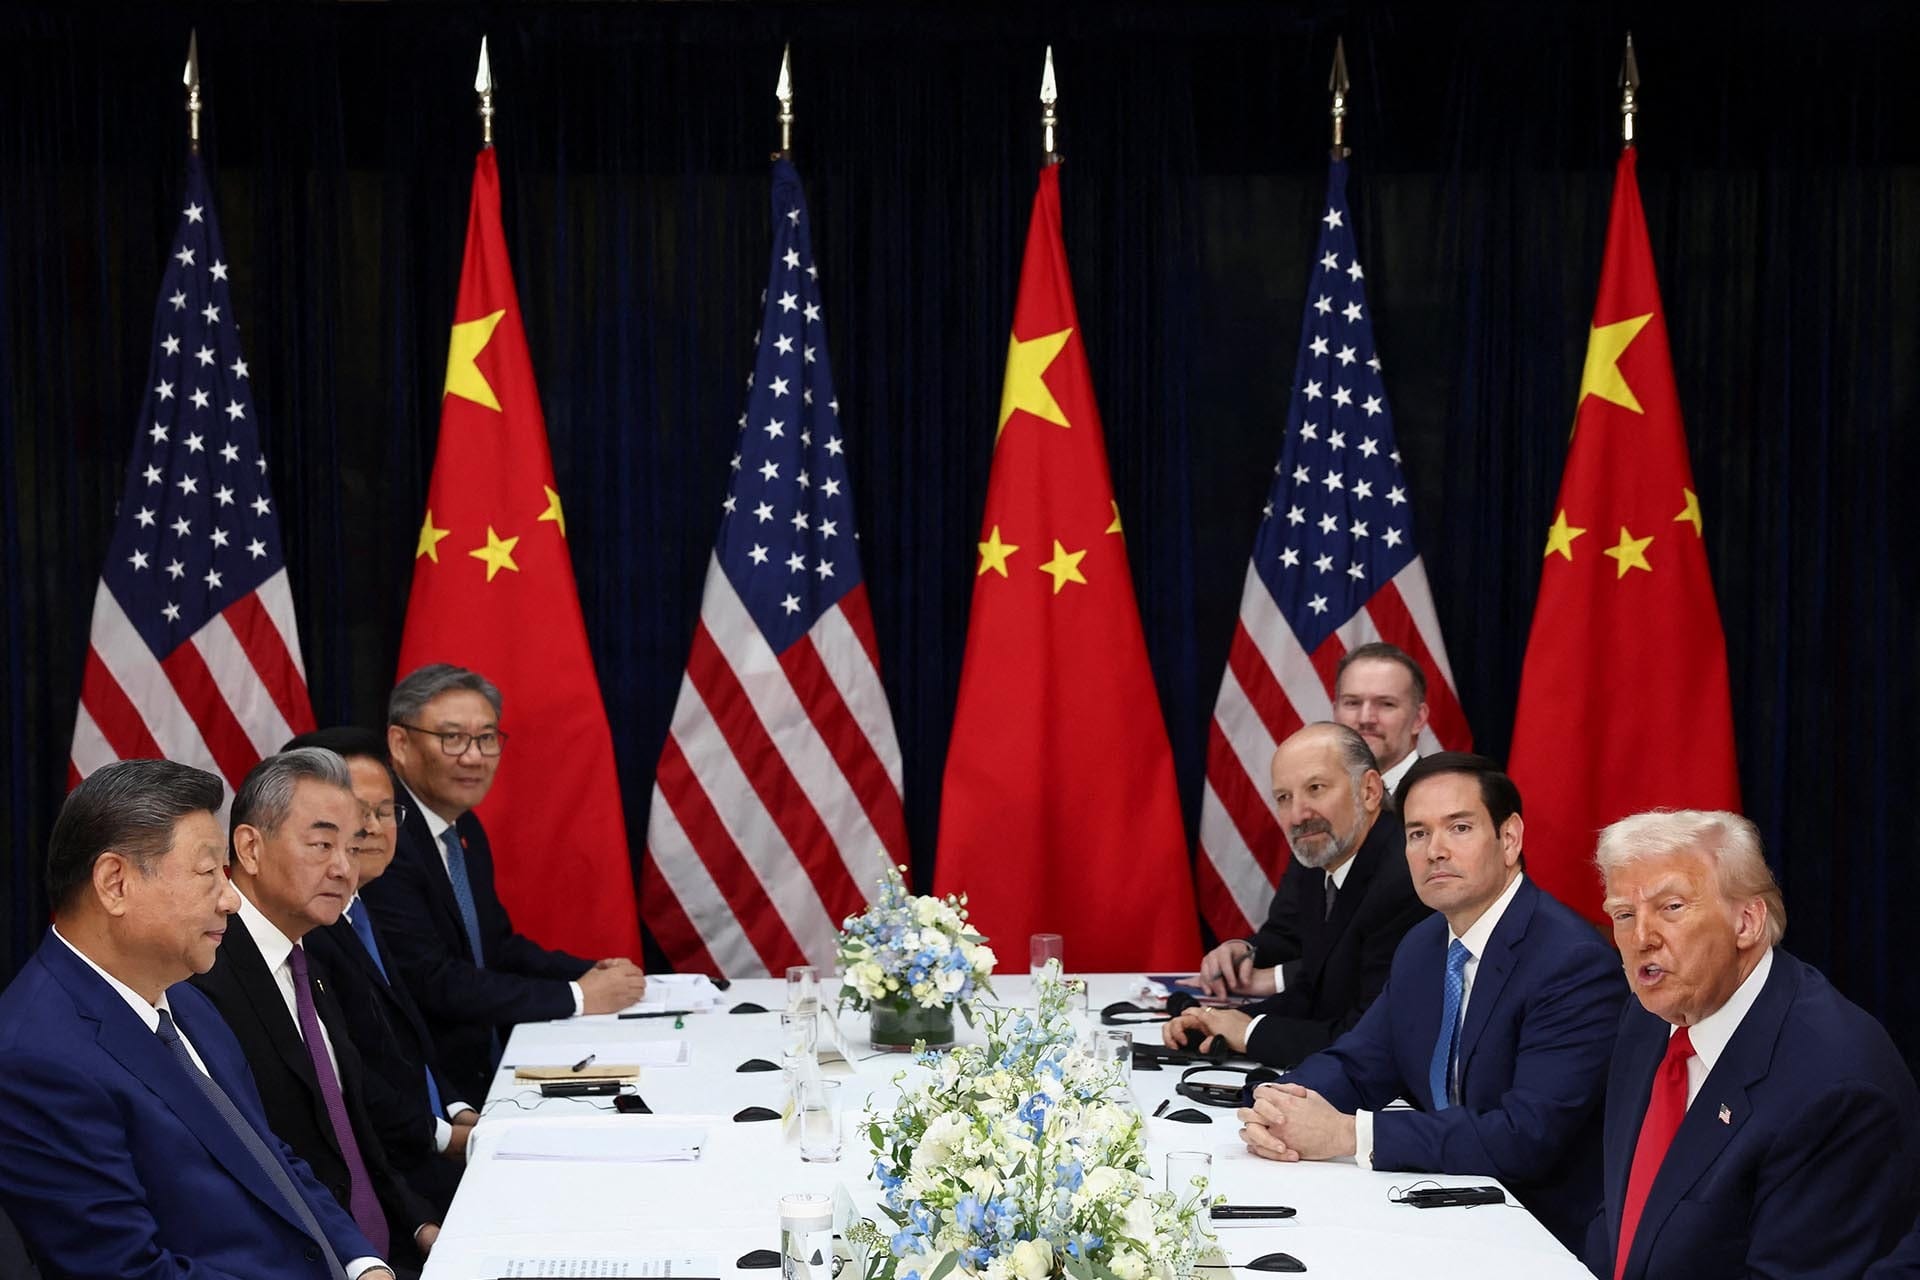 Expert Take