 Online Store
Introduction
Over the last several decades, governments have collectively pledged to slow global warming. But despite intensified diplomacy, the world is already facing the consequences of climate…
Follow the External (Balance of Payments) Breakevens of the Oil Exporters
The global impact of oil’s fall from $100 plus to under $50 a barrel has not gotten as much attention as I think it deserves. For most oil exporters, it has been a profound shock—one that forced such a massive contraction in imports that it pulled down global trade (far more than the trade remedies that tend to dominate the ‘trade” news). A few countries adjusted quickly and relatively efficiently (Russia), though not painlessly. A few have struggled to adapt—notably, because of its large external debt, poor policies, and growing political crisis, Venezuela. And some important countries have been able to draw down on large buffer stocks to delay adjusting to the new market reality. Most significantly, Saudi Arabia. The different response of various oil exporting economies to changes in the global oil price is the subject of my latest CFR discussion paper, coauthored with Cole Frank (there is also a companion interactive).
The United States is a player in this drama. The ability of the U.S. oil and gas industry to pull globally significant quantities of oil and gas out of “tight” reservoirs—first at a price in the 70s, and now apparently at a price in the 40s—radically transformed oil pricing. U.S. production costs are still well above the average cost of producing oil in Russia’s traditional West Siberian fields, let alone the cost in Saudi Arabia. But the ability of the U.S. to produce large quantities—and to ramp production up and down fairly quickly in response to changes in the price—made it more difficult for the Saudis to keep global prices up by limiting their own production. U.S. tight oil is a fairly elastic source of supply, and it is now clear that it can be produced on sufficient scale to help set the global cost curve.
More on:
But the United States is still a net importer of oil (despite the hype around crude oil exports that optimize the use of U.S. refining capacity). The U.S. is both a huge producer—and a huge consumer. Unlike the main oil-exporting economies, it both wins (on the consuming side) and loses (on the producing side) from changes in the price of oil.
For the net oil exporters, a fall in the price of oil, directionally, is nothing but trouble. Exports drop. And if the country’s currency doesn’t drop with oil, so too will budget revenues from the production and export of oil. Many analysts—including most IMF country teams—focus on the budget impact of changes in the oil price for oil-exporting economies. In a new working paper, Cole Frank and I try to make the case for using oil-exporters’ external breakeven price—the oil price that covers a country’s imports and brings the current account into balance—to track how individual oil-exporting economies, and the oil-exporters as a group, are responding to oil price swings.
The fiscal breakeven is something that everyone seems to understand. Yet calculating it for an individual country at a single point in time often turns out to be quite difficult. How much revenue does a country actually get from oil? It isn’t always clear, especially if the revenue comes from a tax on corporate profits rather than a royalty on production or exports. How should the cost of holding domestic oil and gas prices below global prices be reflected in the budget? What exchange rate is assumed for the conversion of oil export proceeds back into local currency? How much spending is being done off-budget, financed either directly by the state oil company or indirectly through funds that the state or state firms make available through the banking system? Getting a point estimate for a single country’s budget breakeven is hard, let alone a robust time series.
But I like time series and I like cross-country comparisons.
The external breakeven isn’t as intuitive to many people, though it seems fairly straightforward to me—it is the oil price that covers a country’s import bill.*
More on:
Ok, technically, it is the oil price that balances the current account, so oil exports need to equal the non-oil current account deficit—meaning remittances, dividend payments, interest income, and non-oil exports all enter in. But basically, it is the oil price that covers a country’s imports so it doesn’t have to borrow from the world (or sell off shares in its state oil company) to cover its import bill. It can be calculated easily for many countries so long as you know a country’s net oil exports (BP fortunately does all the hard work there, in its great statistical review of world energy), the global oil price, and a country’s current account balance (the IMF does the hard work there). The inputs are the same across countries and across time.
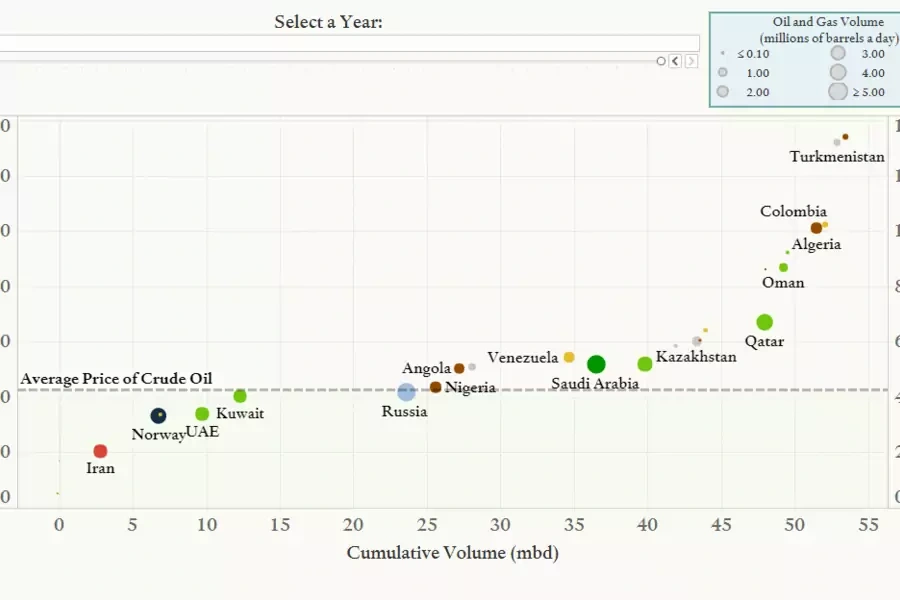
That means it is possible to compare the oil exporters’ global breakeven curve in say, 2013:

With the curve in 2016:

Notice the difference?
And since oil exports and current accounts can be summed up across countries, it is also possible to compare an individual country’s breakeven with the composite breakeven for all oil-exporting economies (note: we include gas, as a result of its gas and product imports, Mexico no longer counts as a net oil exporter). Look at the breakeven for Russia and Saudi Arabia relative to the global breakeven, for example:

The Saudis were once a model of prudence. And the Russians a model of profligacy. But Russia’s willingness to allow its exchange rate to float (down) and to allow inflation to erode the real purchasing power of Russian consumers helped it adjust quickly. Plus Russia has a somewhat bigger and more diverse economy than the typical petro-state or petro-kingdom.
Conversely, Saudi Arabia’s commitment to the dollar peg has taken away depreciation along with the price of oil as a mechanism of both balance of payments and fiscal adjustment (the dollar, and thus the Saudi riyal, rose in 2014 even as oil fell). The Saudis did belatedly ratchet down spending and imports in 2016: cutting off-budget investment projects, delaying vendor payments, and cutting spending on government salaries. But with the reversal of some spending cuts this year, the durability of that adjustment isn’t yet clear.
One other thing: the external breakeven isn’t necessarily the “breakeven” for a country’s foreign reserves. The external breakeven is the oil price that covers imports, not the oil price that covers imports and domestic capital flight. And funds have been leaving Saudi Arabia. In 2016, the Saudi current account deficit was $27.5 billion, and reserve draw was around $80 billion.
The Russians by contrast were able to maintain a current account surplus even with oil averaging roughly $45 a barrel last year. Their 2016 external breakeven was just under $40.
One finding of the paper is that the oil exporters aren’t really a homogenous group, especially if Russia, Saudi Arabia, and Iran (a unique case due to U.S. and EU sanctions) are left out of the mix. In many ways the smaller exporters sort fairly naturally into a group that has—through prudent policies, often facilitated by a very small population relative to their oil production—kept its external breakeven price at about $50 a barrel throughout the boom years. That group is anchored by Norway and the small, rich GCC countries. And then there is a group that more or less needed $100 oil back in 2014, and generally speaking also lacked a large buffer of external assets. They were forced to adjust quickly to lower oil prices—whether through the budget or a weaker currency. Most Latin American and African oil-exporters fall into this category.
Take a look at the interactive that accompanies the paper. It lets you graph the historical breakevens of the 26 largest net exporters of oil and gas.
A fall in the breakeven more or less means a fall in spending on imports, so the oil exporters’ adjustment was a major factor in the slowdown of global trade in 2015 and 2016.
That though is (mostly) the past. Most of the global adjustment to lower oil prices looks to have already taken place.
But there are exceptions to the rule. Oman, Algeria (which recently devalued), and Venezuela (whose breakeven needs to cover interest on its debt as well as imports) all had relatively high breakevens in 2016. So does Libya—but Libya’s breakeven fluctuates based on its oil production. And Colombia—but it has a more diversified economy. The utility of the breakeven calculation is limited if oil and gas aren’t the majority of exports.
And, well, then there is Saudi Arabia. The Saudis did adjust in late 2016, and their current account deficit in early 2017 has remained modest. But the ability of the Saudis to sustain the fiscal tightening that helped bring imports down remains a question—especially with a growing population. Its adjustment is still worth watching.
NOTE: the analysis in the working paper draws heavily on BP’s data on global oil and gas production. We used the 2016 data set, which has authoritative production numbers for 2015. We will be updating the numbers to reflect actual 2016 production soon. The main technical innovation in the paper was explicitly incorporating natural gas trade into the estimated breakevens. That requires converting gas in its oil equivalent, and estimating the gap between the global oil price and various countries gas export prices. It increases the complexity of the calculation but it adds to the accuracy of the estimated breakeven of countries like Qatar, Norway and Russia. In the future it also could matter for Iran.
Creative Commons: Some rights reserved.
This work is licensed under Creative Commons Attribution-NonCommercial-NoDerivatives 4.0 International (CC BY-NC-ND 4.0) License.
View License Detail