The 2016 Yuan Depreciation

The Bank for International Settlements’ (BIS) broad effective index is the gold standard for assessing exchange rates. And the BIS shows—building on a point that George Magnus has made—that China’s currency, measured against a basket of its trading partners, has depreciated significantly since last summer. And since the start of the year. On the BIS index, the yuan is now down around 7 percent YTD.
Those who were convinced that the broad yuan was significantly overvalued last summer liked to note how much China’s currency had appreciated since 2005.
But 2005 was the yuan’s long-term low. And the size of China’s current account surplus in 2006 and 2007 suggests that the yuan was significantly undervalued in 2005 (remember, currencies have an impact with a lag).
I prefer to go back to around 2000. The yuan is now up about 20 percent since then (since the of end of 2001 or early 2002 to be more precise).
And twenty percent over 15 years isn’t all that much, really.
Remember that over this time period China has seen enormous increases in productivity (WTO accession and all). China exported just over $200 billion in manufactures in 2000. By 2015, that was over $2 trillion. Its manufacturing surplus has gone from around $50 billion to around $900 billion. China’s global trade footprint has changed dramatically since 2000, and a country should appreciate in real terms during its “catch-up” phase.
In 2014 and early 2015, the broad yuan clearly appreciated at a much faster rate than had been typical after 2004. Out of curiosity, I drew a trend line from end 2004 to 2012.
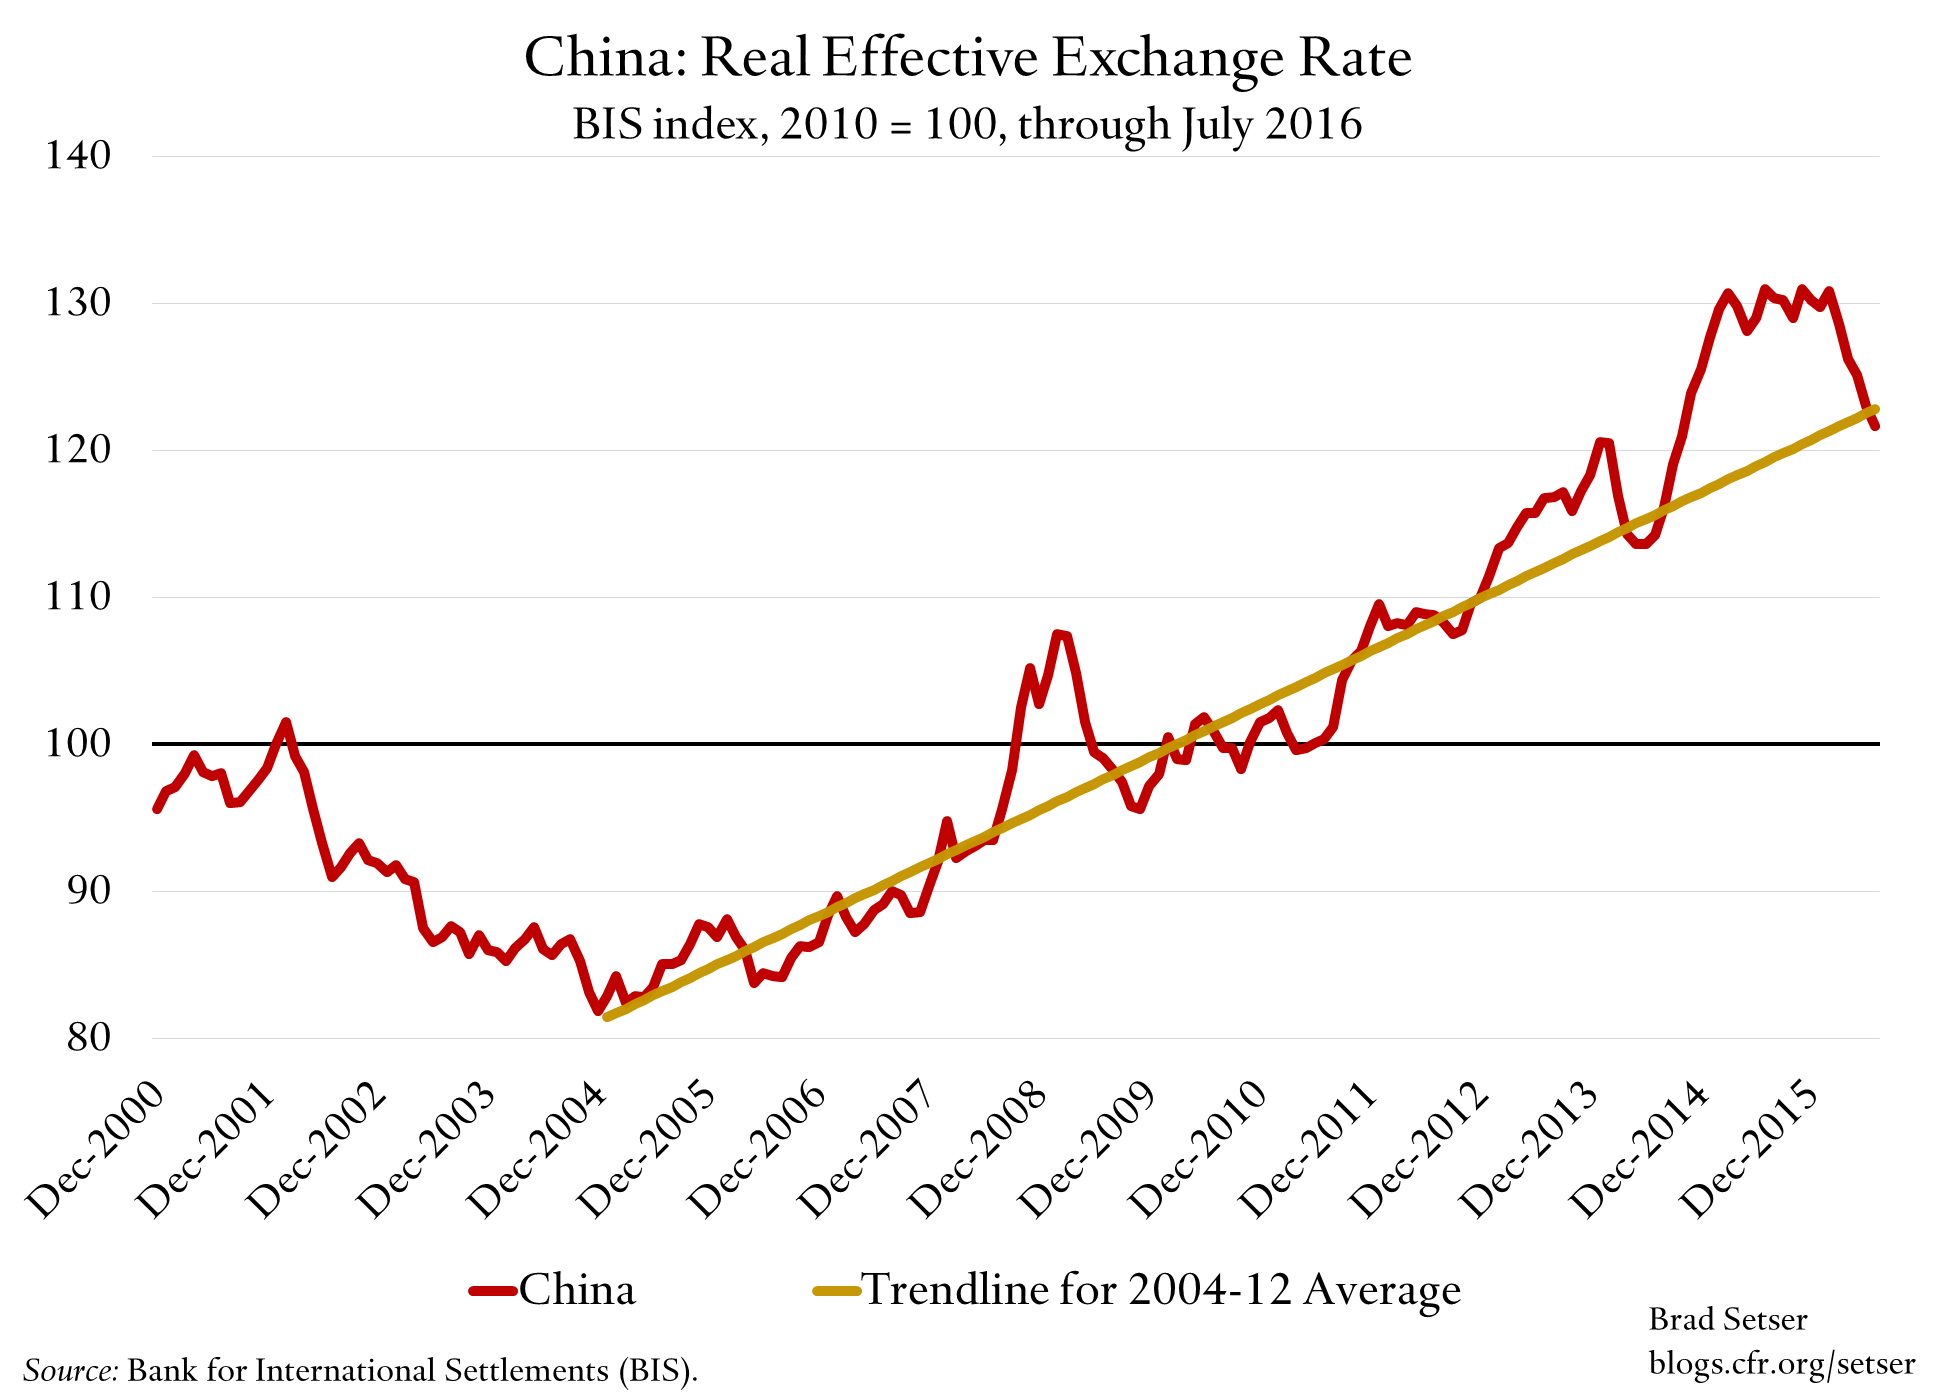
With the recent depreciation, the broad yuan is more or less now back on that trend line.
You can argue that the pace of appreciation implied by the trend line (about 3.5 percent a year) is too fast now, as it reflects an initial appreciation from a structural undervaluation.
But if you are thinking about the right fundamental level of yuan, not just the pace of appreciation, you would also need take into account the 2000-2004 depreciation. If you think the right average pace of appreciation over the last fifteen years—given China’s catch-up—is 1.5 percent a year, China would now be close to a trend line starting in 2000. And a few years back William Cline of the Peterson Institute estimated that China’s real exchange rate needed to appreciate by about 1.7 percent a year (call it 1.5 to 2 percent) to keep China’s current account surplus constant.
It is a debate. For one, a linear pace of appreciation almost certainly isn’t right, as presumably productivity growth (and relative productivity growth) hasn’t been constant.
No matter, one point is clear: the yuan isn’t as strong as it was a year ago.
And that is starting to show in the trade data. Chinese goods export volumes were up 5 percent year-over-year in the last four months of data (q2 plus July). That is a much faster pace of increase than for say the United States (U.S. non-petrol goods export volumes were down well over 2 percent in q2).
The following chart would not pass peer review muster. I had to convert nominal exports into real exports using a price index that is also derived from the reported percent changes (China really should produce better data here). But I think it captures something significant:
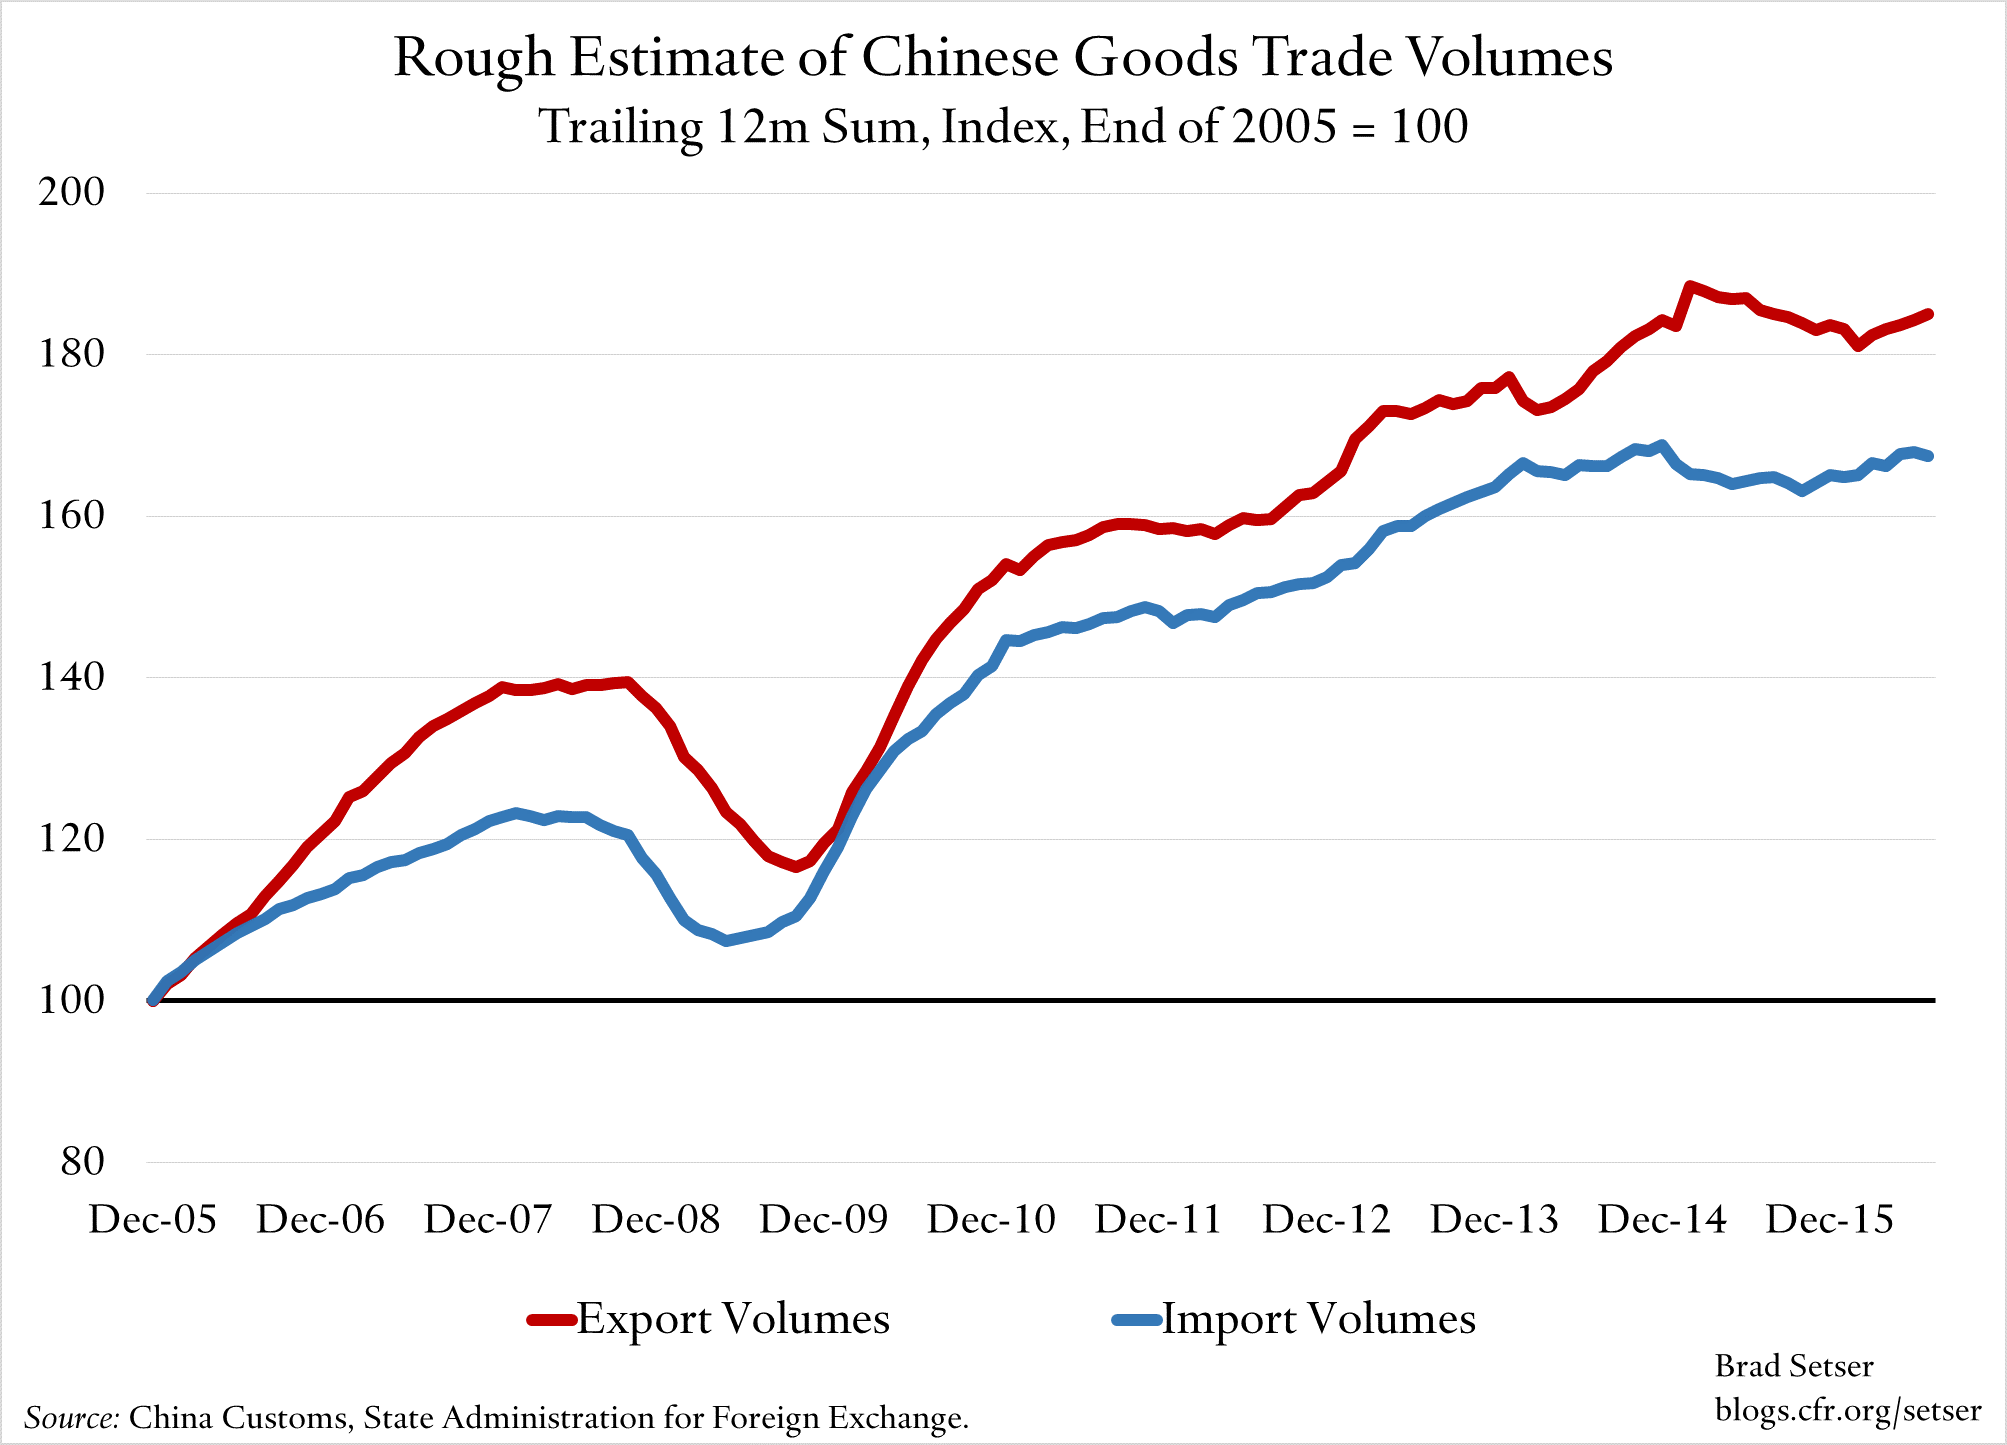
In q2 2016 and July, it seems likely that China’s (goods) exports grew a bit faster than overall world trade.
That doesn’t scream “over-valuation.” And to my mind it makes the trade data for q3 all the more important.