 Online Store
Introduction
Over the last several decades, governments have collectively pledged to slow global warming. But despite intensified diplomacy, the world is already facing the consequences of climate…

Quick take on today’s US trade data
More on:
A key reason the US October trade deficit went up not down is a rise in the volume of US oil imports.
Oil imports were down 14% in volume terms in September and were up a bit over 2% in October. That is noise. The 3m rolling average for oil import volumes is still down 6% y/y -- and the y/y fall is around 5%. But the rise in volume offset the fall in price (the average price of imported oil fell from over $107 a barrel to $92 a barrel), so the petrol deficit rose by $0.8b to $32.7 billion in October.
The good news is that the average price of imported oil still has a lot further to fall. I would guess that the 2008 petrol deficit (netting exports out) will be close to $400 billion. It could fall to $200-250 billion in 2009.
The bad news is that October exports were down $3b from September -- and down $16b from their July peak. They almost certainly will fall more. The constellation that supported strong US export growth -- strong global growth and a weak dollar -- has disappeared. The really bad news is that real export growth is slowing faster than real import growth.
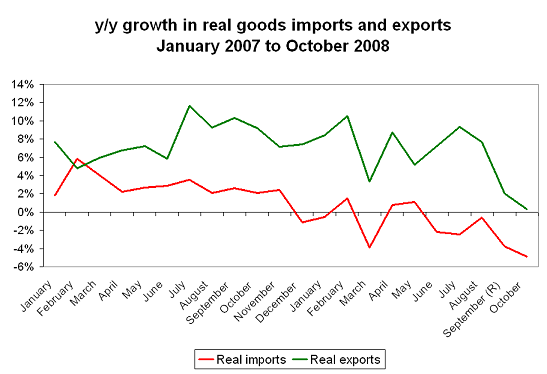
A longer time series shows the recent downturn in "real" exports and imports clearly.
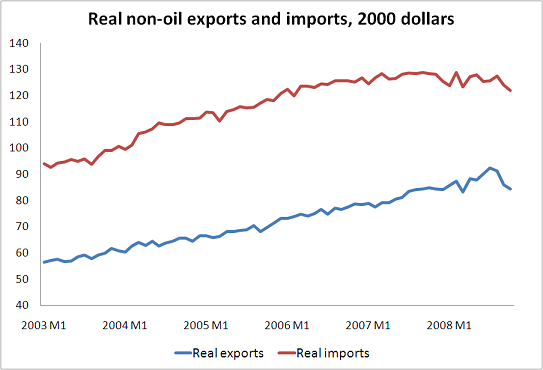
The real deficit in October was over $46b -- v $40b in q3 (this data is presented in 2000 dollars-- it should not be compared to the nominal numbers, only to other "real" numbers). If the current trend continues and exports volumes shrink more than imports, net exports might even subtract from US growth in q4. Then again, the big fall in Chinese exports in November suggests that the pace of the fall in US imports could accelerate ...
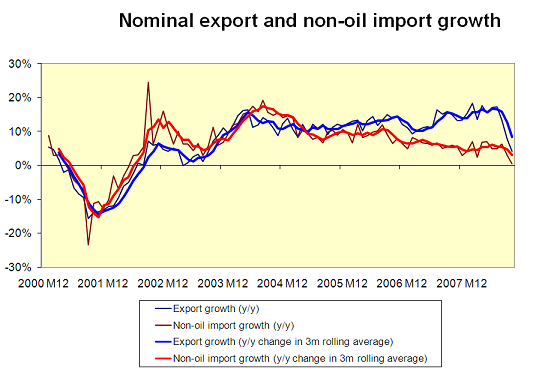
UPDATE:
As one would expect given the real data, nominal non-oil export growth is slowing more rapidly than nominal non-oil import growth.
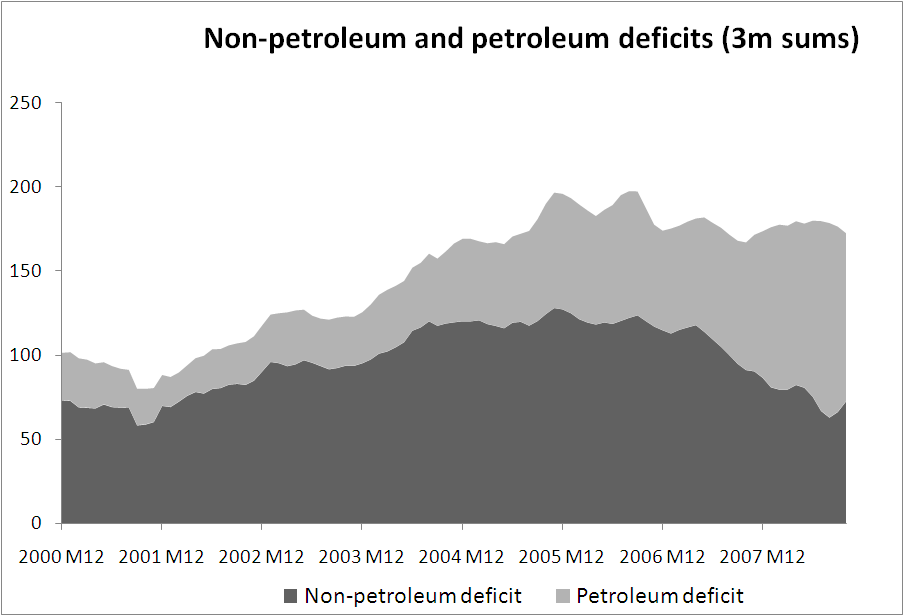
And just in case there was any doubt, the non-oil trade deficit has started to expand in the past few months. If that continues, it is very bad news for the US indeed -- even if the overall deficit shrinks as the petrol deficit falls.
Thanks to Arpana Pandey for help with the graphs,.
That brings me to a couple of additional points. Michael Pettis (note the new URL for his blog) has been emphasizing how the differences in scale (the US is 3 to 4 times the size of China) interact with China’s greater export dependence in ways that make a US slump especially bad for China. He is right.
But I would argue that his argument should be refined in two ways:
a) Much depends on what else is going in in the world. The US has been slowing for a while, and Chinese exports to the US weren’t growing even before the recent downturn. That didn’t matter to China so long as the US slump pushed the dollar (and the RMB) down and China could offset slow growth in its US exports with rapid growth in its exports to another large economic block -- Europe. But now the RMB is up v the euro and both the US and Europe are slowing. So an economic block that is roughly 8 times China’s size (and whose consumption would be more than 8 times the size of China’s consumption) is slowing -- which is bound to hurt China given that China’s pattern of growth over the past six to eight years has dramatically increased its exposure to the global cycle (look at the chart showing Chinese y/y export growth in $ billion in my previous post).
b) The argument really hinges on what happens to US non-oil imports, not the US trade deficit. The US trade deficit could fall if the oil deficit fell without impacting China much. Similarly if falling exports and imports keep the US non-oil deficit constant (or even increase it), China would still be hurt. What matters for China’s export sector is the growth in US (and EU) imports. China now has a big enough global market share that it is increasingly difficult for China to offset a big fall in overall demand by increasing its market share. That is a big difference between now and 2000 ...
More on: