Trump’s Stimulus Trumps His Trade Policy

It is hard to think of a President more committed—at least rhetorically—to closing the trade balance than President Trump. The usual criticism of his trade policy is that it is overly focused on a single goal—reducing the bilateral, and ultimately the overall, trade deficit, to the exclusion of more traditional goals like liberalization (e.g. expanding trade) or expanding the scope of the traditional rules governing trade. President Trump has made it equally clear he cares about the manufacturing balance.
Yet the results of the first seven quarters of his presidency show, ironically, the limits on what can be achieved through trade policy alone.
To be sure, the impact of Trump’s new tariffs (on China) and the new trade deal (with Canada and Mexico) aren’t in the data yet. President Trump’s trade policy for the first six quarters of his presidency consisted of halting further liberalization (by opting not to participate in the TPP) and a set of fairly narrow, sector specific trade cases (steel, solar, washing machines); the really big shift in policy is only now starting.
But, well, the trade actions to date haven’t come close to achieving the turnaround in manufacturing trade President Trump promised. Imports of manufactures are up significantly. (I forecast out the third quarter based on the first two months of data, if China’s September numbers are indicative, I may have been too conservative).
![[Graph 1] Cumulative Contribution from Manufac Goods Trade](https://static.cfr.org/sites/default/files/styles/large_s/public/image/2018/10/%5BGraph%201%5D%20Cumulative%20Contribution%20from%20Manufac%20Goods%20Trade_0.png)
I used a somewhat unconventional measure to look at changes in the real trade balance. I used the contributions data in the national income and product accounts rather than the trade data directly. And I calculated the contribution each quarter from the national income and product accounts data and then summed the contributions over time. This avoids the difficulties of scaling real trade measures to real GDP (I think) – and takes out the effect of price movement.
This allows me to paint a picture about what is happening to different sectors of the economy—manufacturing for example, petrol, and even services (though there isn’t a story in the services data over the past few years)—as well as the overall numbers.*
What jumps out in the data on manufacturing trade? Well, two macroeconomic factors.
One: The dollar’s 2014/15 appreciation led export growth to stall, and created a significant drag on the economy at a time when overall demand growth was weak. Falling exports added to the pressure on the manufacturing sector created by the fall in oil and agricultural investment (see Neil Irwin of the New York Times).
Two: Trump’s stimulus has, as predicted, supported strong import growth—even in the face of Trump’s “America first” trade policy.
Yep, so far Trump’s overall policy mix—his combination of stimulative macroeconomic policies and more aggressive trade policy—has delivered a net stimulus of about 1 percent of U.S. GDP to the United States‘ main manufacturing trade partners. Trump’s stimulus—and the still relatively strong dollar—are making German and Chinese exports great (again). In technical terms, the cumulative contribution of trade in core manufactures (capital goods, autos, and consumer goods in the trade data) has been negative 0.9 pp of GDP over the first six quarters of Trump’s presidency, and based on the data for the first two months of the third quarter of 2017, the cumulative (negative) contribution will soon be over a percentage point of U.S. GDP.
Germany, Japan, Korea, China and many others certainly don’t like Trump’s challenge to the existing trade rules. But they all also have—to date—benefited from strong U.S. demand for exports. The recent import surge, when the q3 data is factored in, will have delivered a benefit to them that is roughly comparable in size to the swing associated with the dollar’s 2014/15 rise.
We will see what happens when Trump’s tariffs on China take place. Import growth could cool—the full tariffs would cover roughly a quarter of U.S. “core” goods imports (imports of consumer goods, capital goods, and autos). However, the net effect of putting tariffs on imports of around 2.5 percent of U.S. GDP depends on how much trade is diverted to other trade partners. And export growth also looks to be slowing on the back of the dollar’s strength in the last two quarters, weakness in emerging economies and other countries’ retaliation for Trump’s trade action. Reducing your imports doesn’t improve your trade balance if exports also fall.
At least for now, though, “macro” factors trump “micro” factors. Trump’s stimulus has had a far bigger effect on the global economy than Trump’s protectionism.
![[Graph 2] Contributions from Goods Trade since 2011](https://static.cfr.org/sites/default/files/styles/large_s/public/image/2018/10/%5BGraph%202%5D%20Contributions%20from%20Goods%20Trade%20since%202011_0.png)
Analysts who look at the nominal trade data haven’t observed the deterioration in the trade balance that I have highlighted, at least not yet. The current account balance has also stayed relatively constant.
That isn’t primarily because of services. Or even because of the income balance, though the surplus generated by the offshore profits of U.S. firms remains large. The main offset to the quite significant widening of the manufacturing deficit over the last four years has been the U.S. oil boom.
Those who argue that the U.S. can never grow through exports (or substituting domestic production for imports) should take close look at the oil sector. Over the last decade, the fall in the real petrol balance (e.g. rising domestic U.S. production relative to U.S. demand) has added close to two percentage points to U.S. growth.
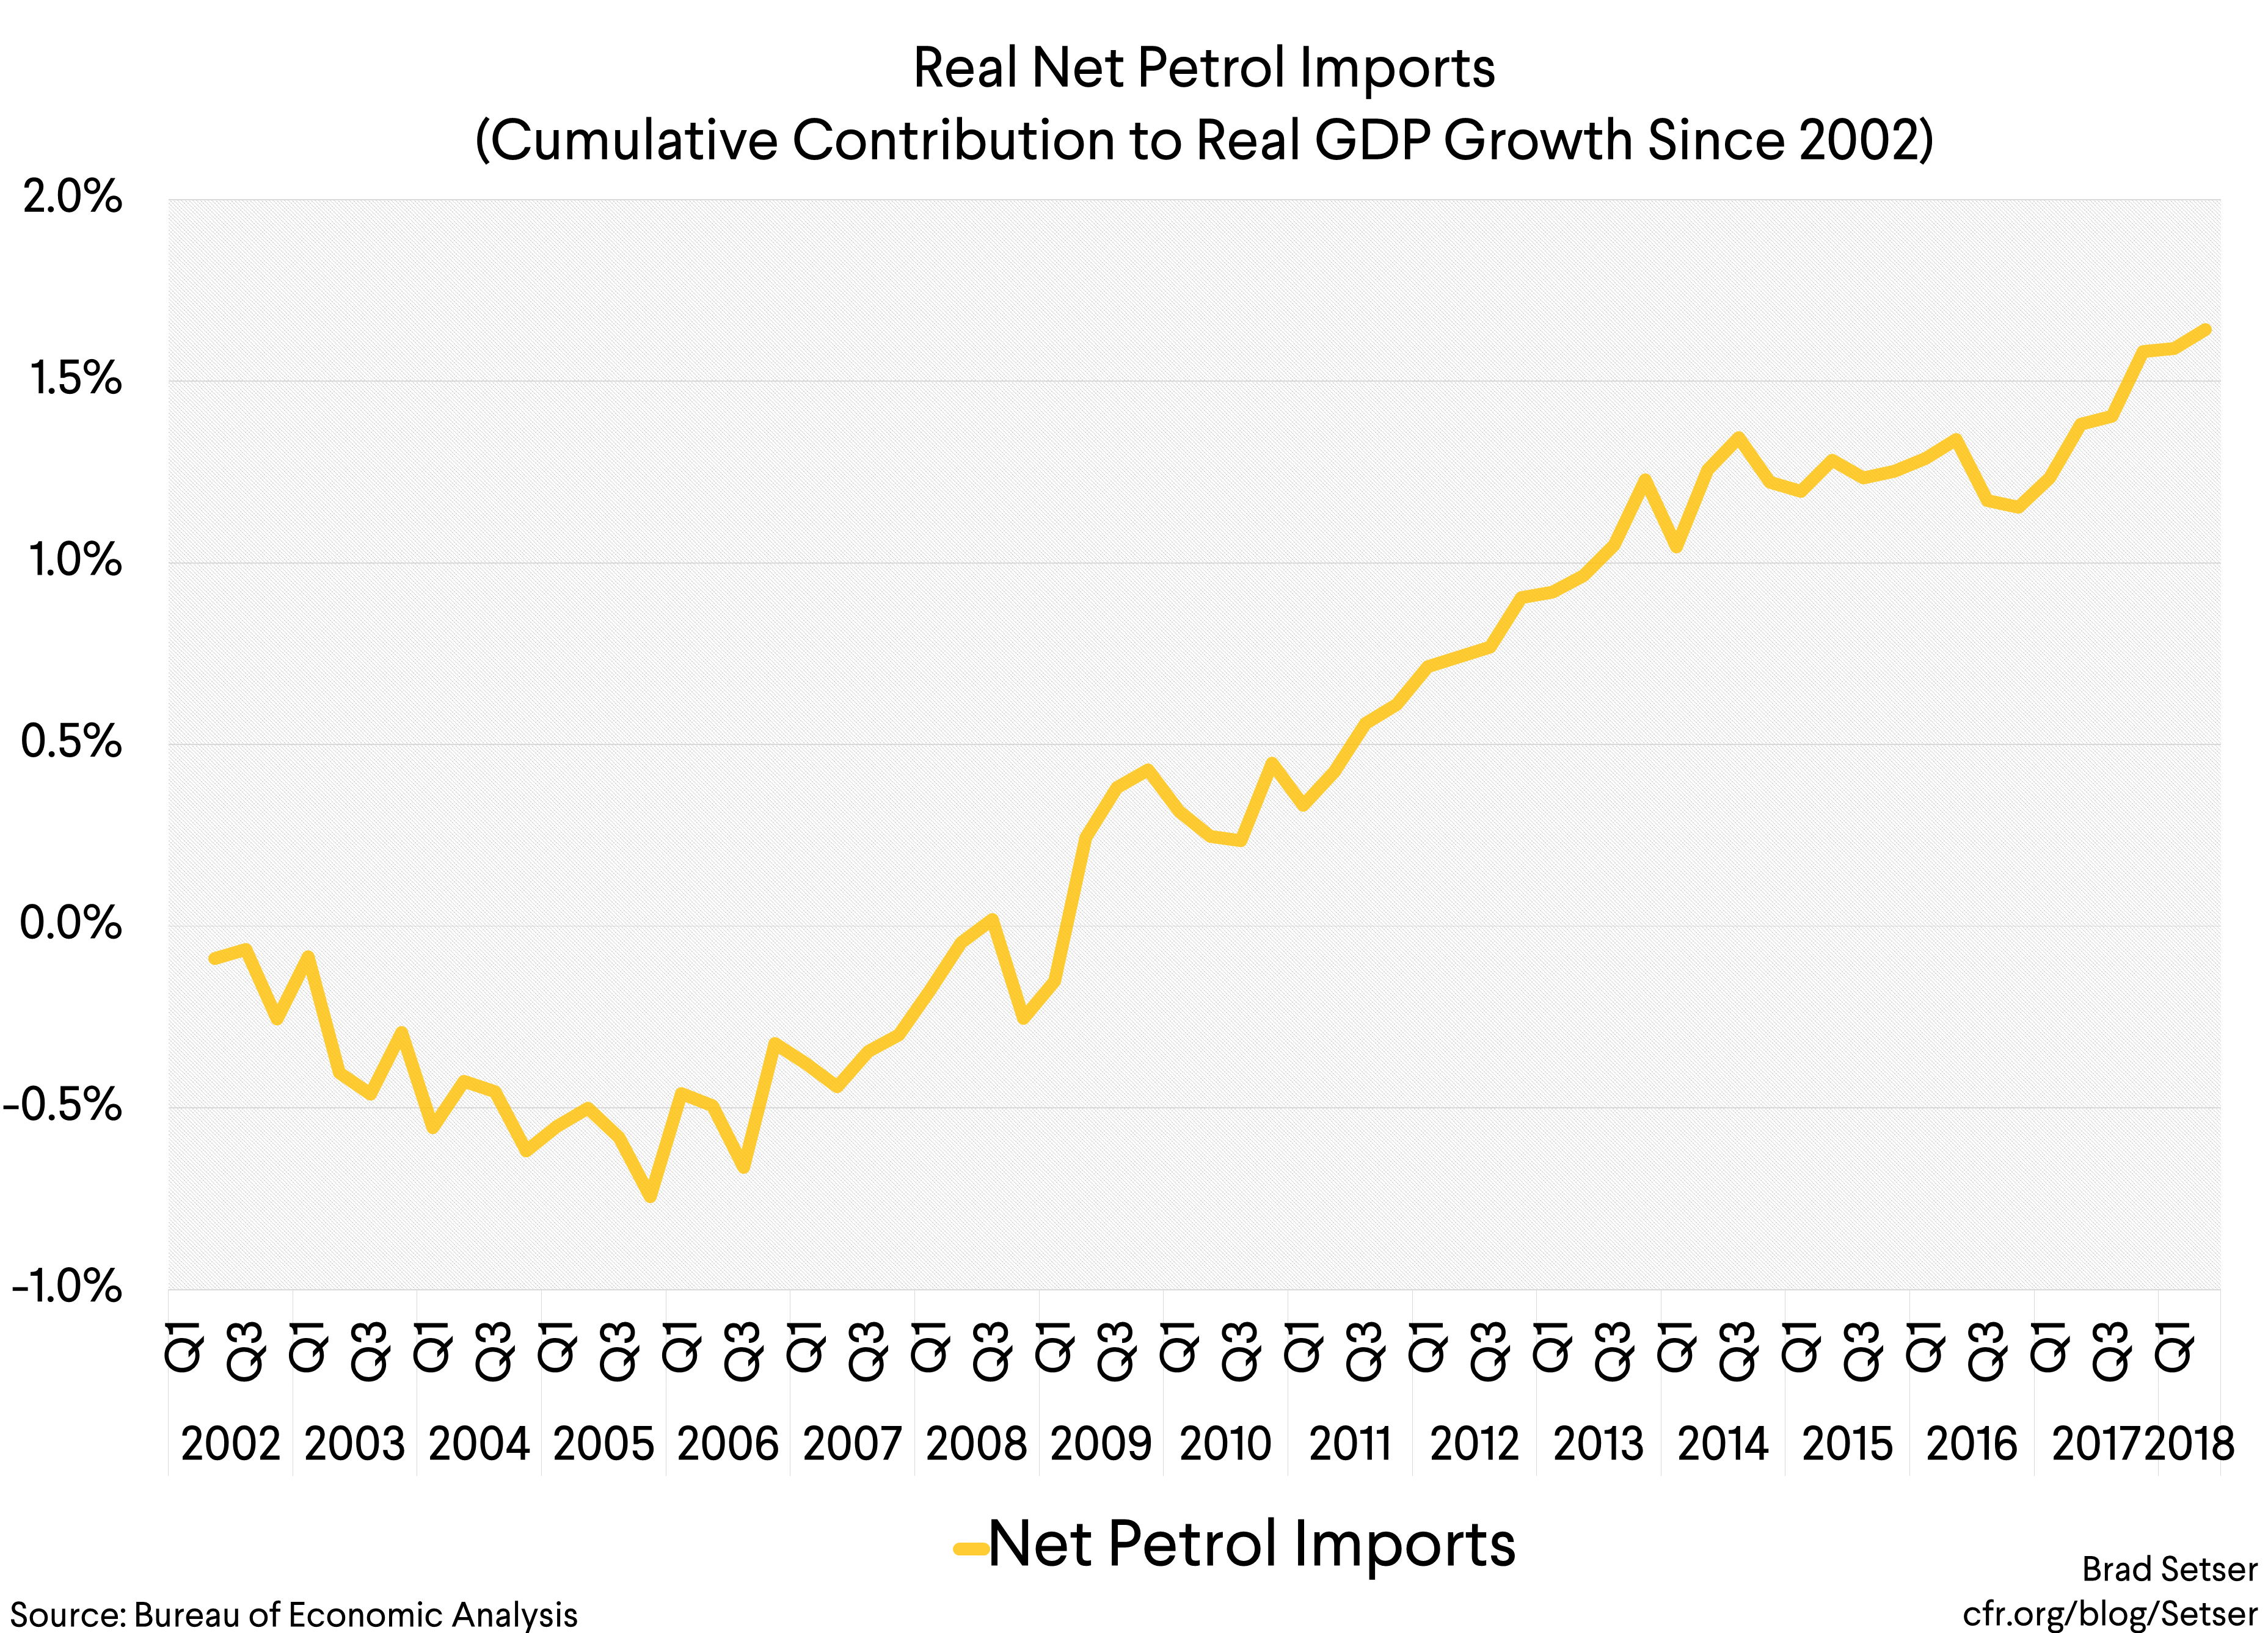
The improvement in the real petrol balance over the last six quarters has been about 0.5 pp of GDP (based on cumulative contributions), roughly half the deterioration in the non-oil goods balance.
A payoff from Trump’s policy of “energy dominance”? Perhaps. But it is more likely a function of changes in the oil price, and the evolving cost structure of U.S. production. Fracking the Permian basin (in West Texas and New Mexico) has generated an amazing amount of oil, at a fairly low cost. The shale boom started under Obama—not under Trump—and it was initially propelled by a combination of a high global oil price, a weak dollar, and good old-fashioned American ingenuity.
The dominance of macroeconomic factors extends to one other component of the trade balance—tourism (tourism generally accounts for the bulk of the U.S. services surplus with East Asia; many other services, alas, seem to be exported primarily to tax havens***).
U.S. tourism imports (Americans taking vacations abroad) rise when the dollar is strong— and U.S. tourism exports (foreign tourists visiting the U.S.) tend to grow when the dollar is weak (e.g. 2005 to 2014).
Trump’s more restrictive immigration policies have added some friction at the border no doubt. But the “stop” in tourism exports actually came in early 2015, six quarters before Trump (and a couple of quarters after the dollar moved).
![[Graph 4] Tourism Exports and the Dollar](https://static.cfr.org/sites/default/files/styles/large_s/public/image/2018/10/%5BGraph%204%5D%20Tourism%20Exports%20and%20the%20Dollar_0.png)
One final point: I framed this as an argument that Trump’s trade policy hasn’t had the expected effect on the trade balance, as the evolution of the trade balance has been driven by macroeconomic factors—the dollar’s strength, U.S. demand growth, and foreign demand growth. It equally could be presented as an argument that the overall macroeconomic effect of Trump’s coming tariffs will be fairly modest so long as the Fed is free to react to any drag on U.S. activity from the tariffs. The aggregate effect on the economy of even relatively aggressive trade action—as Goldman Sach’s economic research team has argued—ends up being fairly small in a standard macroeconomic model, absent a mistake by the Fed or a shock to “confidence.” The sectoral effect, of course, remains significant (ask soybean farmers in the Dakotas). And, well, it is also worth remembering that the impact of the tariffs on China would also be expected to induce changes in China’s policy mix. If China responds by using fiscal policy to stimulate domestic consumption demand, that’s good for the world. But it stabilizes output by loosening monetary policy, that would typically be expected to result in a weaker currency —which would offset some of the impact of the tariff on China while shifting some of the pressure over to China’s trade partners.
* Over the grand course of time, the contribution of exports and imports should generally balance out (no country can run a large trade deficit forever, though it is possible to run a modest trade deficit over time so long as the interest rate on a country’s external borrowing is modest). A symmetric expansion of trade, if it reflects the healthy development of comparative advantage, raises the overall level of output as both partners specialize in what they do best. Such dynamic gains are by definition not captured in an analysis of the contribution of trade in the national income and product accounts. The national income and product accounts instead draw attention to the impact of trade on demand, and what matters there is the growth of exports relative to imports. Broadly speaking, what the trade data shows is that the U.S. has increasingly specialized in the production of goods and services for the domestic economy, rather than specializing in the production of goods and services for the global market. A drag on demand from trade has a much more negative overall economic impact if it comes at a time when overall demand is weak.
** The q2 data was heavily influenced by both changes in the petrol balance and changes in the food and feeds balance. In fact, the petrol and the “soybean” surge (measured in the food and feed balance) account for the entire increase in U.S. exports in q2. The available data suggests that the surge in soybean exports will reverse itself, but not likely until q4. For my forecast, I assumed 2018 q4 exports fell back to their q4 2017 level. They may be optimistic.
![[Graph 6] Real Net Exports](https://static.cfr.org/sites/default/files/styles/large_s/public/image/2018/10/%5BGraph%206%5D%20Real%20Net%20Exports.png)
*** I am only partially joking. Ireland is the number one destination for a lot of IPR related service exports, the Caribbean is the number one destination for exports of financial services. See tables 2.2 and 2.3 in the BEA’s services trade data.