Trends in U.S. Military Spending
- Dinah WalkerAnalyst, Geoeconomics
Military budgets are only one gauge of military power. A given financial commitment may be adequate or inadequate depending on the number and capability of a nation’s adversaries, how well a country invests its funds, and what it seeks to accomplish, among other factors. Nevertheless, trends in military spending do reveal something about a country’s capacity for coercion. Policymakers are currently debating the appropriate level of U.S. military spending given increasingly constrained budgets and the winding down of wars in Iraq and Afghanistan. The following charts present historical trends in U.S. military spending and analyze the forces that may drive it lower.
These charts draw on data from the Stockholm International Peace Research Institute (SIPRI) and from the U.S. Bureau of Economic Analysis (BEA). Both data sets include spending on overseas contingency operations as well as defense. This distinguishes them from data used in the U.S. budget, which separates defense spending from spending on overseas operations.
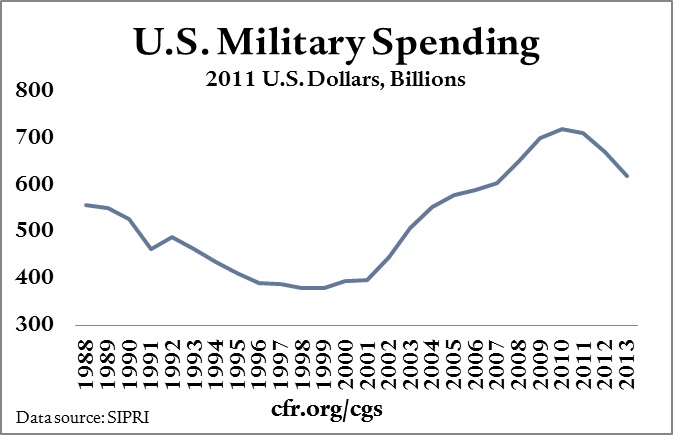
- In inflation-adjusted dollars, SIPRI’s measure of U.S. military spending rose sharply after the terrorist attacks of 2001.
- In calendar year 2013, military spending declined from $671 billion to $619 billion, in constant 2011 dollars.
- In dollar terms, this was the largest decline since 1991.
- The reduction in U.S. operations in the Middle East and the sequester mean this figure is likely to fall again in 2014.
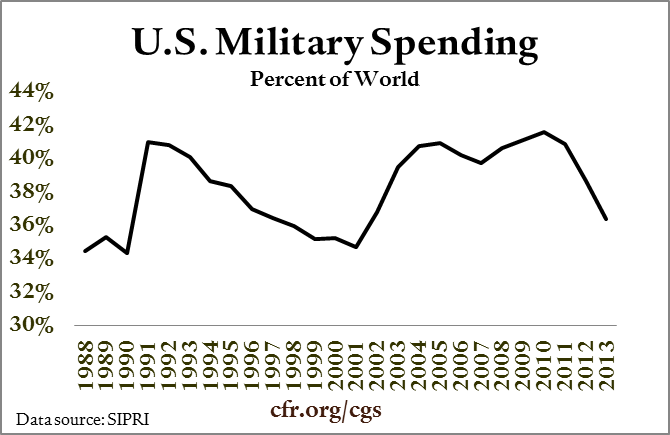
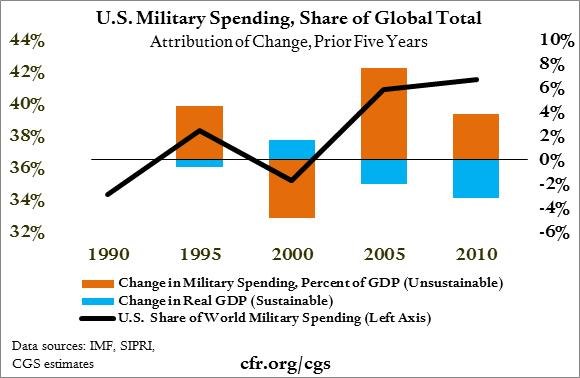
- When U.S. inflation-adjusted military spending fell by one-third in the 1990s, the U.S. share of global military spending only fell by six percentage points because other countries, particularly Russia, reduced their military spending as well.
- The 8 percent fall in U.S. military spending in 2013 resulted in a two percentage point fall in the global share, as military spending by the rest of the world increased 2 percent.
To see why U.S. military spending is likely to keep falling as a share of global military spending, it helps to look at the drivers of this ratio. For any country, a change in military spending as a share of the global total can be attributed to two factors: changes in income and changes in the allocation of that income. A rising share of global military expenditure based on a rising share of global GDP (gross domestic product) is likely to be more sustainable over the long term than an increase based on a decision to spend more of GDP on defense at the expense of other priorities. The following charts distinguish between the impact of growth and the allocation of income on the U.S. share of global military spending.
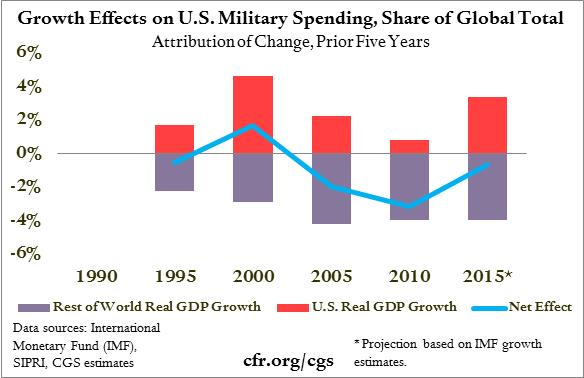
- From 1990 to 2000, U.S. growth roughly kept pace with global growth. So the impact of U.S. growth on the nation’s share of global military spending (represented by the red bars) offset the impact of rest-of-the-world growth (represented by the purple bars). As a result, the net growth effect, shown by the blue line, was close to zero.
- Over the past ten years, faster foreign growth has reduced the U.S. share of global military spending.
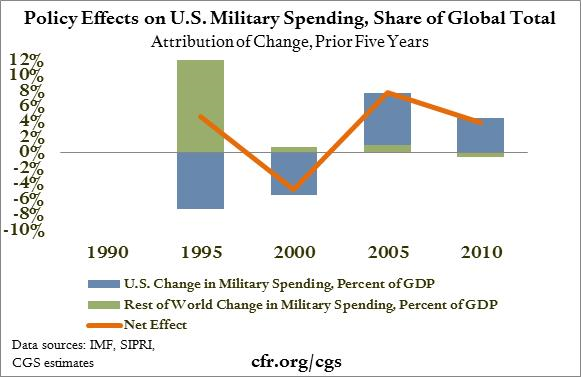
- The impact of growth on military budgets, shown above, has been disguised by shifting policy on how much of GDP to allocate to defense.
- In the 1990s, the United States cut the defense budget (shown in the blue bars), whereas from 2000 to 2010, the defense budget increased.
- Between 1990 and 1995, cuts in foreign allocation of GDP to defense (especially in Russia) boosted the U.S. share of total military spending (the green bar). Since 1995, the rest of the world has spent a fairly stable share of GDP on the military.
- Combining the two previous charts, it is clear that changes in spending as a percentage of GDP have buoyed the U.S. share of world military spending, while changes in GDP have been a headwind.
- A decline in the U.S. share of world military spending seems likely in the absence of a new sense of insecurity.
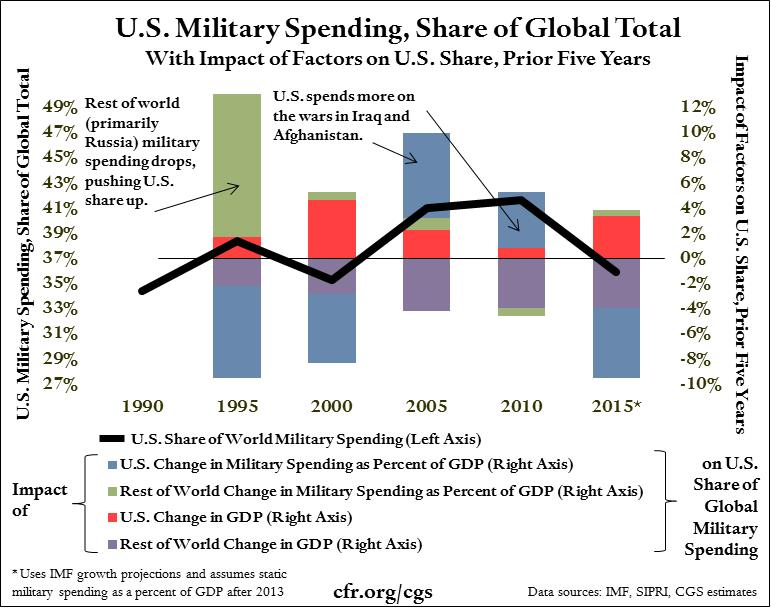
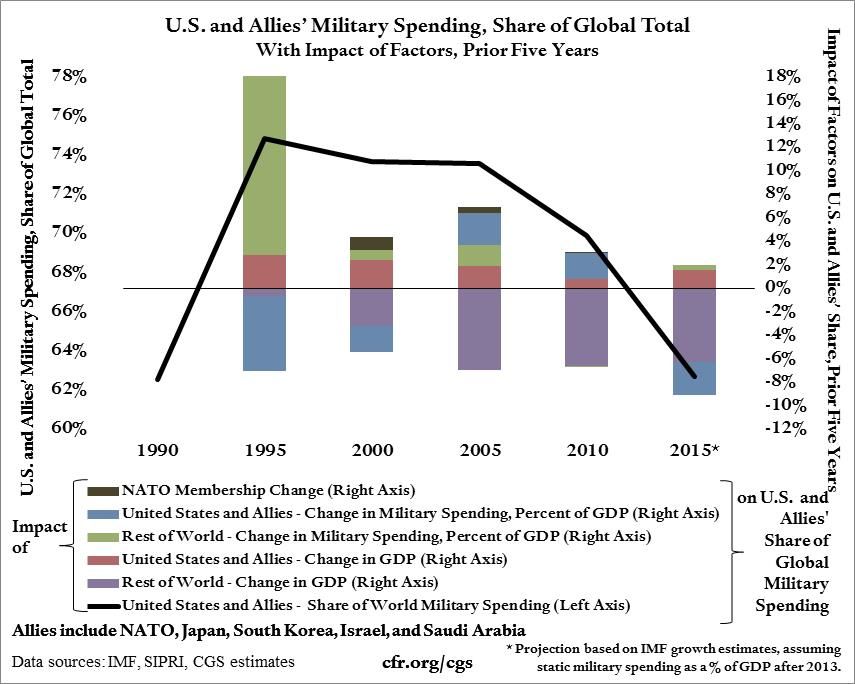
The next chart consolidates the information from the previous three images. The black line shows the U.S. share of world military spending at five-year intervals, while the bars show what drove the change during each five-year period. The blue bars show how willing the nation has been since 2000 to spend a rising share of GDP on defense. Even if one assumes this commitment holds steady in the next two years, and if one uses International Monetary Fund growth estimates, the U.S. share of military spending is set to decline as U.S. GDP growth (represented by the red bar) is lower than that of other military powers (represented by the purple bar).
If the United States decided to spend a smaller share of GDP on the military, the black line on the previous page would decline more sharply still. How likely is this? The following three charts show how U.S. overseas operations have been shrinking and that they are likely to continue to do so.
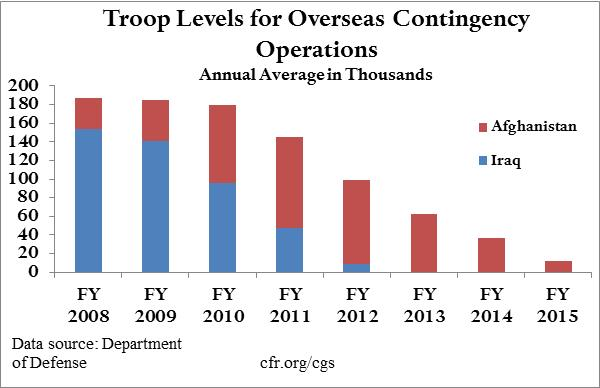
- In fiscal year (FY) 2008, there were 154,000 troops in Iraq and 33,000 troops in Afghanistan.
- The FY 2015 request is for an average of 11,661 troops to be in Afghanistan over the course of the year.
- The number of troops in Afghanistan is set to reach 9,800 at the end of December 2014.
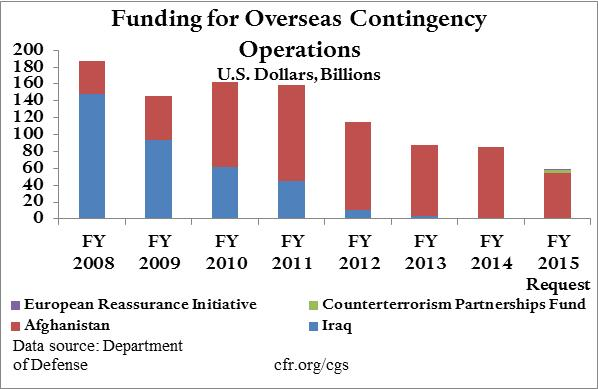
- Overall funding for overseas contingency operations has declined by just over 70 percent since 2008 as the war in Iraq has wound down.
- Funding for Iraq and Afghanistan was as high as $187 billion in FY 2008, which represents 30 percent of SIPRI’s measure of U.S. military spending for that year.
- The FY 2015 budget request for overseas contingency operations is $58.7 billion.

- The FY 2015 request for funding for overseas contingency operations (OCO) is $26.6 billion less than the 2014 enacted level.
- The decrease in funding is greatest for operations/force protection in Aghanistan, which will decline $15.2 billion in FY 2015.
- The FY 2015 request includes funding for two new initiatives, a Counterterrorism Partnerships Fund and funding for the European Reassurance Initiative.
The following charts provide some historical perspective on military spending.
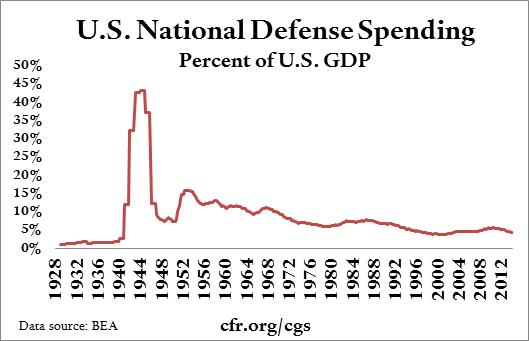
- U.S. national defense spending has ranged widely, from less than 1 percent of GDP in 1929 up to 43 percent in 1944. These extremes illustrate that resource allocation to defense can increase rapidly when a war demands it.
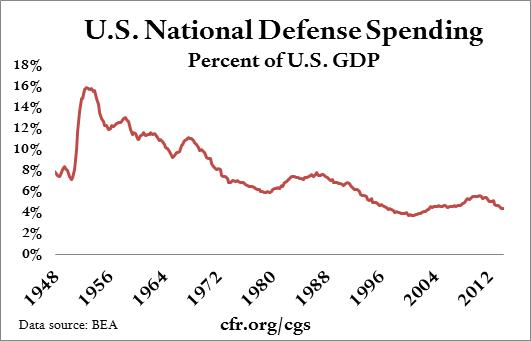
- Focusing just on the post-World War II period, U.S. national defense spending as a percent of GDP has ranged from a high of 15 percent in 1952 (during the Korean War) to a low of 3.7 percent in 2000 (the period of relative tranquility preceding the terrorist attacks of the following year).
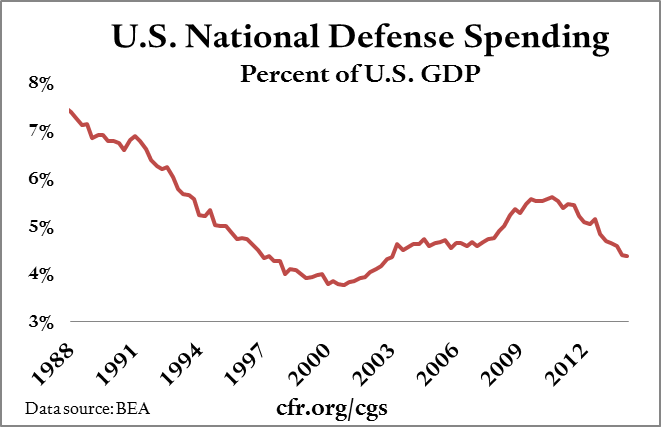
- In the post-Cold War world, the U.S. national defense budget has fluctuated within a relatively narrow band. It fell by about three percentage points of GDP as the nation reaped the peace dividend of the 1990s, then rose after the terrorist attacks of 2001.
- President Barack Obama’s budget proposes cutting security spending to 2.3% of GDP in 2024. This would represent the lowest allocation of GDP to defense spending in the post-World War II era.
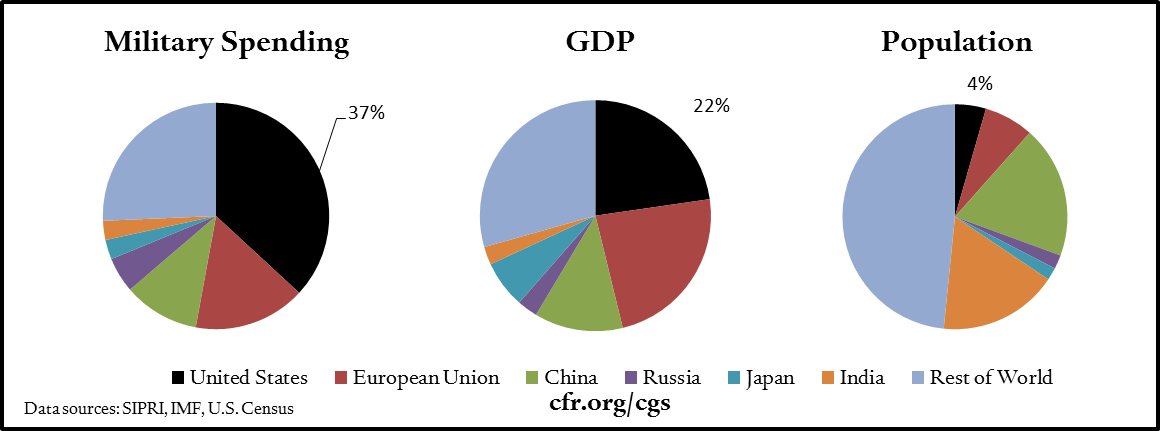
To put U.S. military spending in context, consider GDP and population shares relative to the rest of the world, as of 2013. The pie charts demonstrate that the United States accounts for a larger share of global military spending than of either GDP or population, and would continue to even if military spending were to revert to 2000 levels as a percent of GDP.
As noted at the outset, military power depends on multiple factors, including the military budgets of a country’s allies. To get a sense of this factor, the chart from page four was redone, with spending by NATO, Japan, South Korea, Israel, and Saudi Arabia added to the analysis. The United States and these allies account for a formidable 75 percent of global military spending in 1995. However, as the black line in the chart shows, the trend is less reassuring. The United States‘ and its allies’ share of world military spending fell from 2005 to 2010. It is projected to fall further, to 63 percent by 2015, even if U.S. spending as a share of GDP holds up at today’s levels. Budgetary pressures in Europe may mean this share falls even more rapidly.
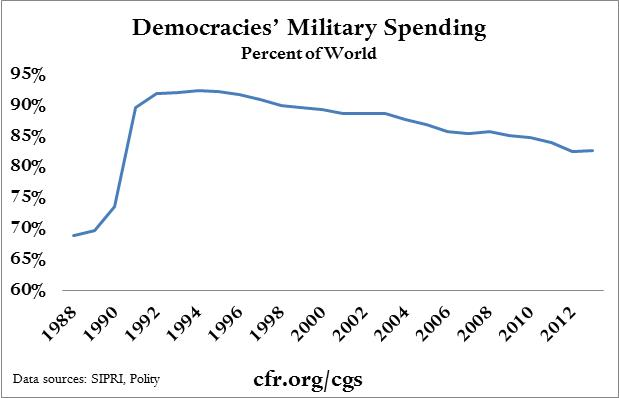
- Democracies are generally regarded as friendly to the United States, and this chart delivers a verdict similar to the last one.
- After the collapse of the Soviet Union, democracies accounted for the vast majority of the world’s military spending.
- However, this share has declined steadily over the past two decades.
- In 2013, U.S. military spending fell faster than overall military spending by democracies.
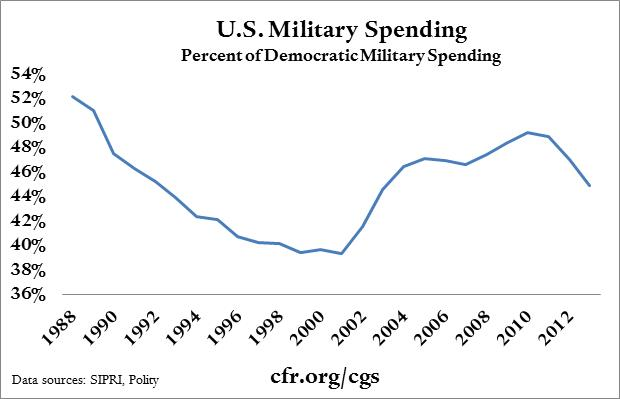
- However, the United States continues to account for almost half of all military spending by democracies.
- A decline in U.S. military spending is therefore likely to have a large impact on democracies‘ military spending as a share of the global total.
What would happen if the U.S. defense budget were cut? Differences in military spending among countries tend to have a big influence on equipment procurement and a far smaller one on personnel count.
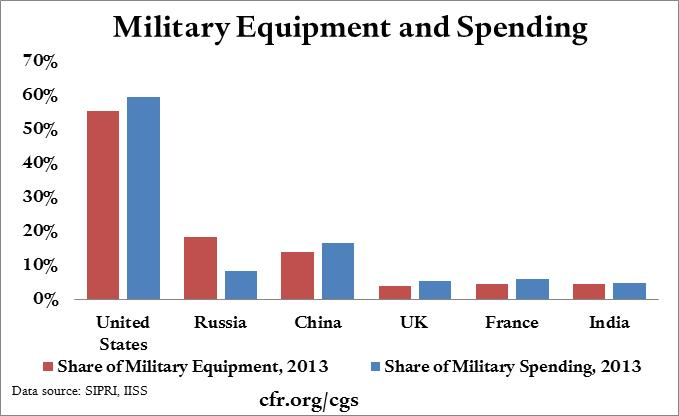
- This chart compares each country’s share of spending and share of military equipment. The equipment measure includes twenty-one categories such as tanks, aircraft, and satellites.
- Spending and equipment levels are correlated. Russia is the exception, perhaps because it still has equipment left over from its period of high spending before 1990.
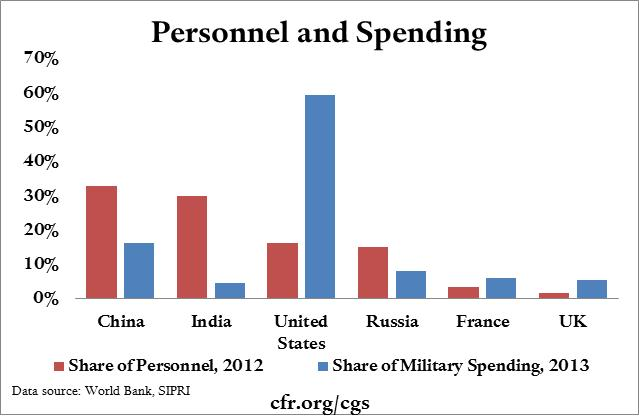
- Unlike equipment, personnel is relatively uncorrelated to spending.
- Because of differences in labor costs, $1 million in the United States will hire fewer soldiers than $1 million in Russia or China.
- If military budgets were compared in a way that reflected varying personnel costs, U.S. military preeminence would appear smaller than it does using straightforward comparisons based on market exchange rates.
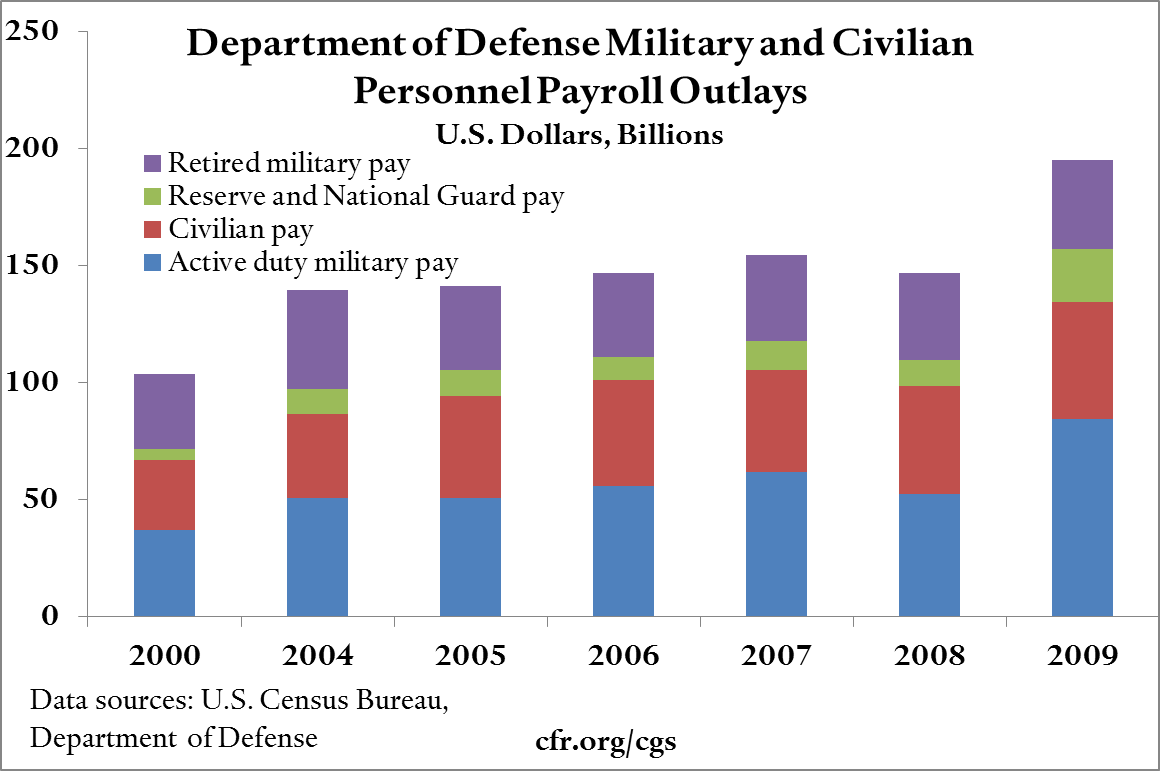
- The effect of defense cuts on personnel would depend on which part of personnel spending decreases.
- Of the $195 billion in Department of Defense payroll outlays in 2009, only $84 billion went to active-duty military pay.
- Retired military pay, which does not directly increase defense capabilities, accounted for nearly 20 percent of total personnel expenditures in 2009.
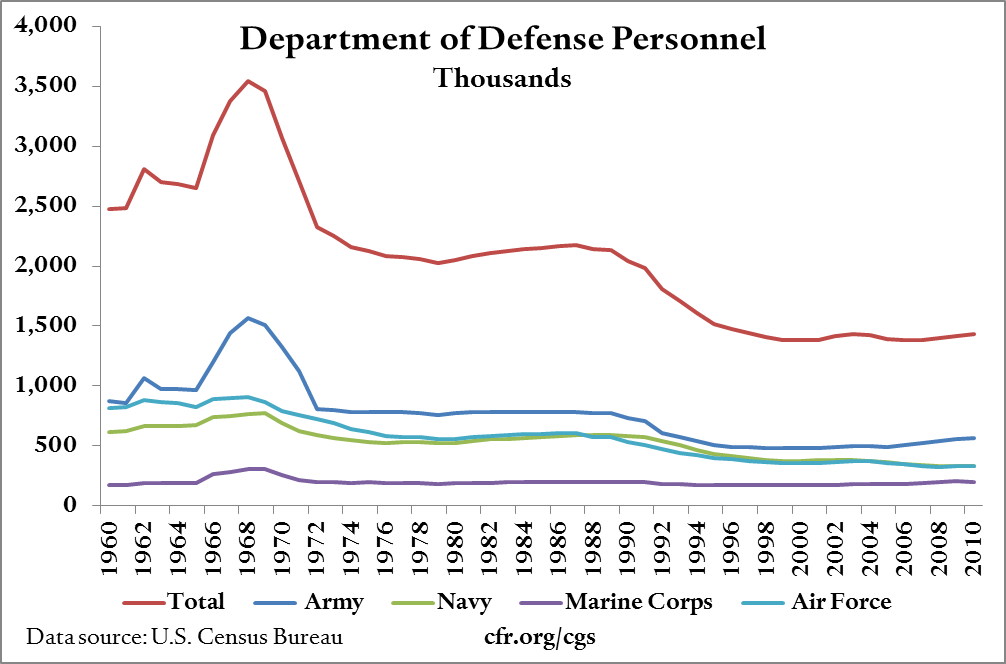
- The number of personnel employed by the Department of Defense has declined since the 1960s, while personnel costs have risen rapidly, in part due to rising U.S. health-care costs.
- In the base budget, the cost of military pay and benefits has risen almost 80 percent since FY 2001, while the active-duty and reserve personnel count has declined by almost 6 percent.
- Military health care costs have risen from $19 billion in FY 2001 to $47.4 billion in FY 2015.
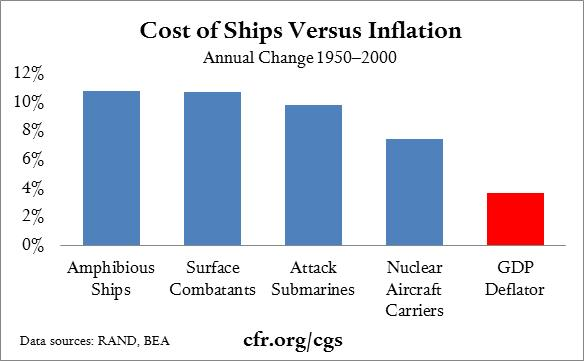
- The cost of military hardware has grown more than inflation. Today’s spending results in less procurement than did past spending.
- Although the rising cost of hardware partly reflects rising quality, shipbuilders reported to the RAND Corporation that uncertainty surrounding the number of ships ultimately purchased increases labor costs and reduces the incentive to invest in processes that could reduce costs.
Explore Our Other Chart Books
 Report
 Report
 Report
 Report
 Report
 Report