Do Not Overlook the December Trade Data
The increase in the non-oil trade deficit in December should be getting more attention. It matters more than the year-over-year rise in the 2017 trade deficit.

Most reporting on the latest trade data release has focused on the increase in the annual trade deficit—and in particular the political consequences of the rise in the bilateral deficit with China.
That makes some sense.
The annual numbers are pretty much baked in by the time the December release comes along so the basic plot line is already set, and Trump has made trade generally and the bilateral balance with China specifically a yardstick of sorts.
But it in this particular case, it would be a mistake to ignore the high frequency signal in the December numbers. The rise in the underlying (e.g. real) trade balance in December, and indeed all of q4, is of greater economic significance than the change in the headline trade balance for 2017.
A bit of context.
The monthly real non-petrol goods deficit (real means that it represents the “volume” of trade—it is measured in a way that in principle means that price changes shouldn’t have an impact) was pretty constant at around $60 billion a month for the first 9 months of 2017. It then increased significantly in q4. The monthly real non-petrol deficit rose from around $60 billion (annualized, a bit over $700 billion) in September to around $65 billion in October and November.
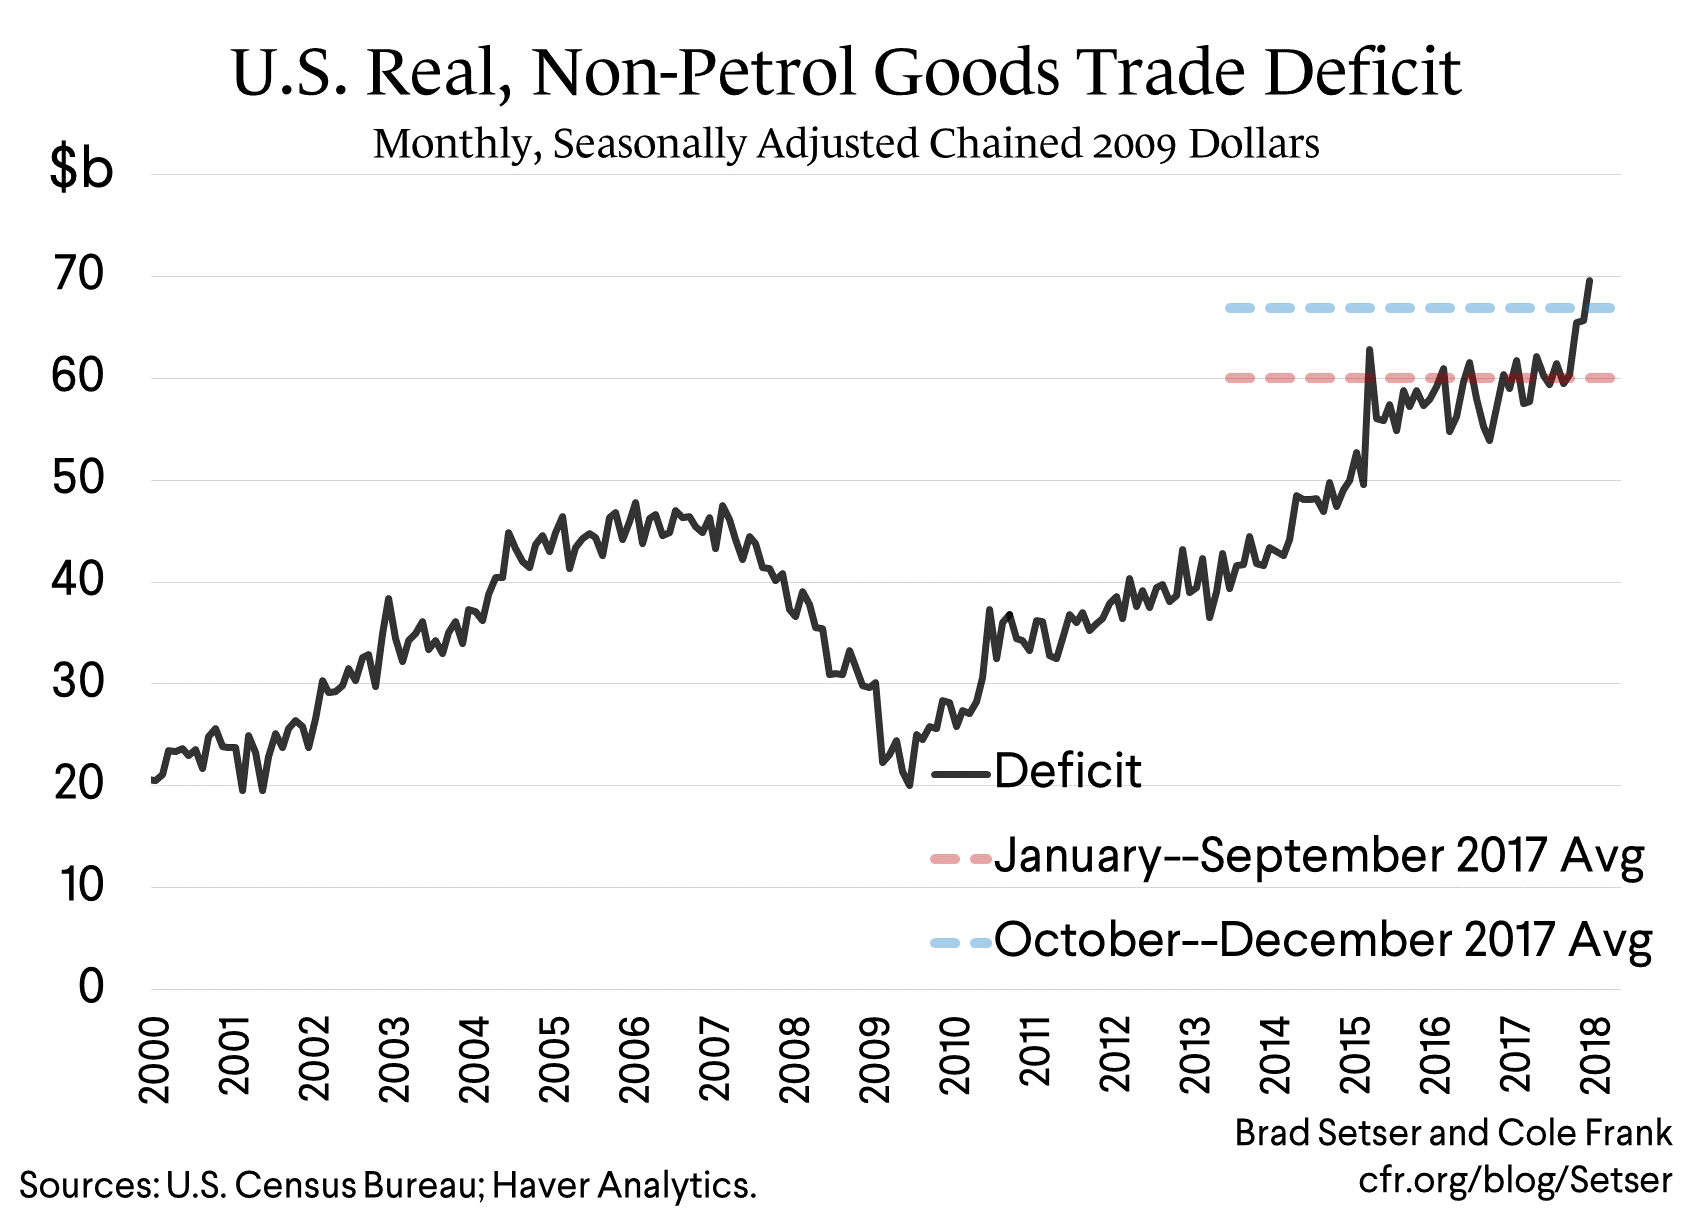
The trade data tends to mean revert a bit—so all other things equal, the December deficit would have been expected to fall.
That did not happen: the real non-petrol deficit gapped out further, to almost $70 billion a month in December—or an annualized monthly deficit of well over $800 billion.* (The numbers for the real non-petrol balance come from exhibit 11 of the monthly trade data release; for the nominal balance see exhibit 9.)
Plug that into any formula for estimating the impact from net trade in the national income accounts for q4 and you will get a huge drag. The September to December change in the annualized non-petrol balance was over $100 billion, and the q/q numbers get magnified in the quarter over quarter numbers. I think the September to December swing on a q/q annualized basis would be close to $400 billion—versus real GDP of a bit more than $17 billion.
Of course, the actual numbers won’t be as dramatic.
The GDP numbers are—reasonably—based on the average for q4 not the December number. And the swing in the non-petrol balance was offset a bit by the improvement in the petrol balance in q4—a trend that is likely to continue).**
Using the quarterly averages and including petrol, the change in the (annualized) quarterly trade balance was more like $240 billion, or about1.5 percentage points of GDP (do note that all these changes are quarterly changes annualized, which magnifies them—projecting the q/q drag out at a constant pace would be a massive mistake).
From a technical point of view, there is nothing worse than a rise in the December real non-petrol goods balance, especially one that can be traced back to a strong rise in real consumer goods imports. The q1 v q4 seasonality in the global trade data is genuinely problematic. The timing of the pre-holiday surge in imports in the U.S. and Europe is shifting ever closer to Christmas and the (western) new year. And then in q1 China’s lunar new year has a big impact on the monthly data. We may need to wait until the March data comes out to have a clear sense of whether the December rise was a blip, or indicative of a new trend.
That said, the eurozone’s current account surplus increased a bit late in 2017. And China’s real export growth was quite solid in q4. The rise in imports in the U.S. in q4 seems very real.
And, unlike some, I think that matters economically not just politically.
All other things equal, it would be better if the impetus for global demand growth came from the world’s current account surplus regions, not from a current account deficit country like the United States—the U.S. does by now have a significant stock of external debt, and I still worry about global stock and flow imbalances.
And from a simple growth accounting point of view, the swing from basically no drag from net trade during the first three quarters of 2017 to a big drag in q4 will likely explain a large part of the swing in U.S. GDP growth. The underlying pace of demand growth in the U.S. has actually been pretty steady since the end of 2013—with domestic demand (looking at the cumulative change between any given quarter and the same quarter a year prior) generally strong enough to support a pace of growth of around 2.5 percent. The drag from net exports was a major reason why the 2014 to 2016 headline growth numbers weren’t stronger. The absence of a drag from net exports helped support the strong q/q growth numbers in q2 and q3 of this year. And, barring more revisions, a large drag from net exports will pull q4 growth well below its pace earlier this year.
In other words, it seems like an unusually large share of the demand the U.S. generated in q4 bled out into the rest of the world. That was good for global growth, but not so good for U.S. growth.
And if you want a simple, short explanation for why the dollar weakened in January try this: the amount of funding the U.S. needed to cover its trade deficit rose just as investors concluded that Europe was growing as fast as the U.S. and the private outflow of capital from China faded.***
* A $10 billion swing in the monthly real non-petrol balance (a swing of more than 10 percent) in a three month period is actually quite large.
** The average price of imported oil in 2017 was about $10 above the average price in 2016—$46 a barrel versus $36 a barrel. And the price of imported oil is likely to rise a bit more in 2018, offsetting some of the fall in actual oil imports. And if you dig deep enough (look at exhibit 17a of the trade data), you can easily calculate that the average price is held down by the ability of the United States to import and refine heavy oil from Mexico and Venezuela (both sell to the U.S. at a bit of discount relative to the average price). And it is really held down by the price the U.S. pays for Canada’s trapped (and often heavy) oil, which is imported at quite a substantial discount. These details are part of what I like about the trade data.
*** My guess is that China’s central bank was a net buyer of foreign exchange in January. The indicators to confirm though aren’t yet available.