Understanding the U.S. Investment Income Balance (wonky)
The U.S. currently runs a surplus on investment income of about 1 percent of GDP, as the income on U.S. equity investment abroad (inflated by tax arbitrage) exceeds the interest the U.S. pays on its external debt. That surplus could shrink significantly as interest rates rise.

Paul Krugman notes that much of the expected rise in the U.S. current account deficit could come from a swing in the income balance—that is a swing in the amount of interest and dividends the U.S. pays to the rest of the world, net of what it receives.
I agree.
The income balance is one of those tricky bits of the current account.
The U.S. owes a fair amount of money to the rest of the world—gross external debt is over 80 percent of GDP, net external debt is about 50 percent of GDP. *
So you would expect the U.S. to on net be making payments to the rest of the world. And in fact, it is: interest payments to the rest of the world (largely on Treasury bonds) are just under 1 percent of U.S. GDP.
But the U.S. (famously) runs an overall surplus in the investment income account. And that is thanks to the excess return American firms earn on their direct investment abroad.
Some call this dark matter and find it mysterious. I tend to think it is a fairly straight-forward reflection of tax arbitrage—the return differential goes away if you net out the excess profits U.S. firms report in obvious low-tax jurisdictions—and thus fairly prosaic.
That said, the basic math on the income balance is pretty straightforward. I think you can get reasonably close with a simple calculation that uses just six round numbers:
1) The net external debt position of the U.S.—round it to 50 percent of GDP.
2) The interest rate on that debt (currently a bit below 2 percent on average, but poised to rise).
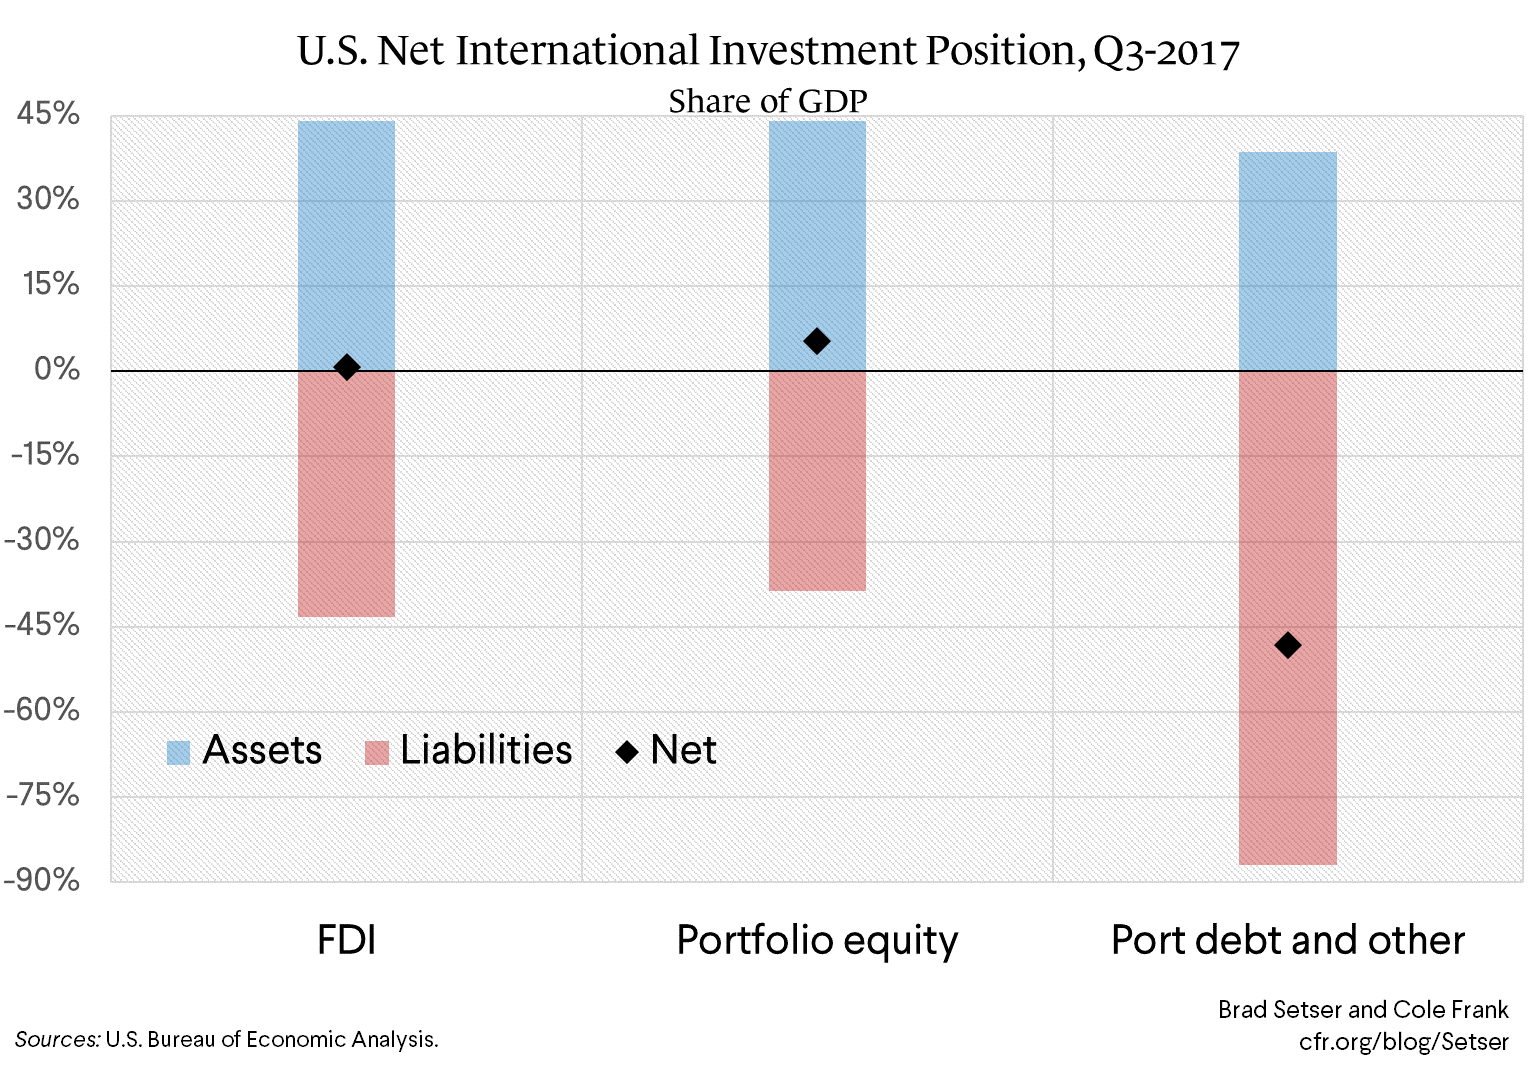
3) The gross stock of U.S. FDI abroad (a bit over 45 percent of U.S. GDP, which happens to also be close to the gross stock of FDI in the U.S.—but call it 50 percent to make the math easier).
4) The differential in return on U.S. direct investment abroad and foreign direct investment in the U.S. (about 3 percentage points).
5) The gross stock of U.S. portfolio equity investment abroad, which also happens to be close to the stock of foreign portfolio equity investment in the U.S.—call it 50 percent of GDP for simplicity (though that is rounding up from 40 to 45 percent).
6) And the return differential on equity dividend income (about a percentage point).
Thanks to rounding, the math is super easy: the U.S. pays 1 percent in interest (0.50 * 2 percent) but gets almost 1.5 percent of GDP in net dividend income on FDI (0.5 * 3 percentage points from the return differential) and another 0.5 percentage points of GDP from portfolio equity (0.5 * 1 percentage point from the return differential) hence an overall investment income surplus of around 1 percent of GDP.
And that also works out to be close to the actual number of 1.15 percent of GDP—though it works thanks to some aggressive rounding. In practice the U.S. pays a bit less than 2 percent on its external debt and thus its interest deficit is more like 0.8 percent of GDP, not 1 percent.
Let me explain each of the main components a bit.
Net external debt is the difference between U.S. borrowing from the world and U.S. lending to the world—it has increased over time in line with the U.S. current account deficit.
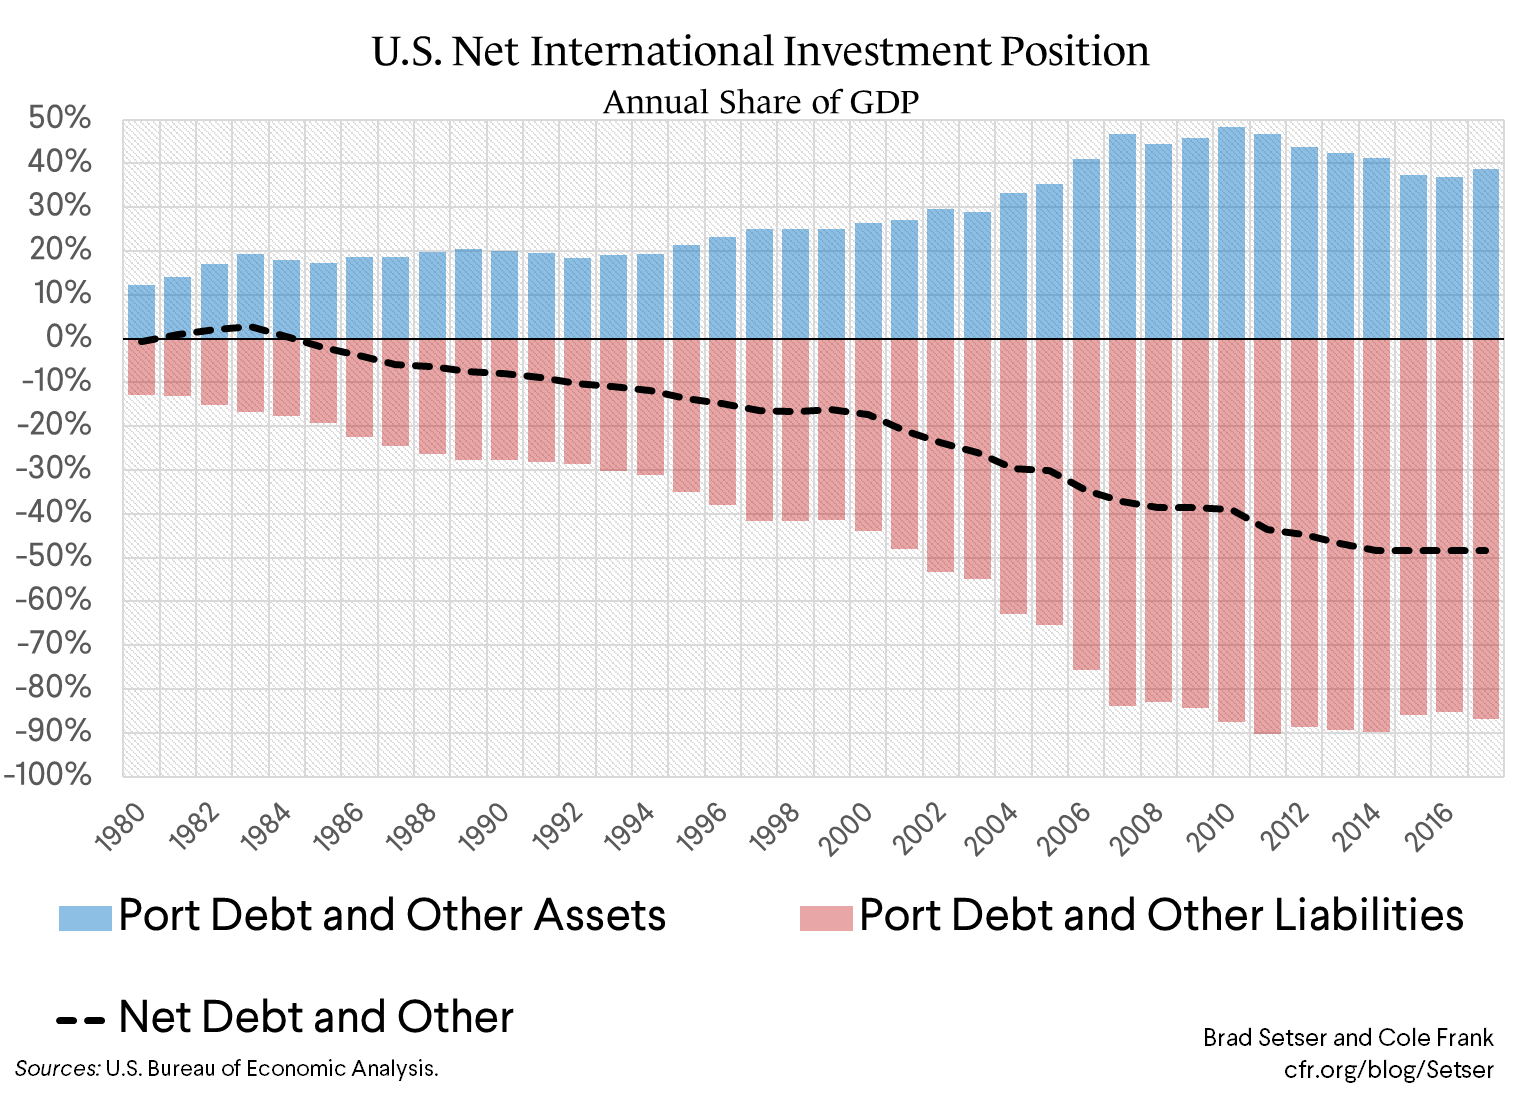
Right now the U.S. has borrowed somewhat more than 80 percent of its GDP from the world, and lent about 30% of its GDP to the world.
The vast majority of the funds that the rest of the world has lent to the U.S. are in dollars—thankfully, U.S. external debt would be a real problem if the U.S. had borrowed in someone else’s currency.
And the bulk of U.S. lending to the world is in dollars—almost all the short-term lending, and between 75 and 80 percent of the longer-term bonds that the U.S. has bought from foreign issuers are dollar-denominated (see exhibits 11 and 13 in the Treasury’s survey of U.S. portfolio holdings of foreign securities). **
As a result, there isn’t a significant difference in aggregate between the interest rate that the U.S. pays on its debts and what it earns on its lending to the rest of the world.
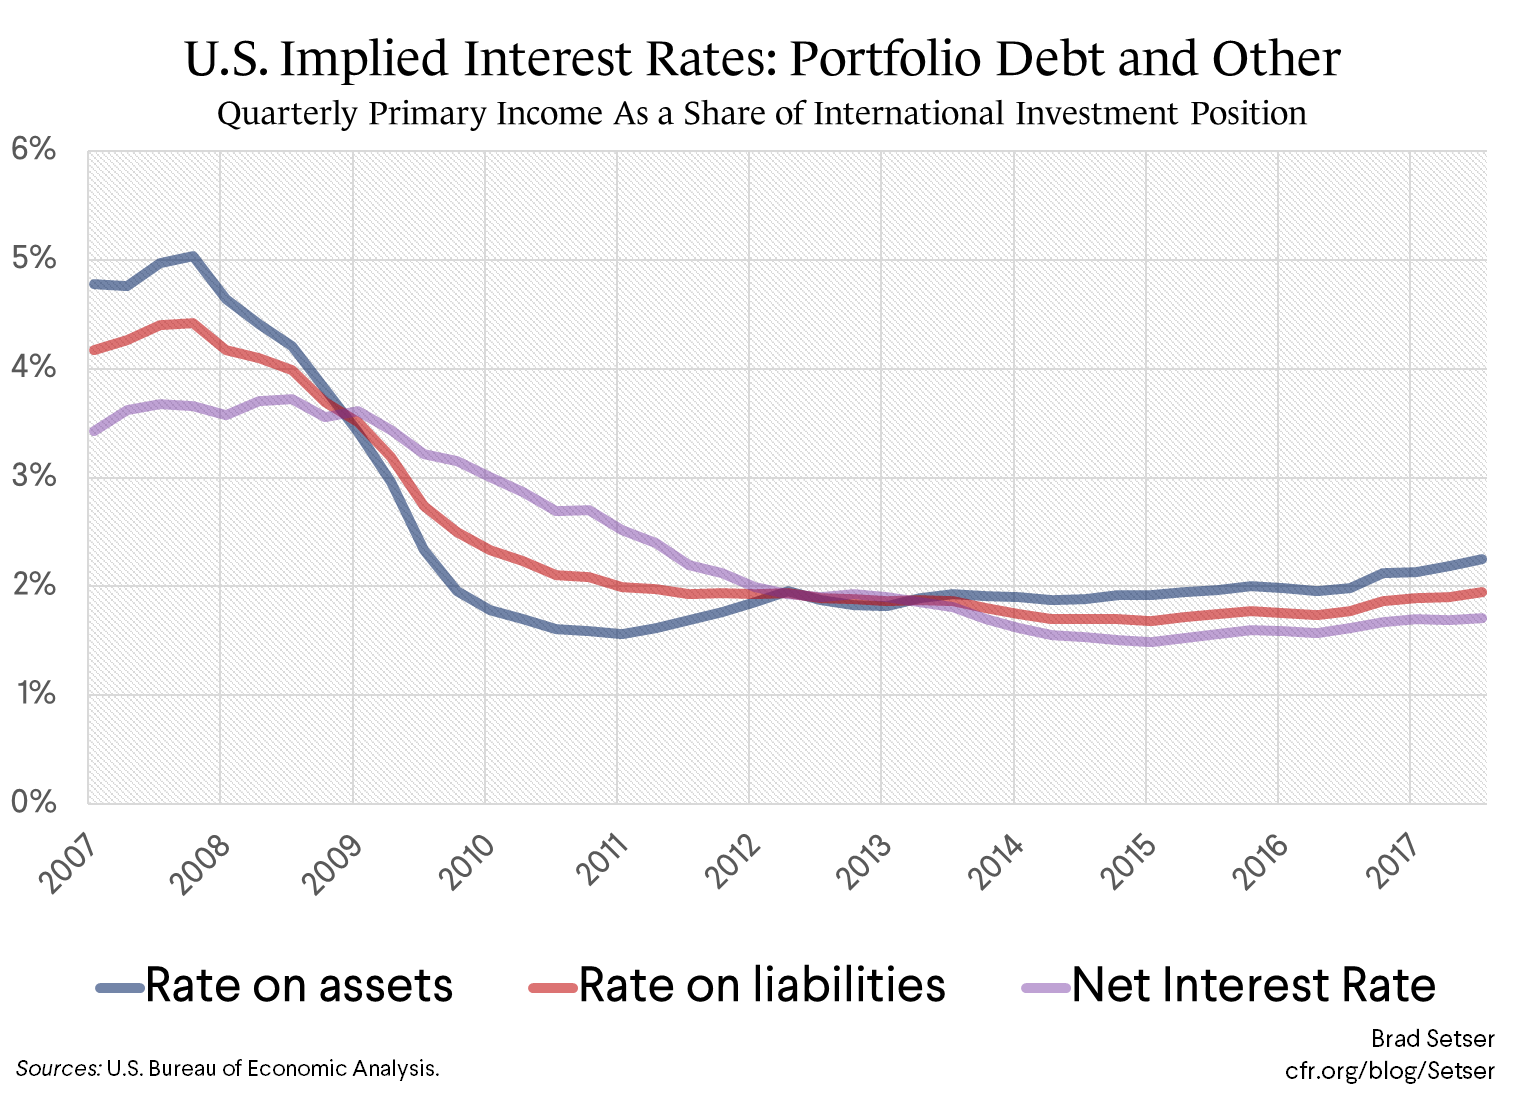
The interest rate on short-term borrowing and lending are close to the same.
The U.S. does get a higher interest rate on its long-term lending than it pays on average on its long-term borrowing: foreign bonds held by American investors pay a bit over 3 percent on average, while U.S. bonds held abroad pay around 2.5 percent.
But that difference goes away if you adjust for differences in the composition of U.S. and foreign holdings of bonds. U.S. investors who hold foreign bonds generally hold corporate bonds, not government bonds. Hence you can largely net out U.S. holdings of (mostly dollar-denominated) foreign corporate bonds against foreign holdings of (mostly dollar-denominated) U.S. corporate bonds. It turns out that the return foreign bond holders get on their holdings of corporate and agency bonds is pretty close to the return that American investors get on their foreign bonds.
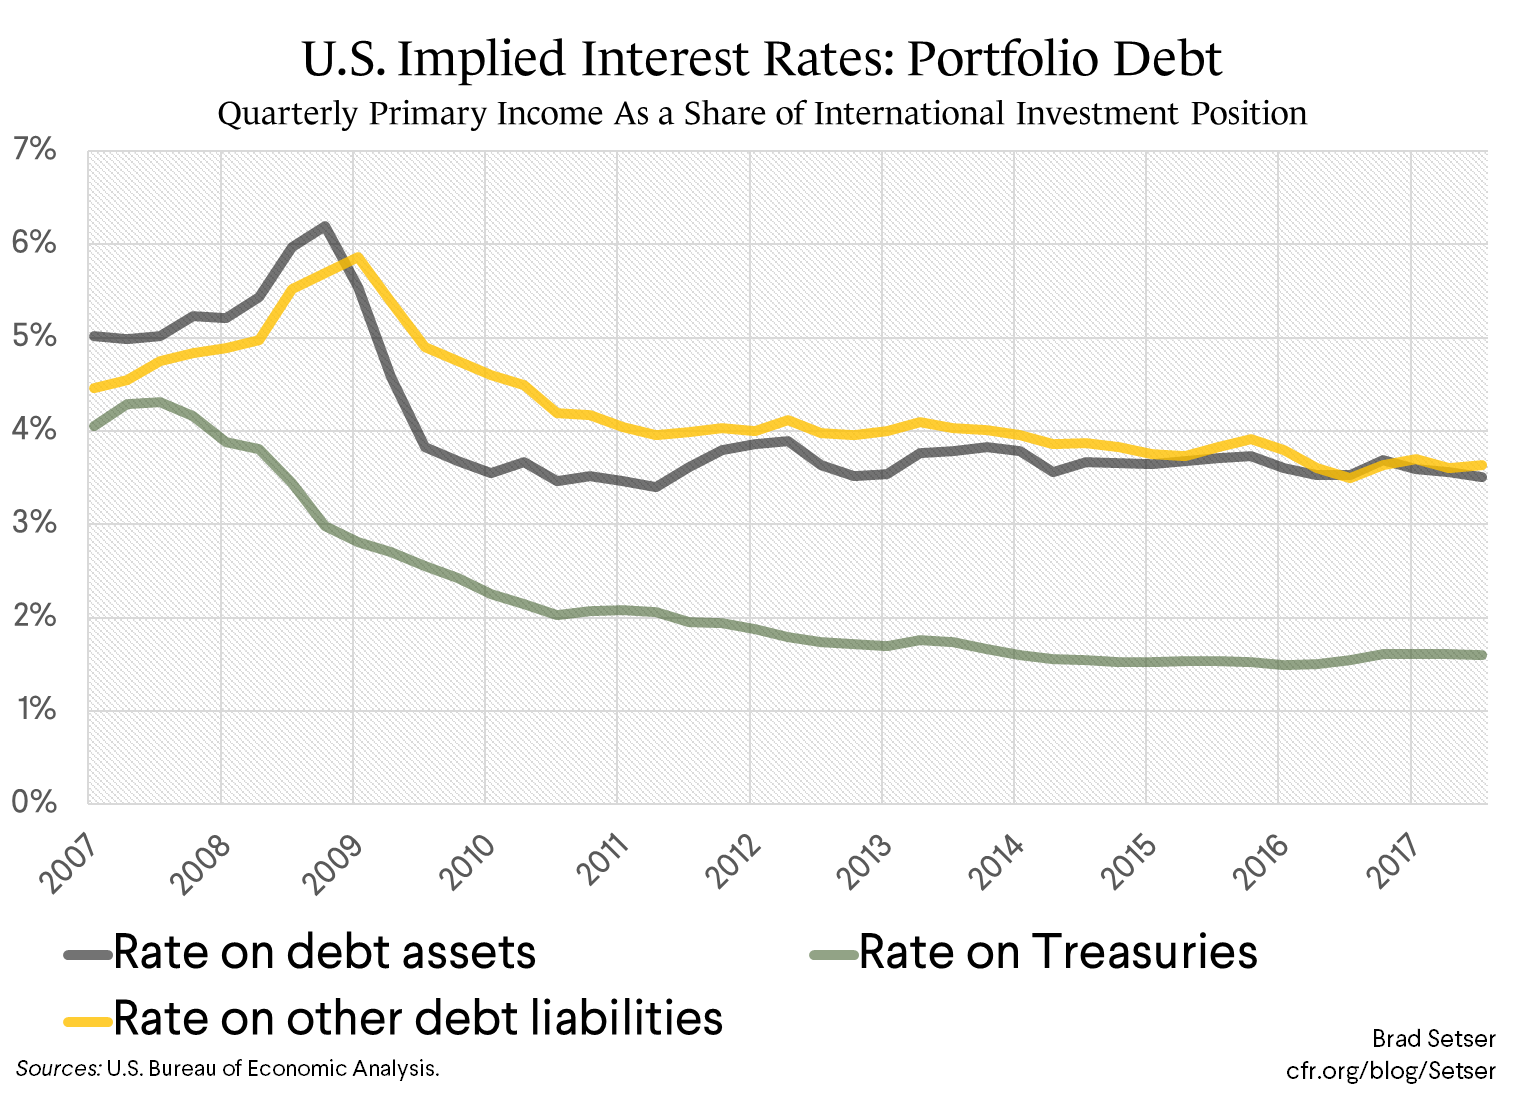
Thus I think you can legitimately net out much of the gross stock and focus on the net—and to the first order of approximation, the net is essentially composed of foreign holdings of Treasury bonds.
That makes the mental math much easier.
Now direct investment. The relative size of the stock of foreign direct investment in the U.S. and U.S. direct investment abroad (at market value) depends heavily on the exchange rate: when the dollar was weak, the U.S. had more direct investment abroad than foreigners had in the U.S. At the 2017 exchange rates, the stocks are more or less equal—though when the dollar is (truly) weak, the U.S. will have a bit more abroad than foreigners have in the U.S.
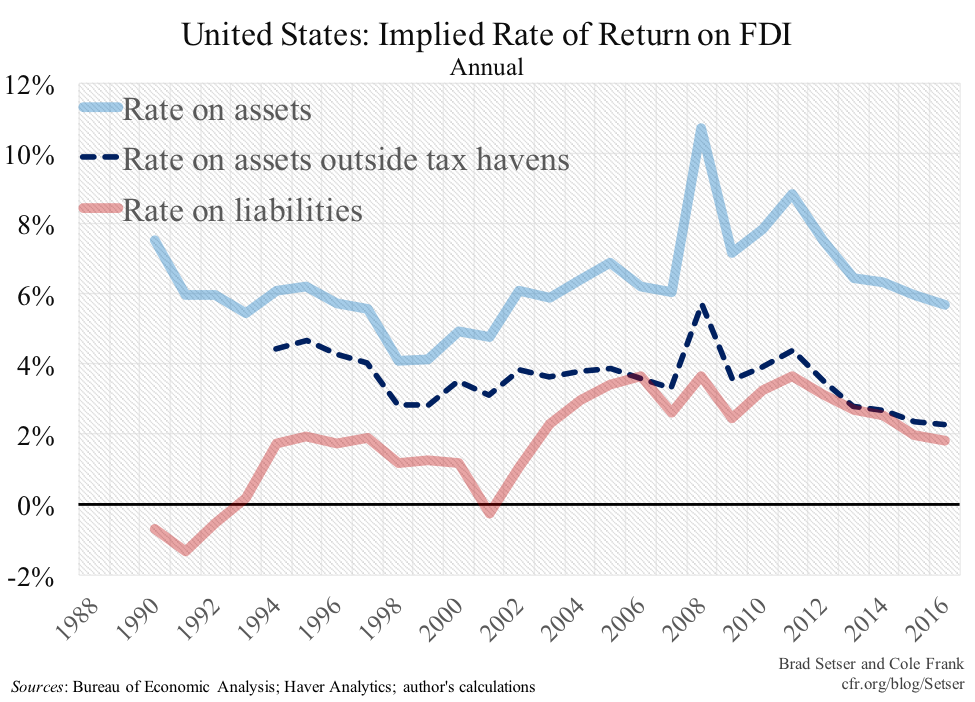
The surplus in the income balance thus primarily reflects a large return differential, not a major difference in the size of stock. The U.S. appears (based on the balance of payments data) to earn something like 6 percent on its direct investment abroad, while foreign investors earn more like 3 percent in the U.S.—and, well, the entire gap more or less comes from the earnings U.S. firms report in the seven main low tax jurisdictions.
I suspect that big tech and big pharma drive the data, and it has a lot more to do with the incentives the (old) U.S. corporate tax system created to shift profits abroad. There is a debate as to whether this will change with the tax reform—I personally don’t think it will, but it is an open question.
Finally, as Paul Krugman has noted, U.S investors now hold a significant amounts of their portfolios in global stocks, and foreign investors now hold a significant fraction of the U.S. stock market. Foreign investors hold about one third of all U.S. stocks. As a result, a portion of the recent U.S. corporate tax cut will flow to foreign investors.
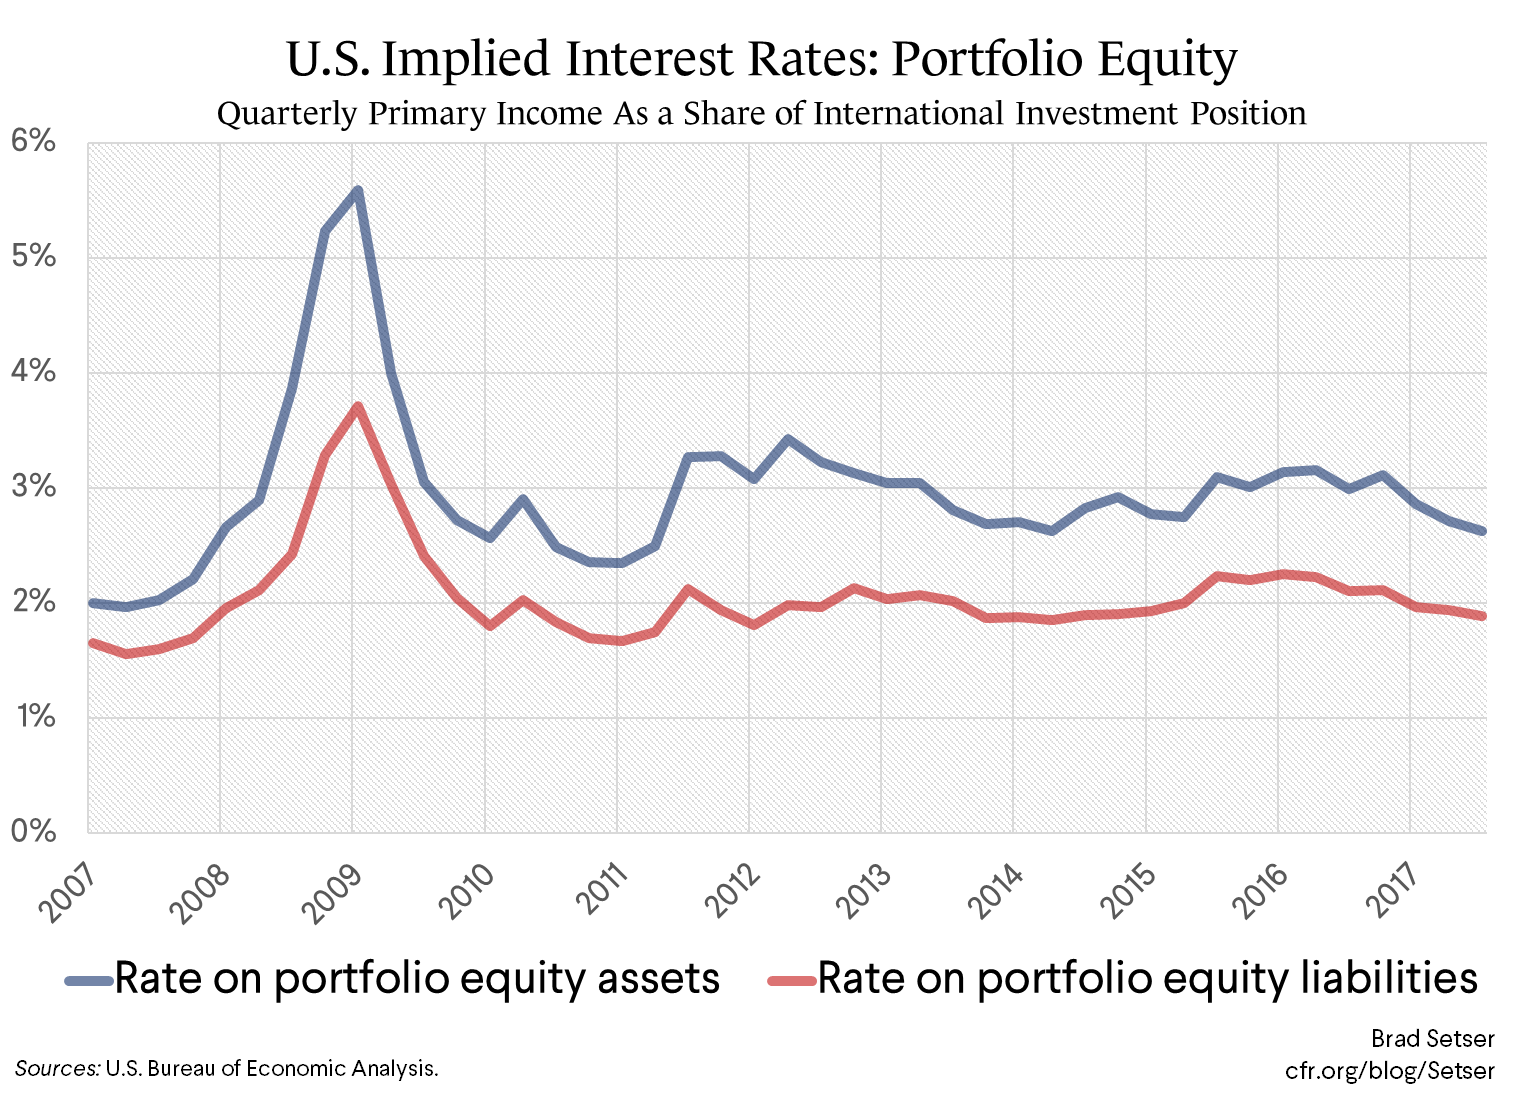
Right now, the stock position in portfolio equity is almost balanced: foreign holdings of U.S. stocks and U.S. holdings of stocks are both about 40 percent of GDP. However, the U.S. does get a slightly higher return on portfolio investments abroad than foreigners get on their investments in the U.S. stock market (a 2.8 percent dividend return versus and the 2 percent dividend return foreigners get on their equity investment in the U.S.). As a result, the U.S. ends up with a surplus in the income balance of about 40 basis points of GDP from portfolio equity.
But that is now likely to change a bit. The after-tax dividend of some firms should go up following the tax cut (it wasn’t revenue neutral) and U.S. firms may raise dividend payments (either as a result of the one-off payment of cash previously held offshore, or more permanently) following the tax reform. It would take roughly a 50 percent increase in the after-tax dividends U.S. firms pay to foreign investors to essentially get rid of the current return differential.
I haven’t looked closely at the numbers yet, but that seems a bit high (U.S. firms will do a lot of buybacks)—but a smaller increase that cuts the surplus on stock market dividend income in half certainly seems very plausible to me.
Sum it up and it seems clear that the investment income balance will deteriorate—barring some major change in transfer pricing and tax strategies that transforms the FDI income balance—through a combination of rising interest payments on foreign holdings of Treasuries and an increase in dividend payments on foreign holdings of U.S. stock. It isn’t hard, in fact, so see how this could account for the bulk of the adjustment in the current account balance (assuming, that is, that there isn’t a big shift in corporate tax strategies that changes the FDI balance.)
For those interested, here is the current math in its full detail, with no rounding, using the income balance from the last four quarters of data and the end-q3 net international investor position numbers:
The U.S. receives 0.87 percentage points of GDP in interest income, and pays 1.69 percentage points of GDP in interest, for a net deficit of 0.82 percentage points of GDP (2.25 percent on 39 percent of GDP in lending to the world, versus 1.95 percent on 87 percent of GDP in borrowing from the world).
The U.S. receives, thanks to some rather aggressive transfer pricing and tax planning, 2.51 percentage points on FDI income, while paying 0.97 percentage points of GDP on foreign direct investment in the U.S., for a net surplus of 1.54 percentage points of GDP (5.7 percent return on 44 percent of GDP in FDI abroad, versus a 2.2 percent return on 43 percent of GDP in direct investment in the U.S.).
The U.S. receives 1.15 percentage points of GDP on its holdings of foreign stock, and pays 0.73 percentage points of GDP on foreign holdings of U.S. stock, for a surplus of 0.42 percentage points of GDP (2.6 percent dividend return on 44 percent of GDP in portfolio equity investment abroad, versus a 1.9 percent dividend return on 39 percent of GDP in foreign portfolio investment in the U.S.)
The net balance on investment income is thus 1.14 percentage points of GDP (using the last four quarters of data as of q3-2017), up from around 1 percent of GDP in 2016.
There is a technical point here: I like dividing the Net International Investment Position (NIIP) into its debt and equity components and looking at them separately, rather than modeling the entire liability and asset side. The higher share of equities on the asset side than on the liability side is I think misleading—it simply reflects the outsized debt position in U.S. liabilities. As a share of GDP, equity investment in the U.S. is about equal to equity investment abroad. The overall difference in returns stems from the outsized (and I think tax driven) return differential, not any difference in the (current) stock position.
* There are different ways to calculate the U.S. net external debt. Some add in intercompany debt. Some would offset a portion of the U.S. external debt with the United States’ gold holdings. I left intercompany debt out (it is in the FDI numbers) and left out reserve assets (a simple way of taking out the gold, though it also leaves out about $100 billion in true U.S. foreign exchange reserves—but, well, they are in Bunds and JGBs and thus don’t generate any more income than the gold).
** Fun fact: the U.S. has invested more in bonds issued by the Cayman Islands than in bonds from any other jurisdiction (the Caymans just edge out Canada and the UK). See exhibit 2 of the Treasury survey. Another less fun fact: the flow and stock data on U.S. holdings of bonds issued from the rest of the world are not at all consistent (see exhibit 4).