China Isn’t Shifting Away From the Dollar or Dollar Bonds
China’s reserves has shifted its dollar reserves from Treasuries to Agencies, and made increased use of offshore custodians. The available evidence suggests that it still holds about 50 percent of its reserves in dollar bonds.

There is a widespread perception that China has responded to an era of heightened geostrategic competition and growing economic rivalry with the United States by shifting its foreign exchange reserves out of the dollar. Wikipedia seems to confirm it.
It sort of makes sense – China does worry about the weaponization of the dollar and the reach of U.S. financial sanctions. And why would a rising power like China want to fund the Treasury of a country that China views as standing in the way of the realization of the China dream (at least in the Pacific).
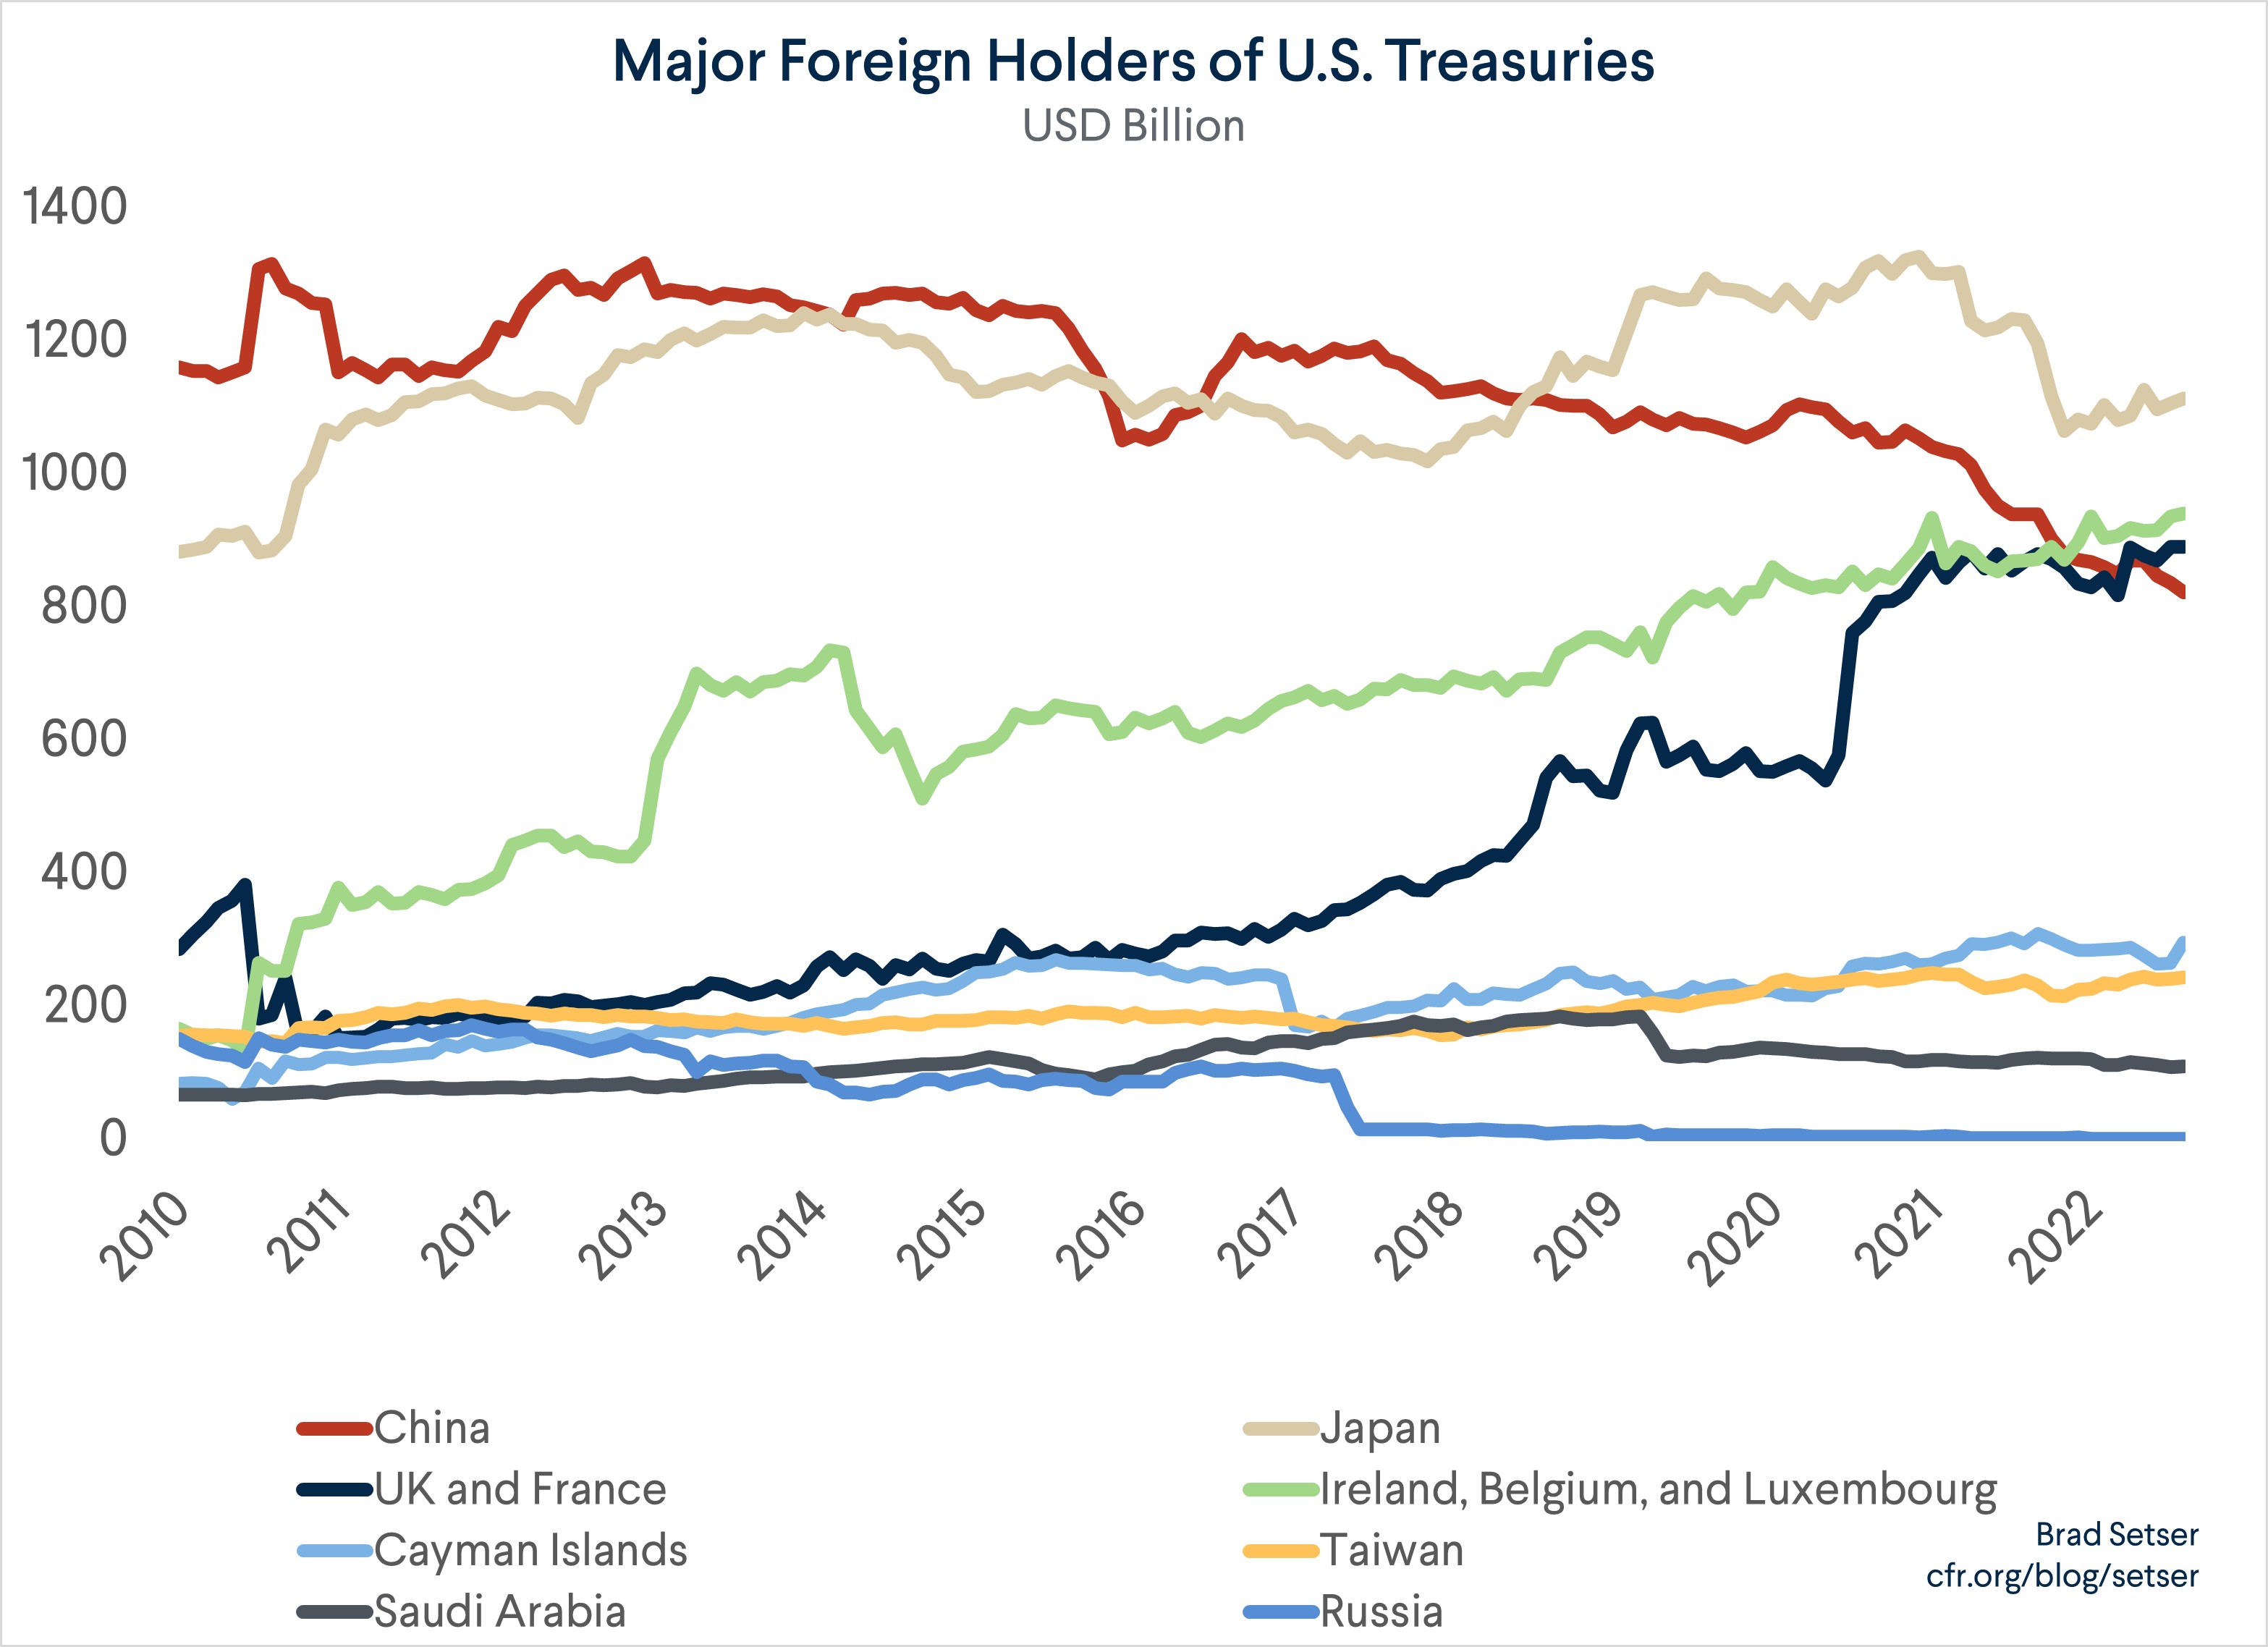
It also seems to be in the official U.S. data: China’s reported holdings of U.S. Treasuries have slid pretty continuously since 2012, with a further down leg in the last 18 months.
There is also no doubt that the market has been pushing for a weaker yuan. So it wouldn’t be a total surprise if China was using some of its reserves to support the yuan and funding its intervention by drawing on its Treasury book.
Throw in the sell-off in ten year Treasury notes in the third quarter, and there is a fairly broad concern that China could now be actively selling Treasuries.
Yet, that is not what I believe is actually happening.
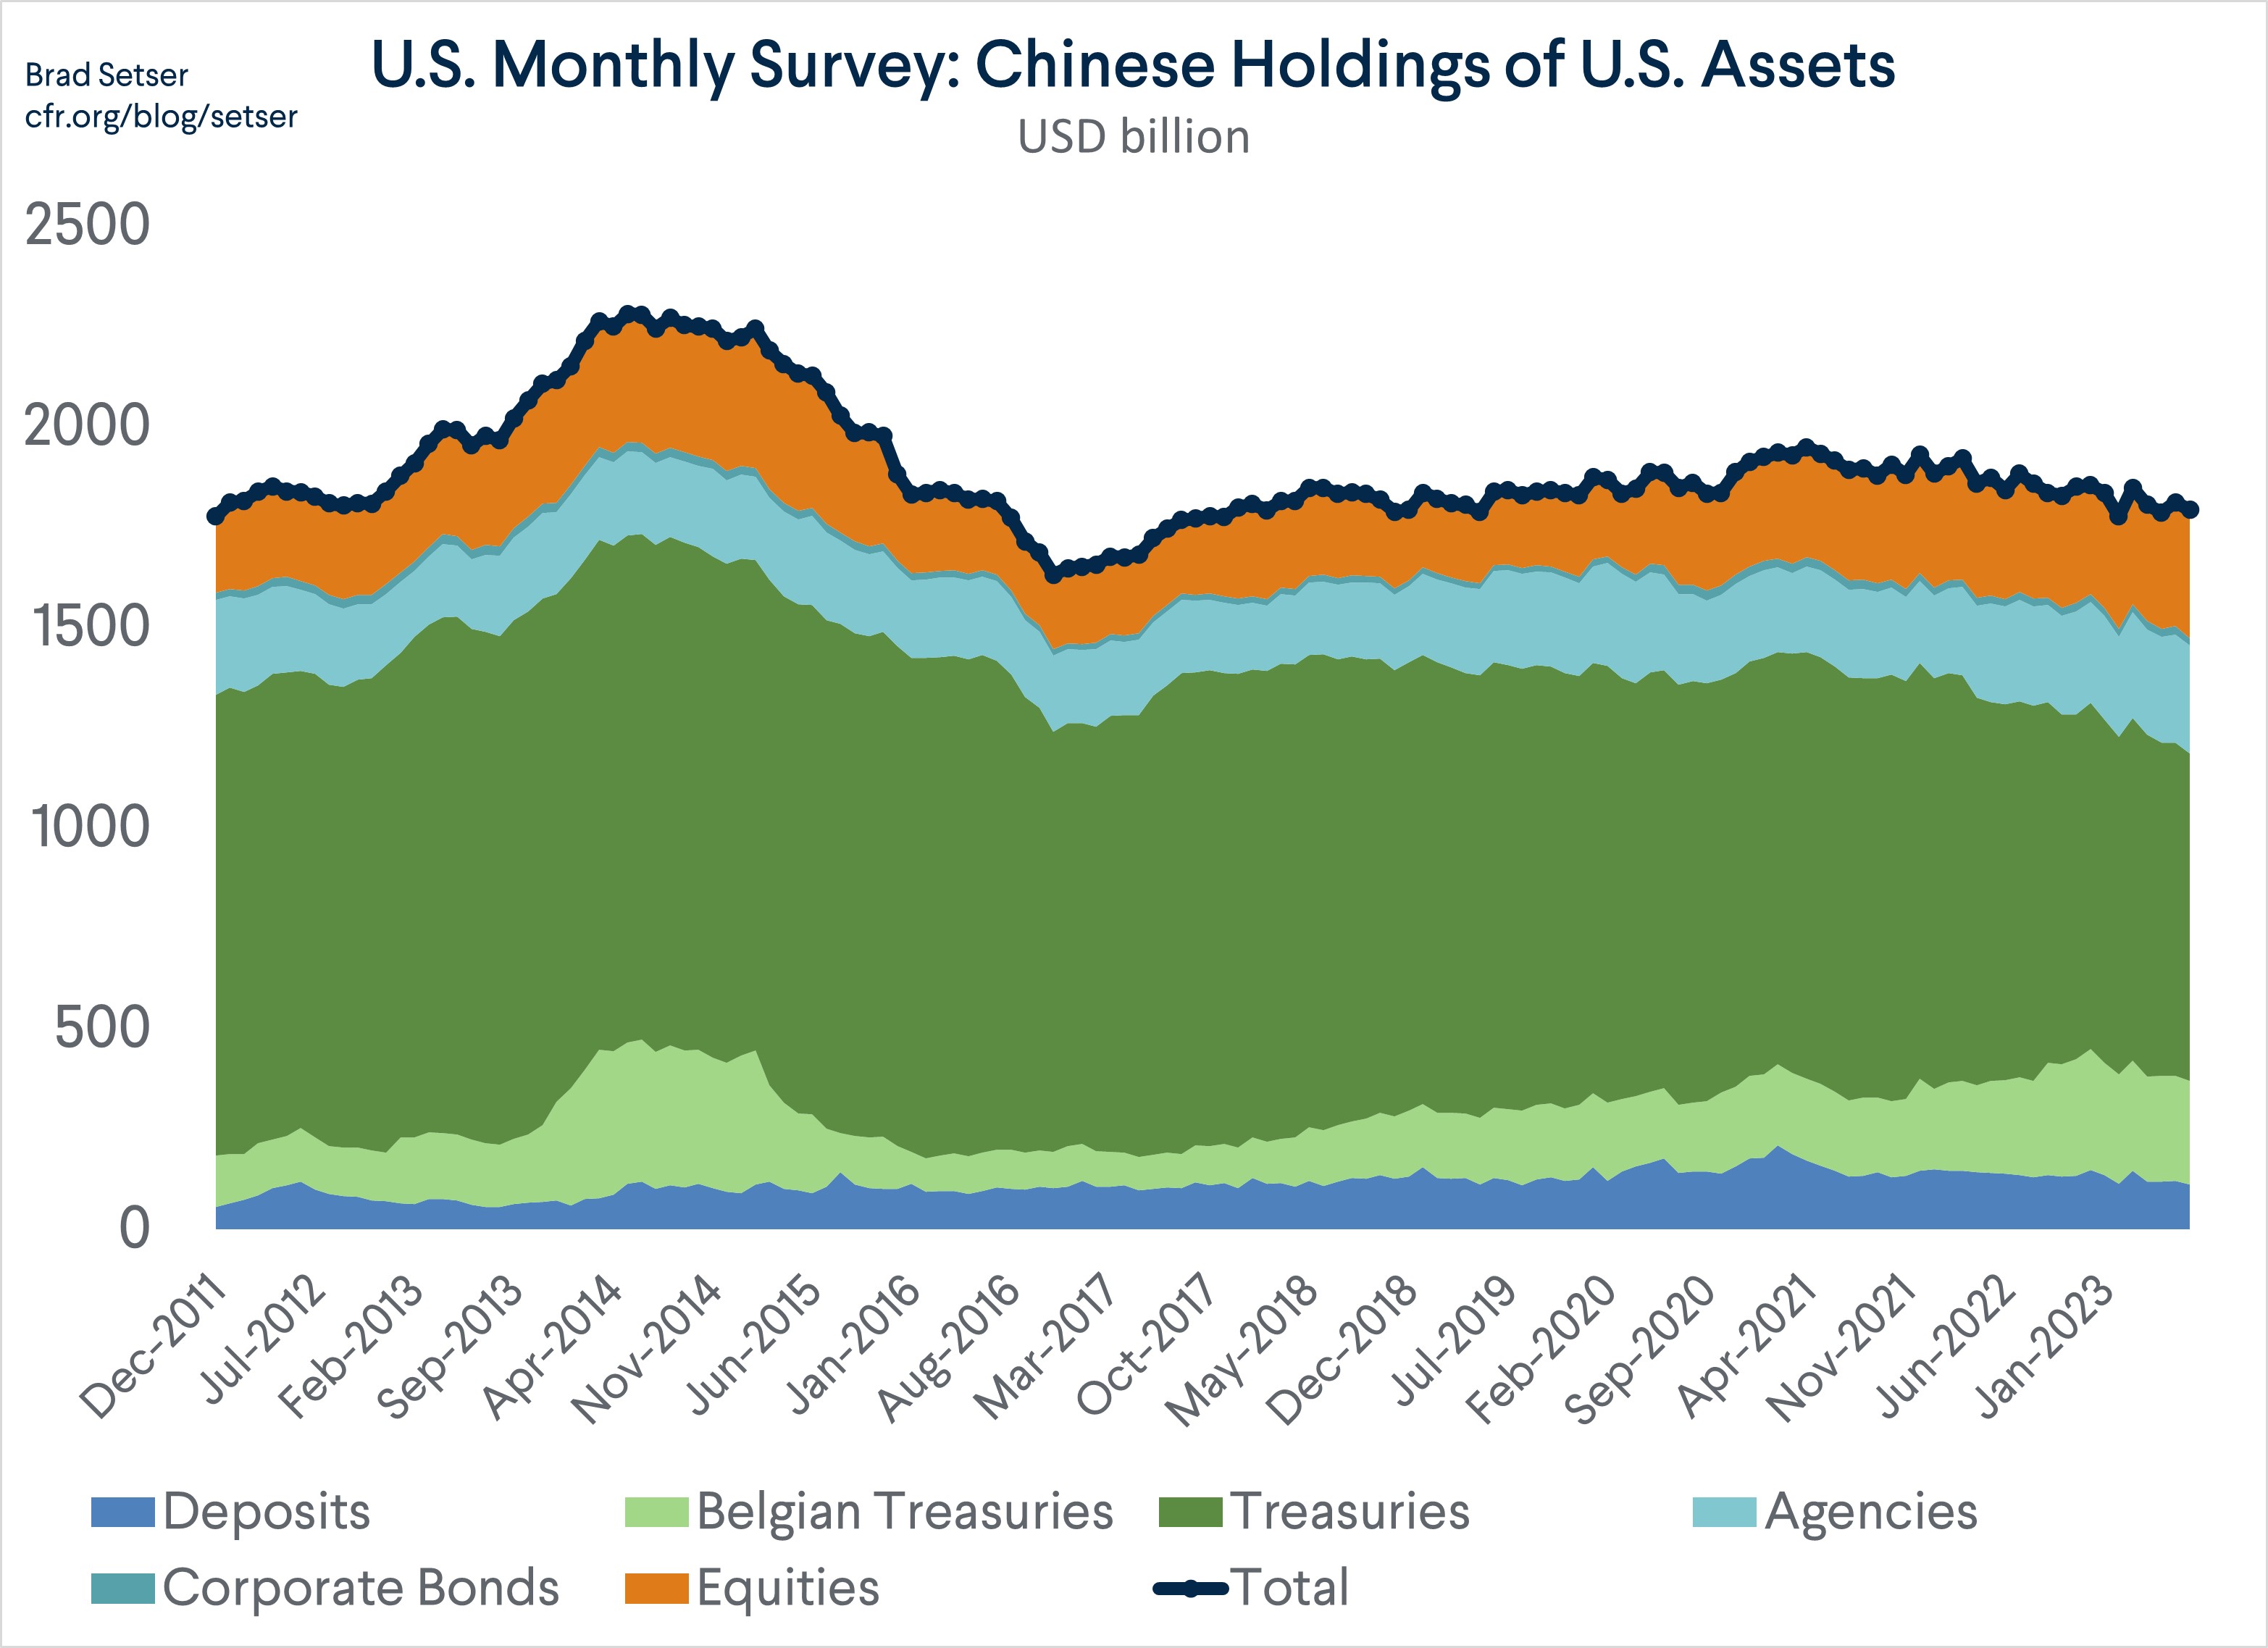
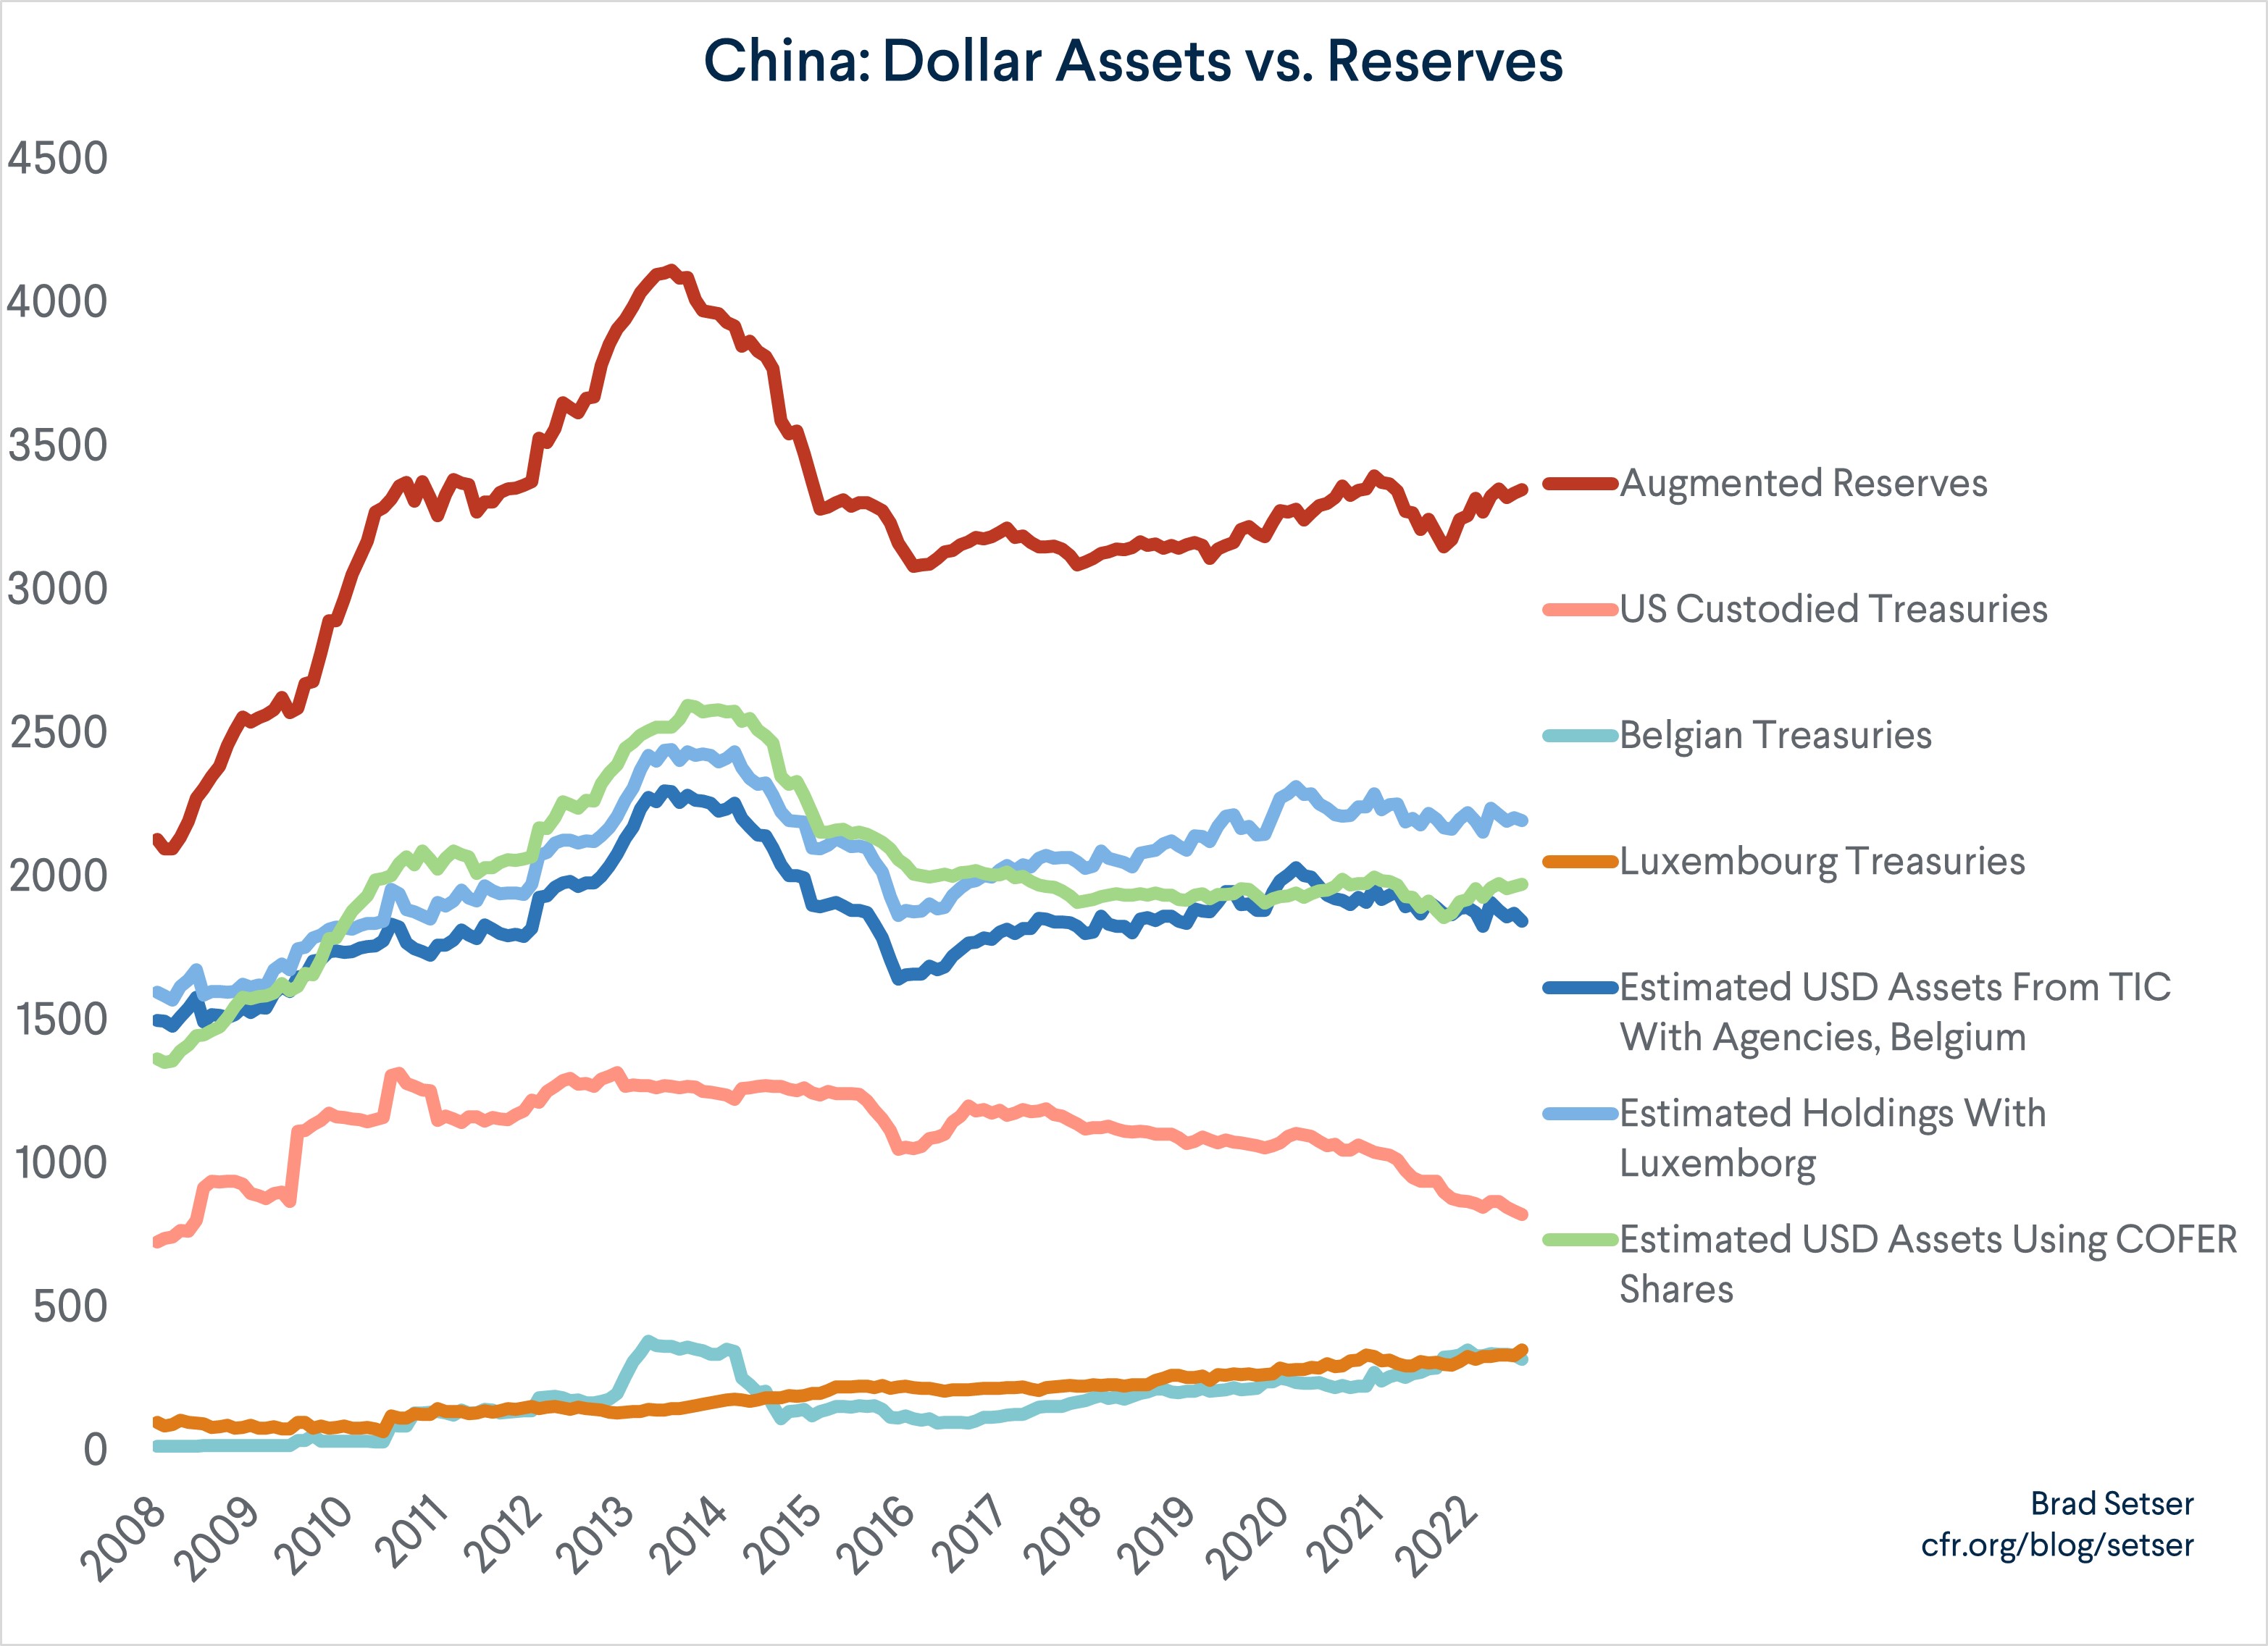
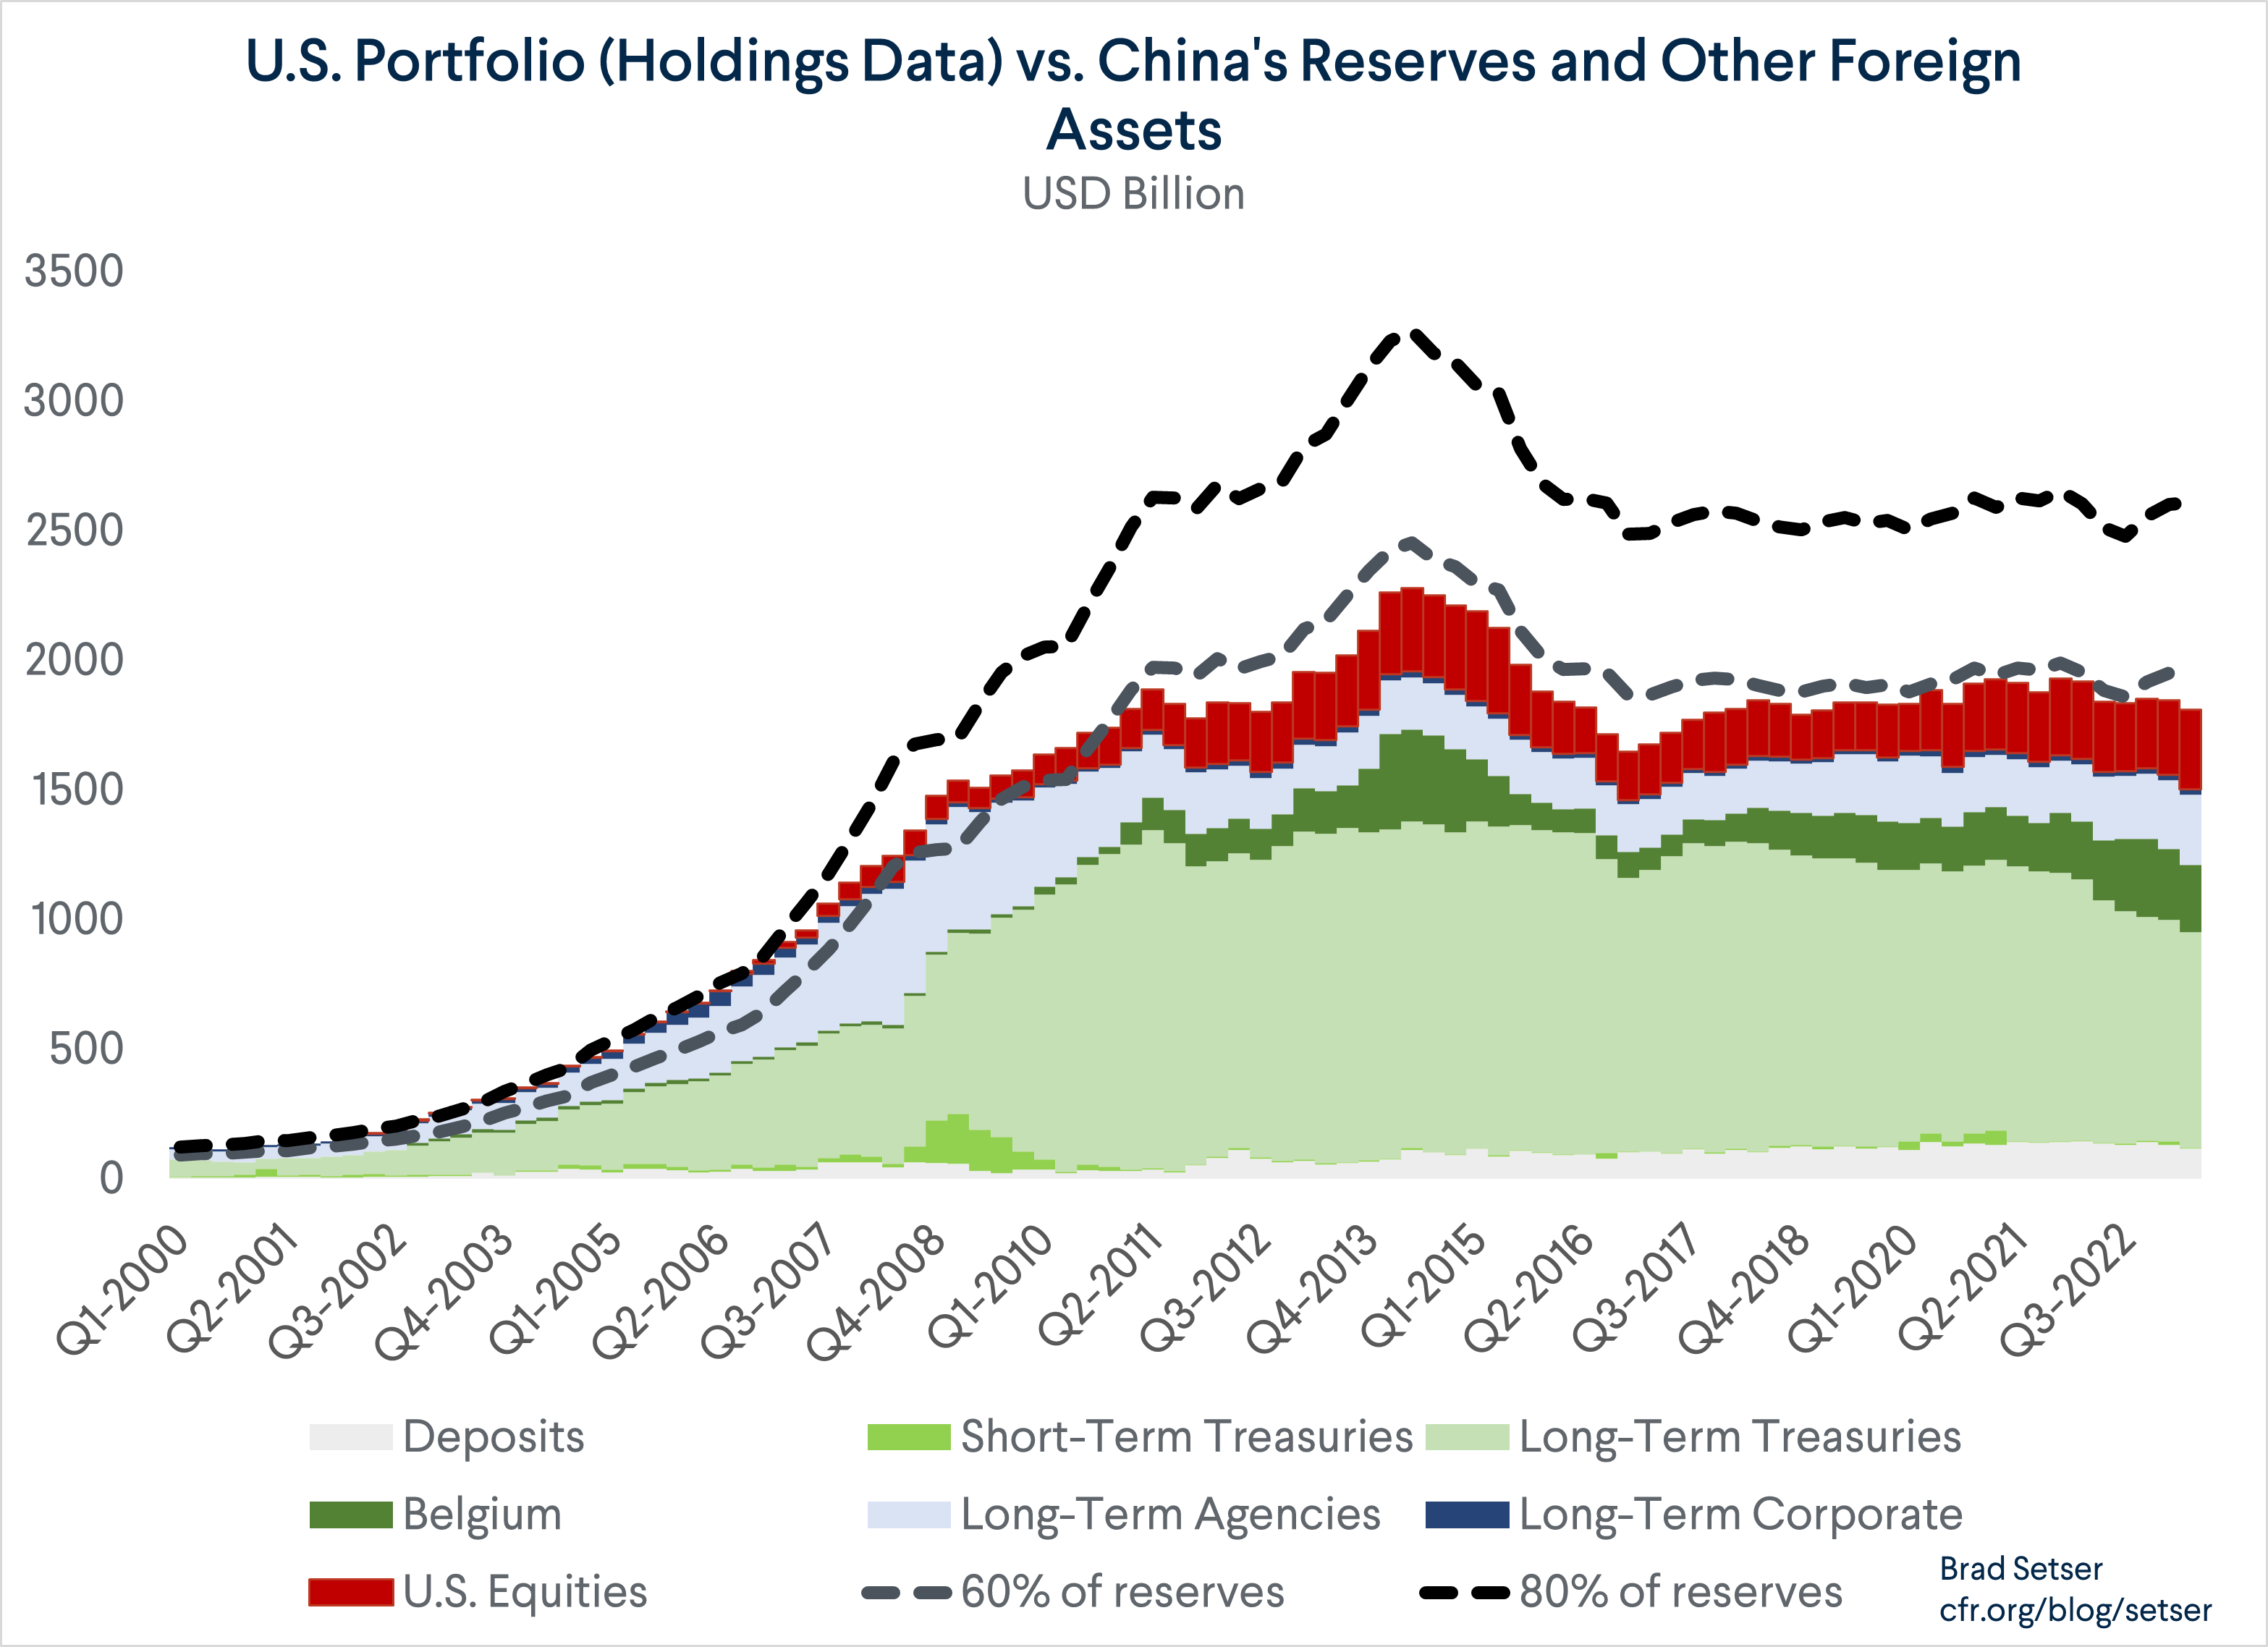
Strange as it may seem, the best evidence available suggests that the dollar share in China’s reserves has been broadly stable since 2015 (if not a bit before). If a simple adjustment is made for Treasuries held by offshore custodians like Belgium’s Euroclear, China’s reported holdings of U.S. assets look to be basically stable at between $1.8 and $1.9 trillion. After netting out China’s substantial holdings of U.S. equities, China’s holdings of U.S. bonds, after adjusting for China’s suspected Euroclear custodial account, have consistently been around 50 percent of China’s reported reserves. Nothing all that surprising.
The bulk of China’s post-2012 efforts to diversify its reserves have come not from shifting reserves out of the dollar, but rather by using what could have been reserves to support the Belt and Road and the outward expansion of Chinese firms (see Box 6 of SAFE’s annual report, or my June blog). Those non-reserve foreign assets, strangely enough, seem to be mostly in dollars; almost all the documented Belt and Road project loans, for example, have been in dollars.
There are, obviously, two sources of data about China’s reserves: China’s own (limited) disclosure, and the U.S. data on foreign holdings of U.S. securities. Both broadly tell the same story – one at odds with most press coverage of the slide in China’s formal reserves.
The Chinese Data
China has disclosed that it reduced the dollar share of its reported reserves from 79 percent in 2005 to 58 percent in 2015. It also disclosed that the dollar share in 2017 remained at 58 percent (see SAFE’s 2021 annual report). China’s selft-reported dollar share is just below the global dollar share in the IMF’s comprehensive data set.
That is more or less all China formally reports. It doesn’t disclose:
a) The share of its reserves in yen or euro, or the share of those reserves than have been hedged back to dollars.
b) How it manages the foreign exchange receipts from the interest income on its existing reserves. The PBOC’s balance sheet, which reports reserves at historical cost, has been flat since the end of 2016 – and in the intervening seven years the PBOC should have received an average of, say, 3 percent a year (according to SAFE, the average return from 2008 to 2017 was 3.35 percent), which adds up – the total missing interest since 2016 is something like $600 billion.
c) The size of its substantial non-reserve foreign currency assets: entrusted loans, SAFE’s participation in various investment funds other than the China Investment Corporation (CIC). SAFE’s 2020 Annual Report disclosed that SAFE has provided foreign exchange to support China’s Go Out policy and the Belt and Road, but didn’t provide any sums.
d) The distribution of its dollar portfolio across different asset classes.
I really think the IMF should be pushing China a bit harder on all these points. So does the U.S. Treasury.
The U.S. Data
Journalists the world over generally know only one part of the U.S. Treasury international Capital (TIC) data – the table showing foreign holdings of U.S. Treasuries in U.S. custodians (FRBNY, State Street, Bank of New York, J.P. Morgan). That table reports the current market value of China’s treasuries in U.S. custodians, so the recent fall reflects, among other things, the recent sell-off in long-term U.S. Treasuries and resulting slide in the market value of Treasuries purchased in years past.
That table, however, suffers from three other limitations:
One, Treasuries held by non-U.S. custodians wouldn’t register as “China” in the U.S. data. The two biggest custodians are Euroclear, which is based in Belgium (Russia kept its euro reserves there), and Clearstream, which is based in Luxembourg.
And two, the table for Treasuries (obviously) doesn’t include China’s holdings of other U.S. assets – and China actually has a large portfolio of Agency bonds and U.S. equities (they appear in another more difficult to use data table).
The U.S. data would also miss Treasuries and other U.S. assets that have been handed over to third parties to manage – and it is well known that SAFE has accounts at the large global bond funds, several hedge funds (including Bridgewater) and in several private equity funds.
Let’s start with the data on Treasuries, specifically the Treasuries held by non-U.S. custodians. The Treasuries held by Euroclear and Clearstream obviously could be held by anyone (Russia, for example, had a lot of euro-denominated securities in Euroclear). So figuring out what share of these Treasuries should be attributed to SAFE and China takes a bit of work. Ireland is another candidate, but its holdings are generally attributed to the Treasury operations of the major U.S. companies that use Ireland as the center of their global tax minimization strategies.
Frankly, it helps to know a bit of background about the TIC data. The “survey” data used to be done annually. There was a separate data set of monthly transactions (which seemed to suggest all treasuries sold globally were sold to the UK and a few other financial transactions).
Yep, up until 2011 or so, there was only one high quality data point for China’s U.S. holdings a year. That really wasn’t cutting it though – the U.S. needed, among other things, better numbers to produce its quarterly balance of payments data. So the U.S. introduced a monthly survey of custodians (there aren’t that many of them …) to get better high frequency data.
China of course knew about this (there was public guidance way back in 2011), and they weren’t happy. They didn’t even like the annual data in the survey: it showed China’s huge pre-crisis Agency portfolio, which SAFE would rather have kept hidden.
China thus had a motive to increase its use of non-U.S. custodians in the years after the global financial crisis.
The next step takes a bit of sleuthing – China’s Treasury portfolio in the U.S. data can be compared to China’s reported reserves. It turns out that a good rule of thumb over time has been that about 40 percent of China’s reserves are in Treasuries.
But there is a big “gap” between what China would be expected to hold and what showed up in the U.S. data in 2012 and 2013.
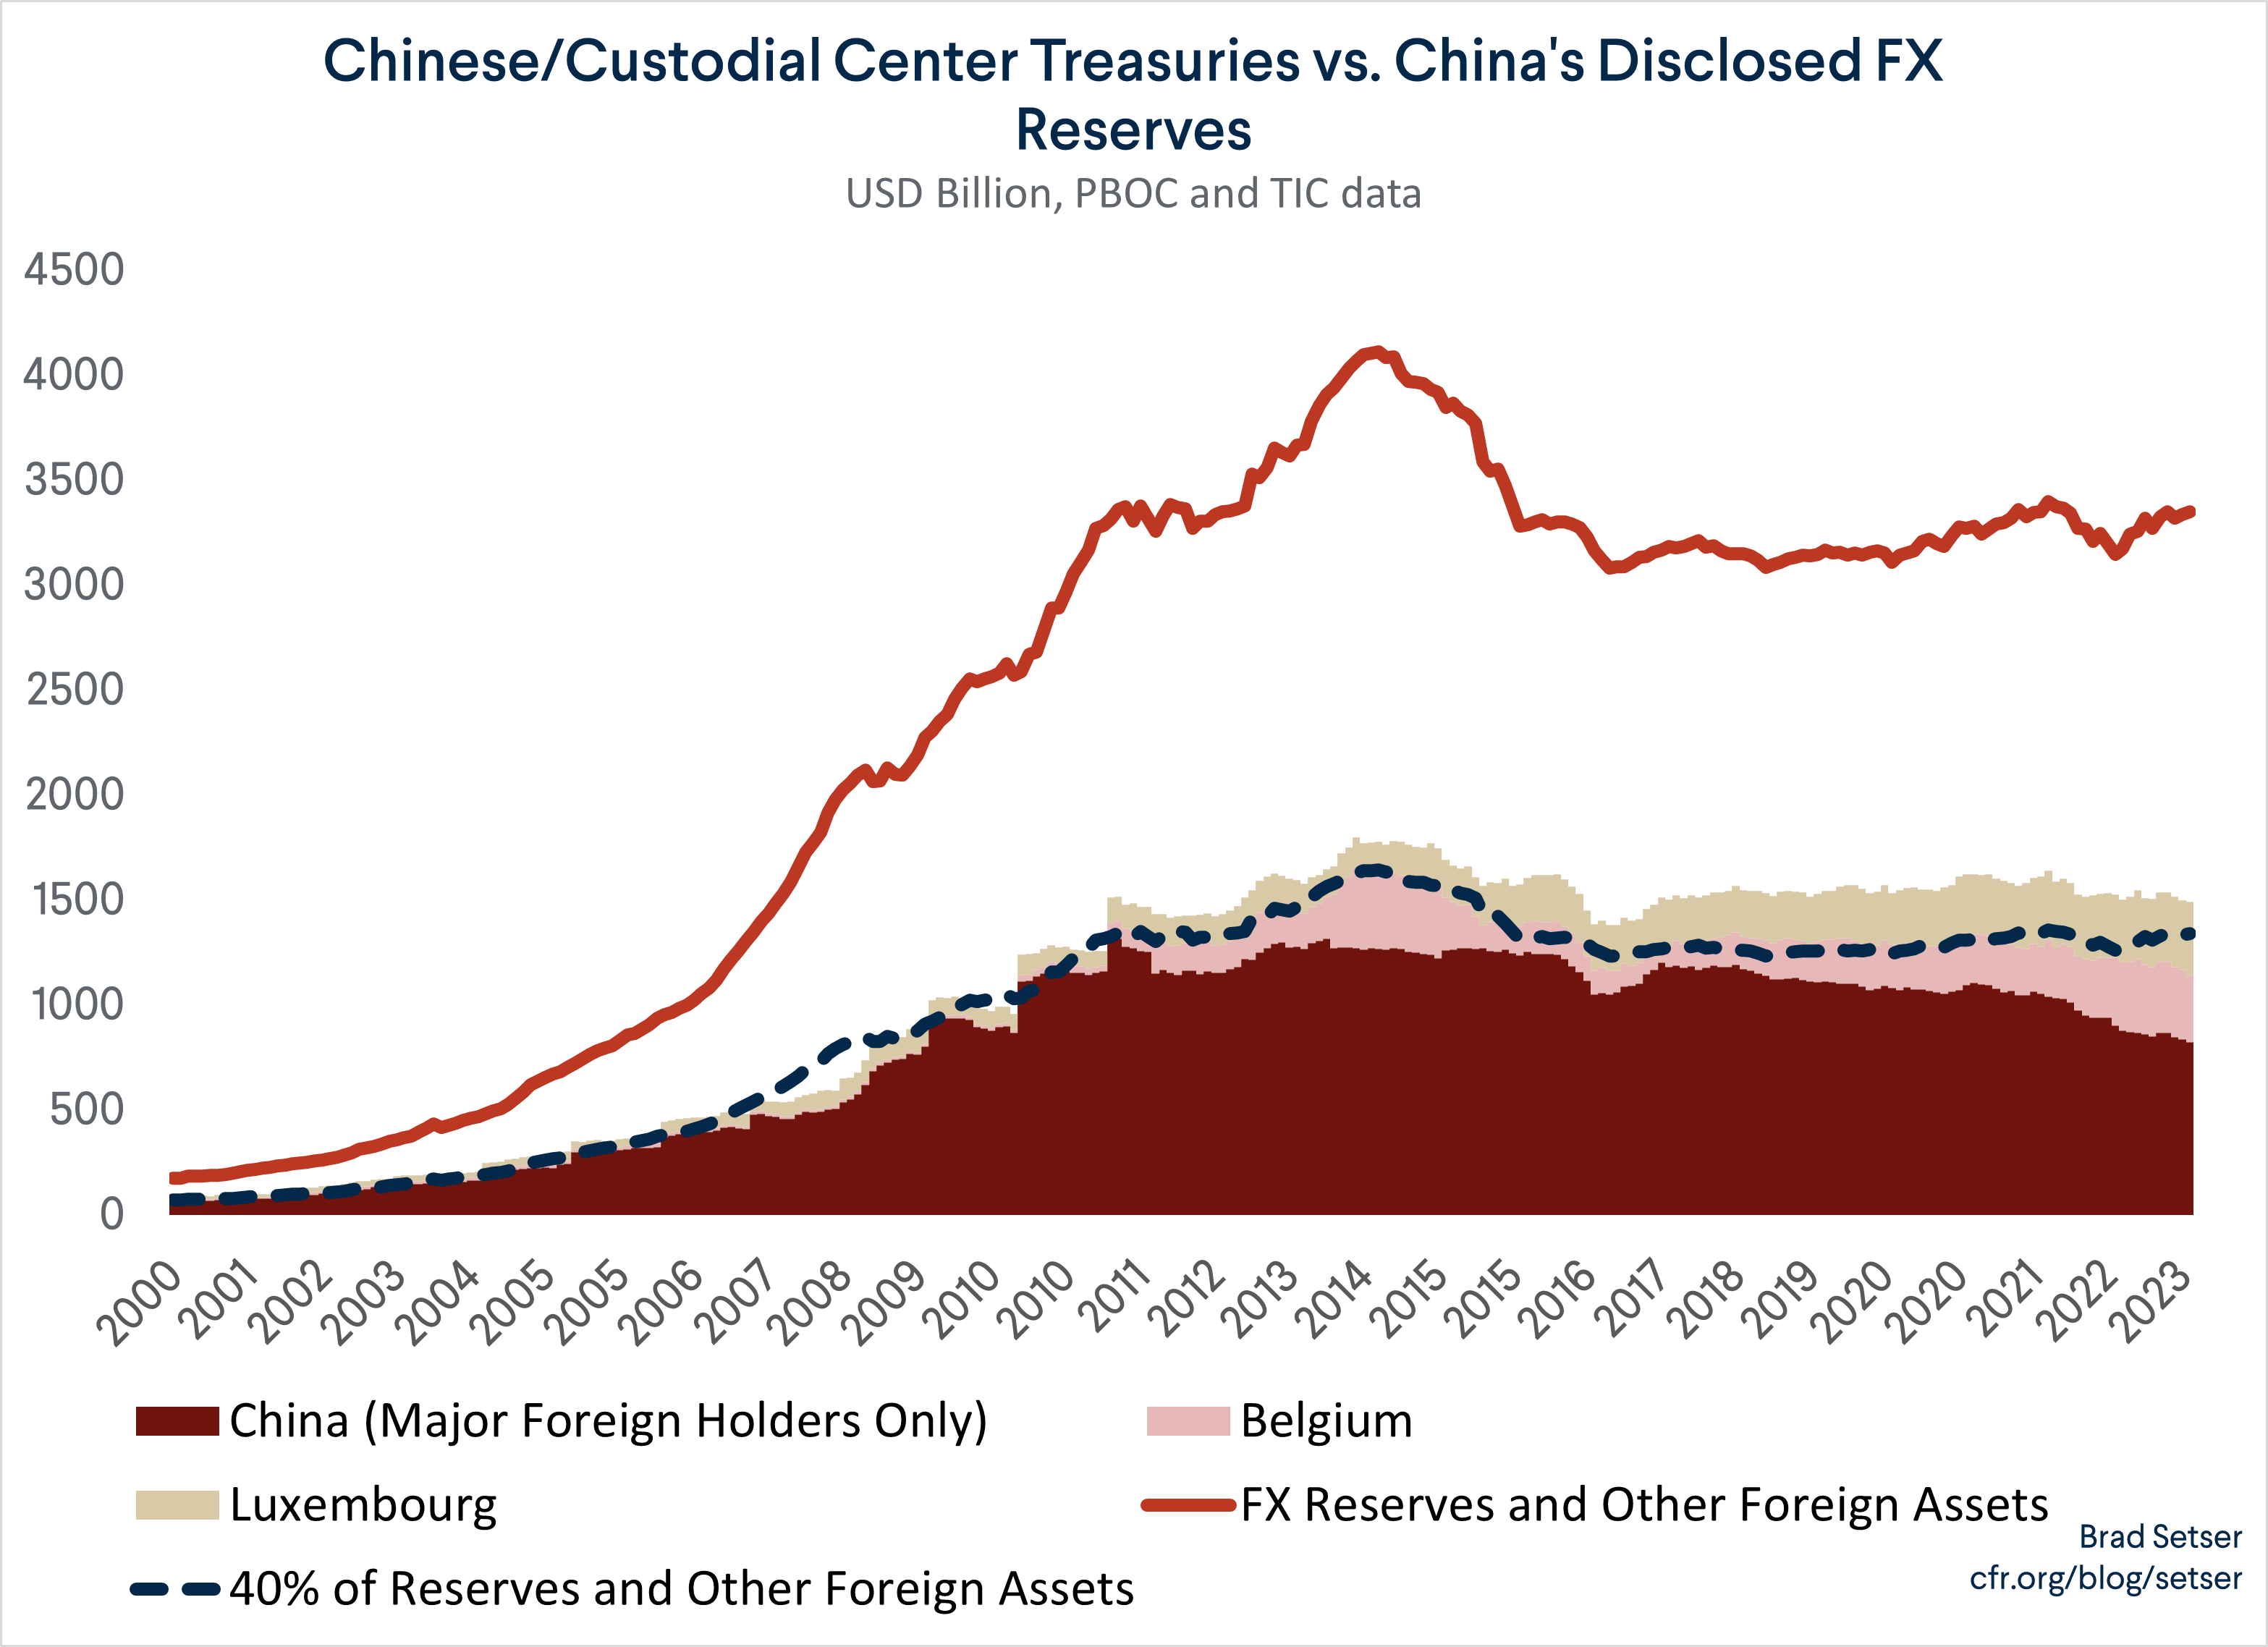
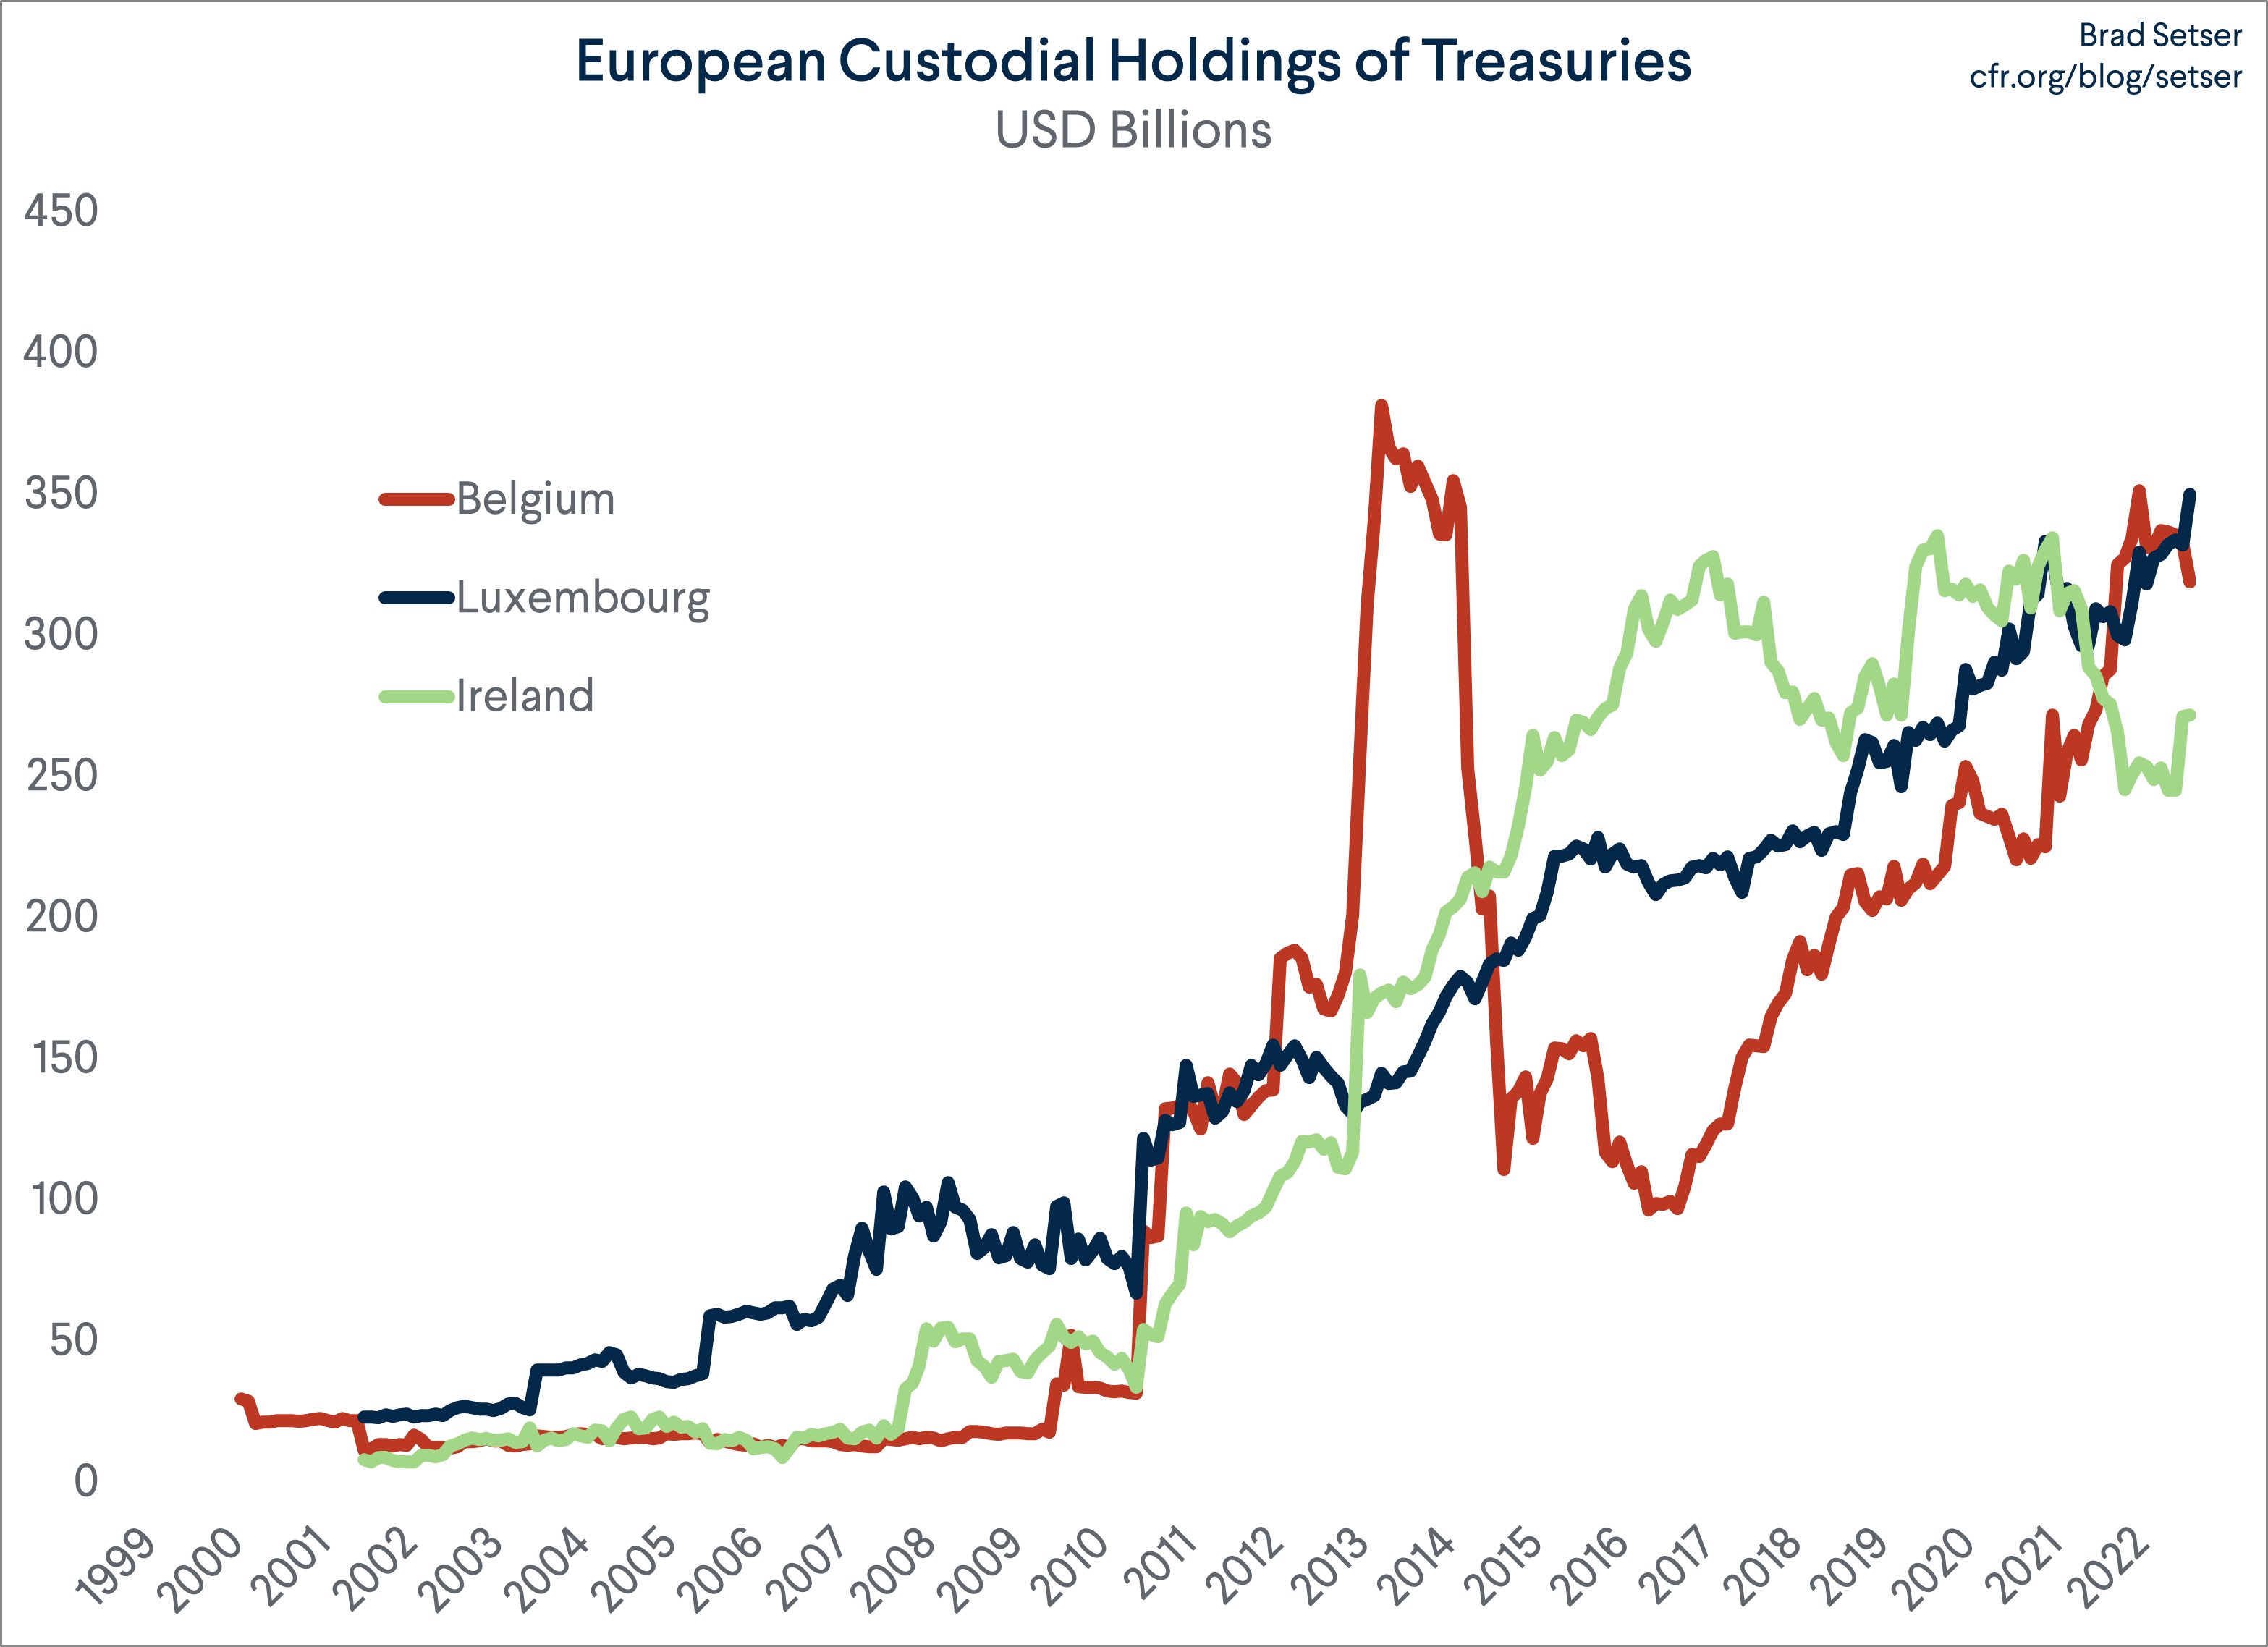
Then look at the “fit” if Belgium (Euroclear) is added to China’s reported Treasury portfolio.
It is actually quite good. The missing Treasuries from 2012-14 show up and then Belgium’s reported holdings fall sharply along with China’s reserves in 2015 and 2016. There is only a bit of slippage from 2021 on (more on that later).
Now look at the “fit” if Luxembourg (Clearstream) is added to China’s reported Treasury portfolio – that’s possible, but it puts China’s implied Treasury share over 40 percent.
Plus, in the chart above, Luxembourg’s holdings are actually rising between 2014 and 2016 when China’s reserves are falling.
It thus seems like the best simple adjustment is to add the Belgian (Euroclear) custodial account to the Treasuries that China (SAFE) still holds with U.S. custodians.
Now, it would be a surprise if China didn’t use Clearstream (Luxembourg) too – but the simplest adjustment (adding Belgium) works well and adding both Belgium and Luxembourg seems to “over” adjust.
There key point here is simple: China and other big reserve holders (such as Russia and Saudi Arabia) can appear indirectly in the U.S. data, through the holdings of the major custodial centers.
The U.S. data also includes data on the agencies, corporate bonds, and equities that China holds with U.S. custodians.
Historically, China has been a big holder of both Agencies and equities. I suspect China holds some corporate bonds too but they don’t appear in the U.S. data (they are likely in either Belgium or Luxembourg as both are major custodial centers for corporate bonds).*
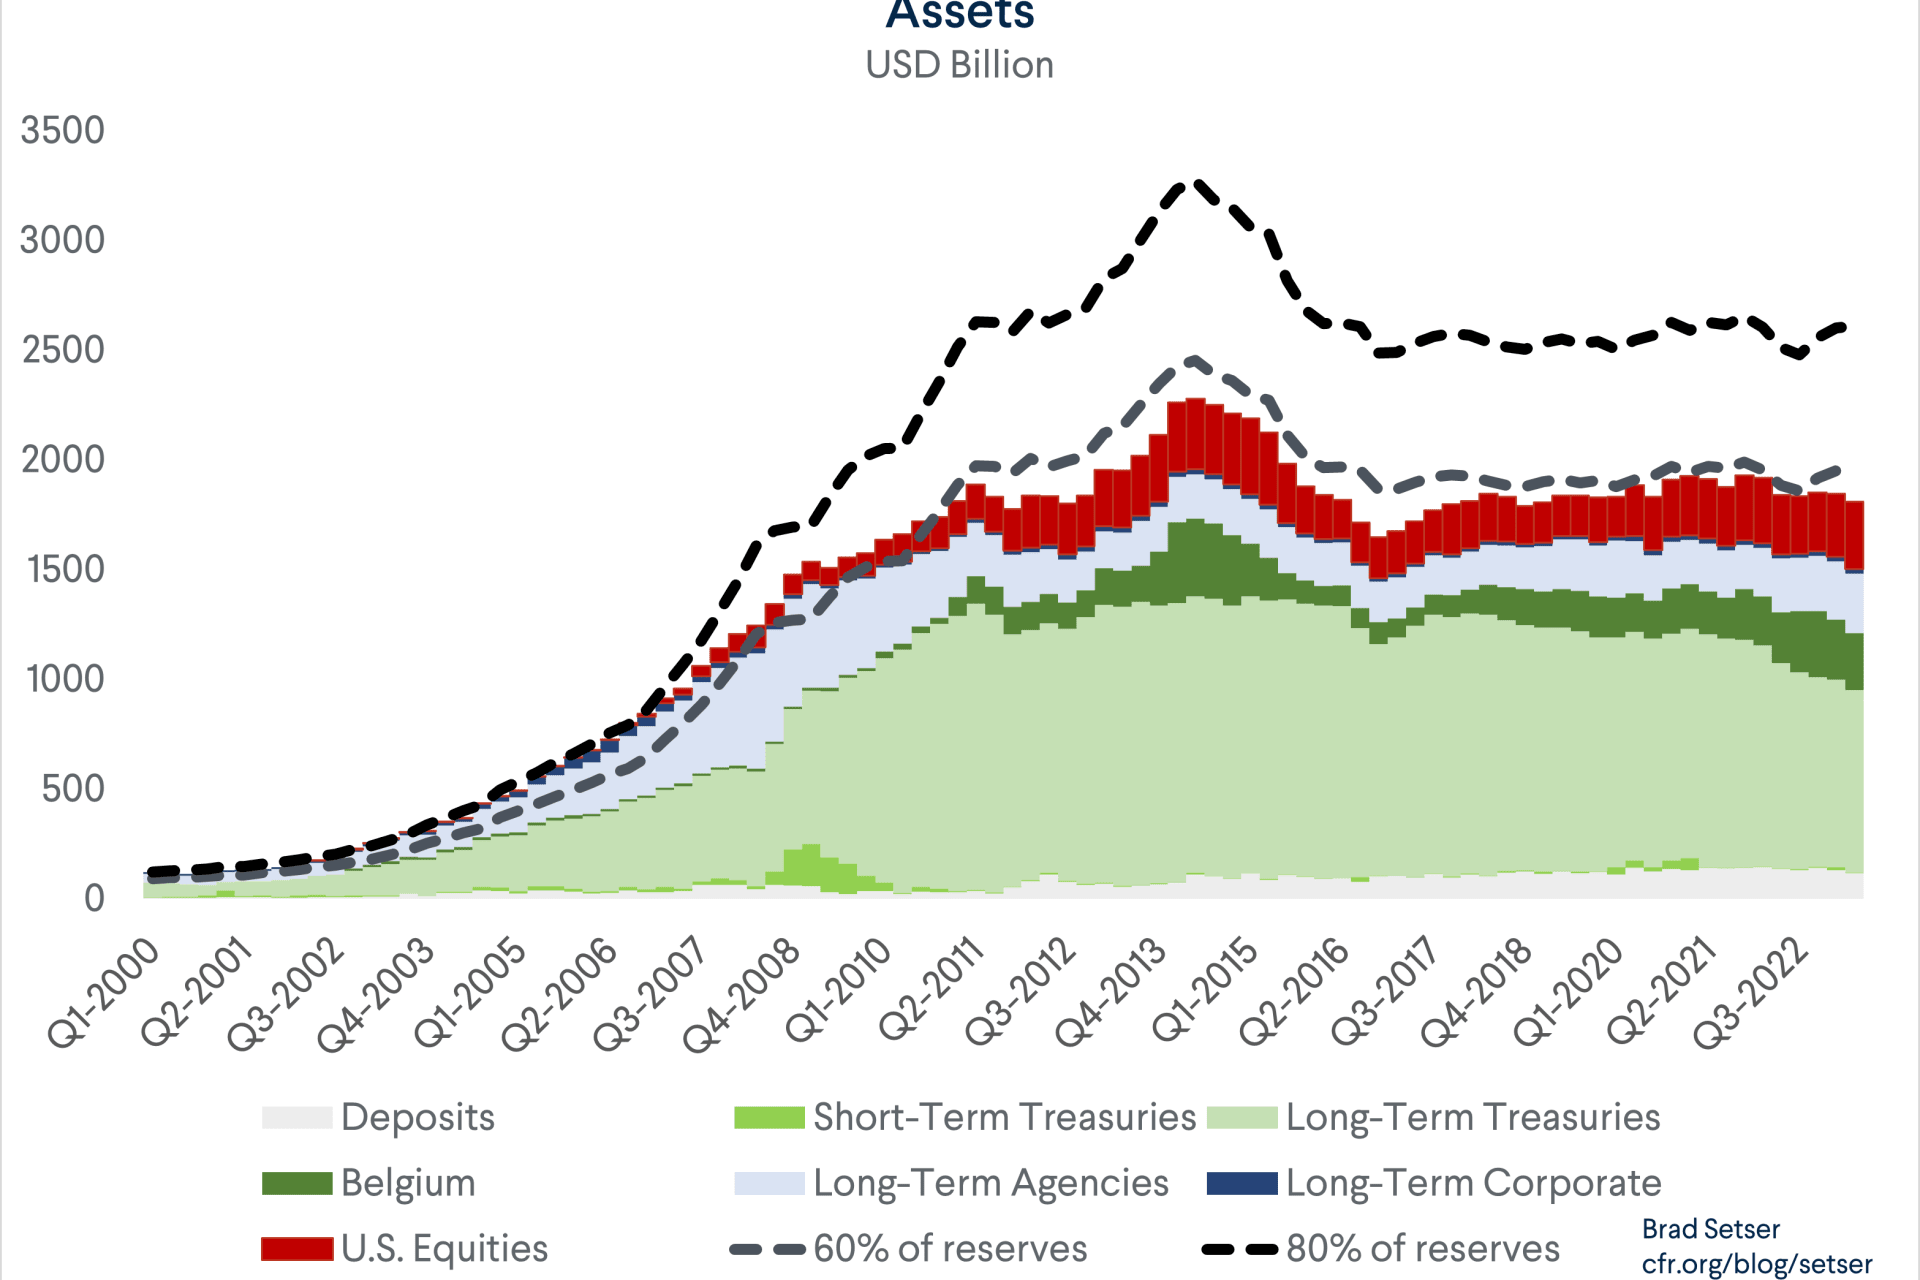
Adding the Chinese holdings of Agencies ($270 billion) and equities ($320 billion) – together with China’s U.S. bank accounts (over $100 billion) – to China’s Treasury holdings thus is necessary to get a full picture of China’s total holdings of U.S. assets.
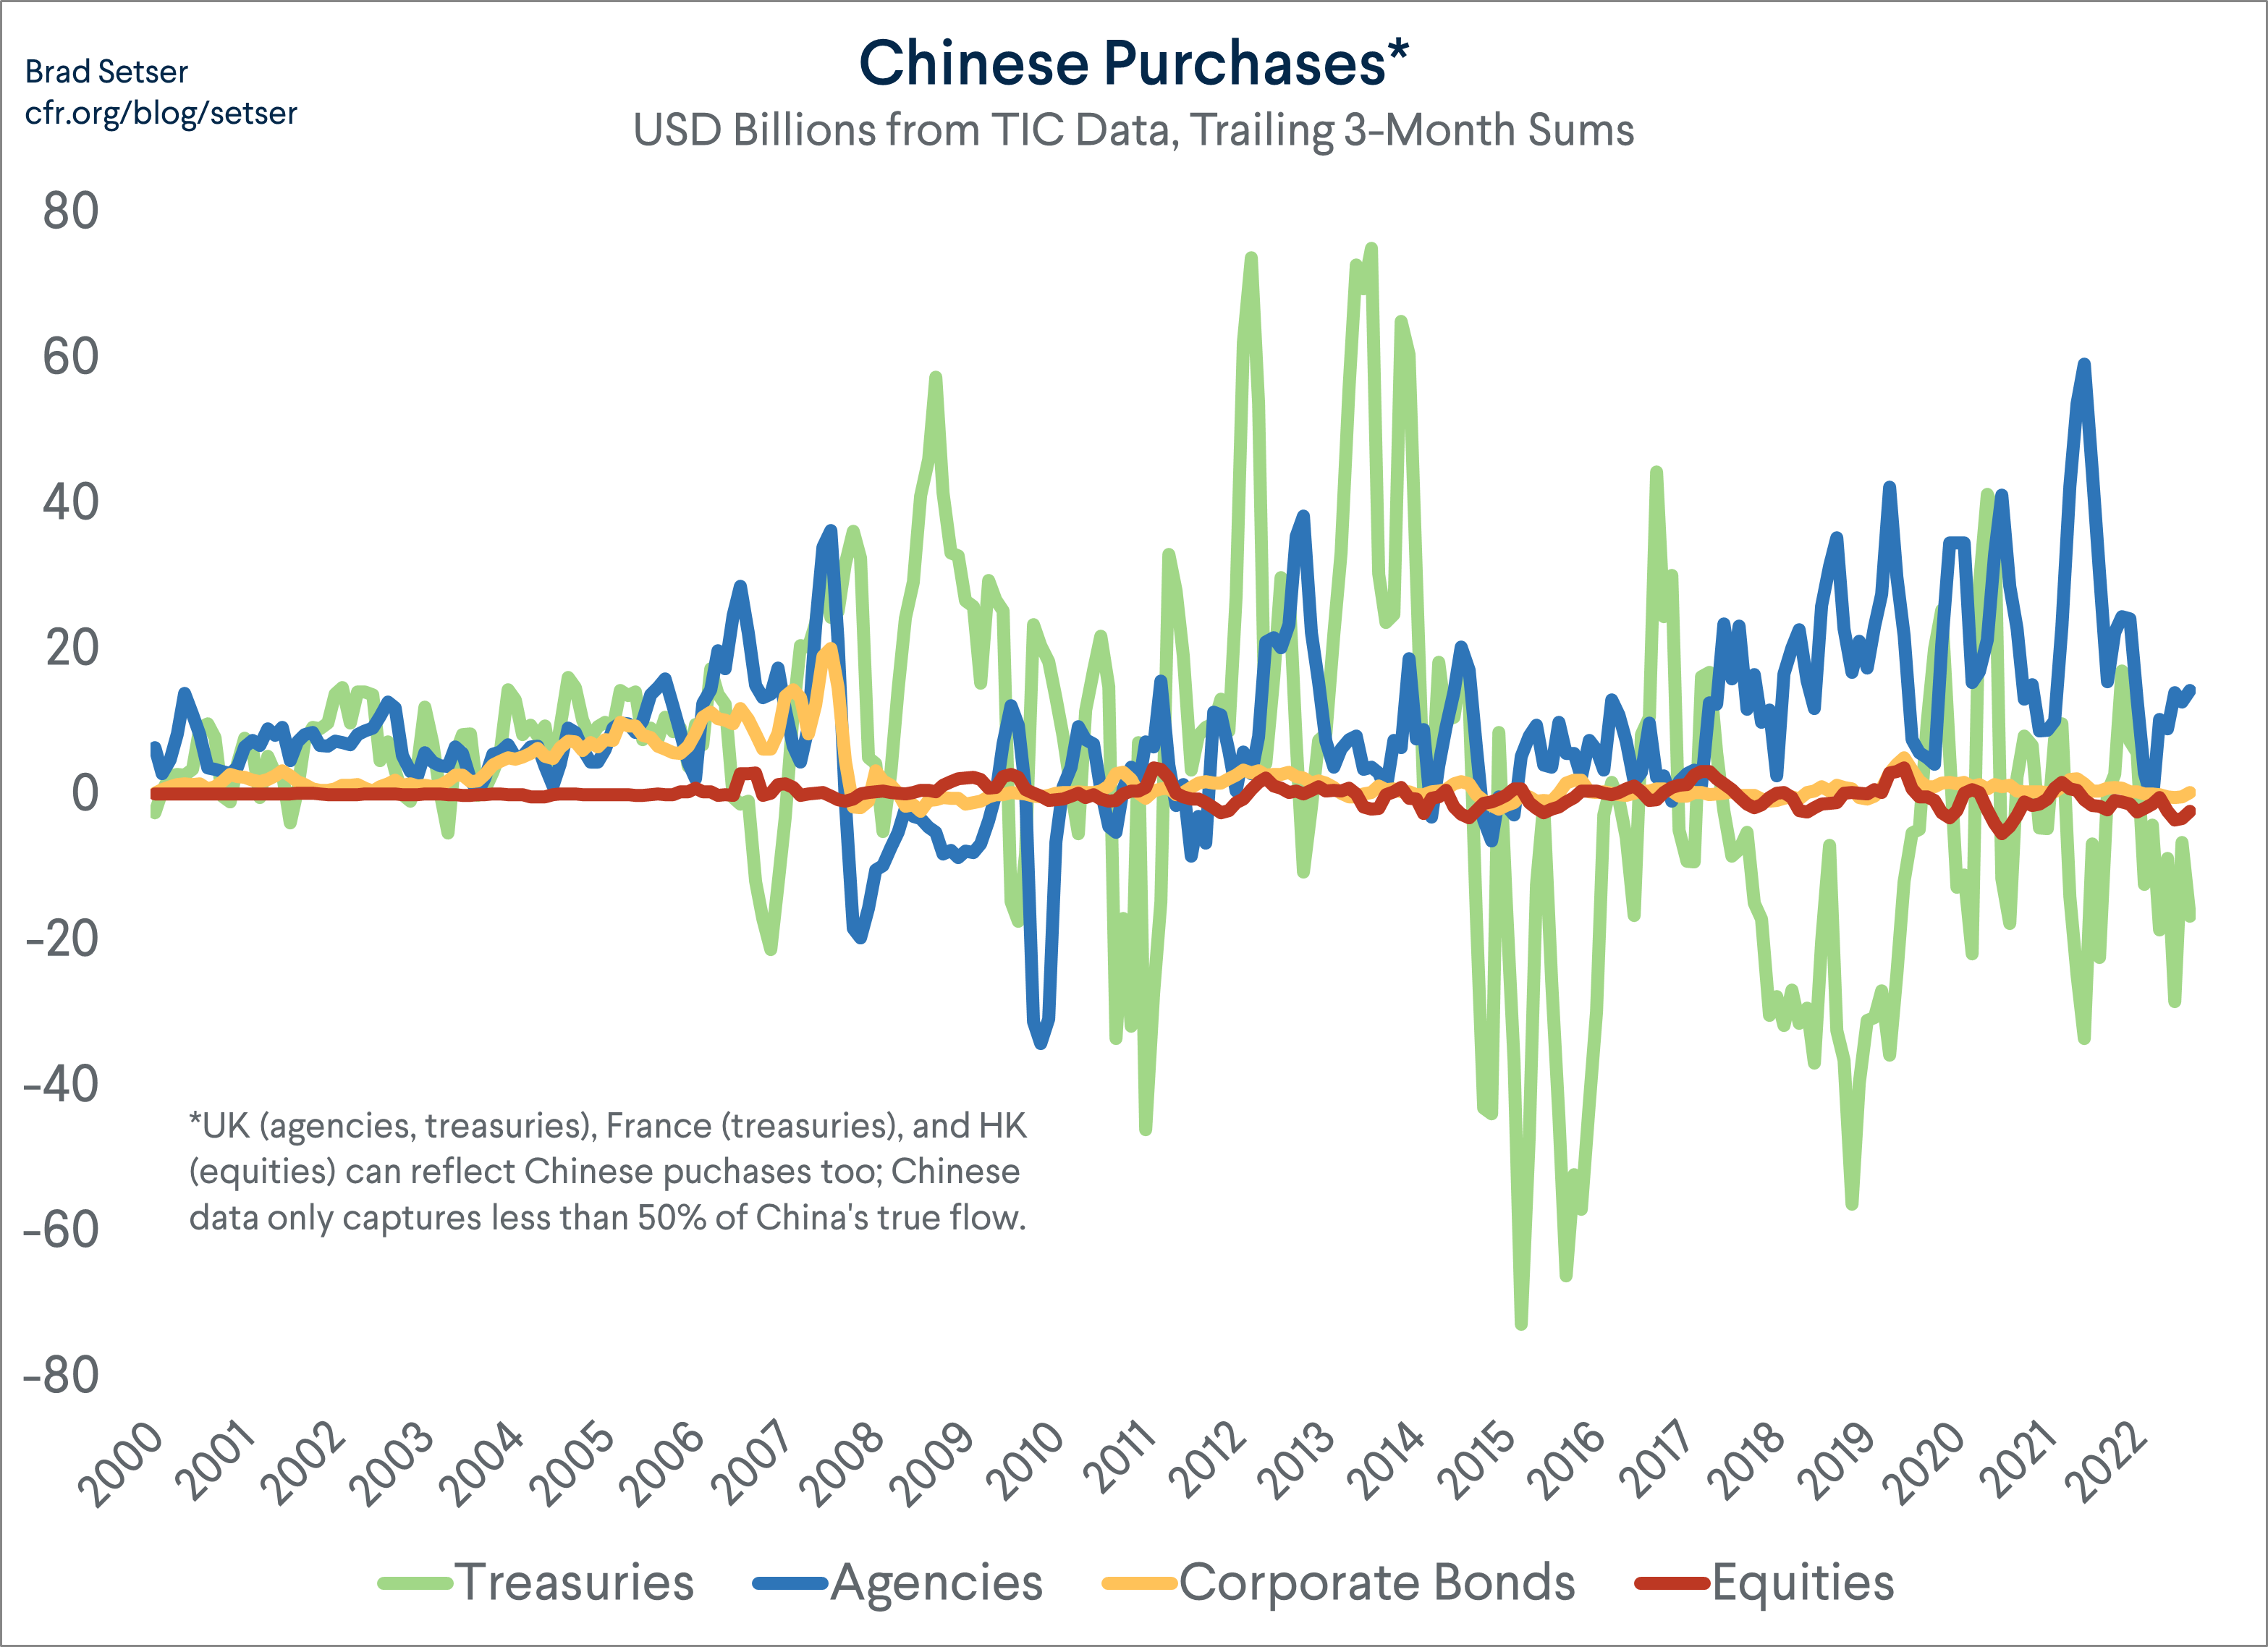
This turns out to be especially important over the last few years. China historically has been a big buyer of Agencies: few now remember, but China held more Agencies than Treasuries going into the global financial crisis (see the Survey data for end June 2008)
After the Freddie and Fannie scare (read Paulson’s memoirs) China let its Agency portfolio run off, and China shied away from Agencies during the years when the Fed was a big buyer. But with the Federal Reserve stepping back from the Agency market once it stopped buying U.S. assets, the yield on Agencies soared – and China very clearly moved back into the Agency market.
The Federal Reserve staff turns the reported custodial holdings into an estimate of actual purchases by adjusting for mark to market changes in bond valuation. In 2022, China bought $84 billion of Agencies. It added another $18 billion in the first 6 months of 2023 – so purchases of over $100 billion in the last 18 months of data. After adjusting for Belgium, China is estimated to have sold only about $40 billion in Treasuries over the last 18 months (it bought around $40 billion in 2022, and reduced its holdings by around $80 billion in the first 6 months of 2023 – with most of reduction coming in January 2023).
This actually even shows up in a very old, very bad U.S. data set that just tracks direct purchases from Chinese entities – that data set historically has missed a lot of China’s buying, as China often bought Treasuries from banks headquartered in Europe. But the Agency purchases are just sitting there out in the open.
The official U.S. balance of payments data – which uses the valuation-adjusted custodial data – also reports China’s overall bond purchases quarterly. This series, as official as any series can be, shows that China directly bought about $6 billion of U.S. bonds over the last 18 months (almost certainly mostly Agencies) even without adjusting for “Belgium/Euroclear” Treasury account. The Euroclear adjustment raises China’s estimated bond purchases over the last 6 quarters up by $55 billion, to a total of just over $60 billion. That isn’t a big sum, but the sign matters.
A bit of throat-clearing: the data here lags, and pressure on the yuan stepped up over the last 3 months.
It is possible China has been selling – or letting its bond portfolio roll off and building up its cash position – more heavily in August and September than it did previously. Time will tell. There was a modest reduction in China’s total holdings in the July data, which could have reflected actual sales or simply a decision not to reinvest maturing principal into new bonds
China’s own data isn’t all that reliable, but it doesn’t suggest significant use of China’s formal reserves over this period. That would argue against significant recent sales, but it isn’t conclusive.
More throat-clearing: from all the numbers above it seems that the U.S. TIC data primarily captures China’s formal reserves. Remember that the large state commercial banks don’t have access to the Fed’s custodial facilities, and they have done a lot of lending to help Chinese firms go out – so they aren’t primarily sitting on a big Treasury and Agency book. They clearly do hold some bonds, but those haven’t ever appeared cleanly the U.S. data.
This is all pretty old hat – at least to me. Watching China’s Belgium/Euroclear adjusted U.S. bond and equity portfolio has been about as interesting as watching paint dry over the last few years; China’s reserves have been flat, so it isn’t a surprise that China’s dollar holdings have been flat. That of course hasn’t stood in the way of a lot of somewhat poorly informed speculation about China’s dollar holdings after Russia’s invasion of Ukraine.
In reality, the interesting action has all been in the non-reserve foreign assets of the state banks and the policy banks (and they in turn have been funded out of “entrusted loans” from SAFE, and likely through other mechanisms.**
But there are a couple of notable things hiding in the U.S. data.
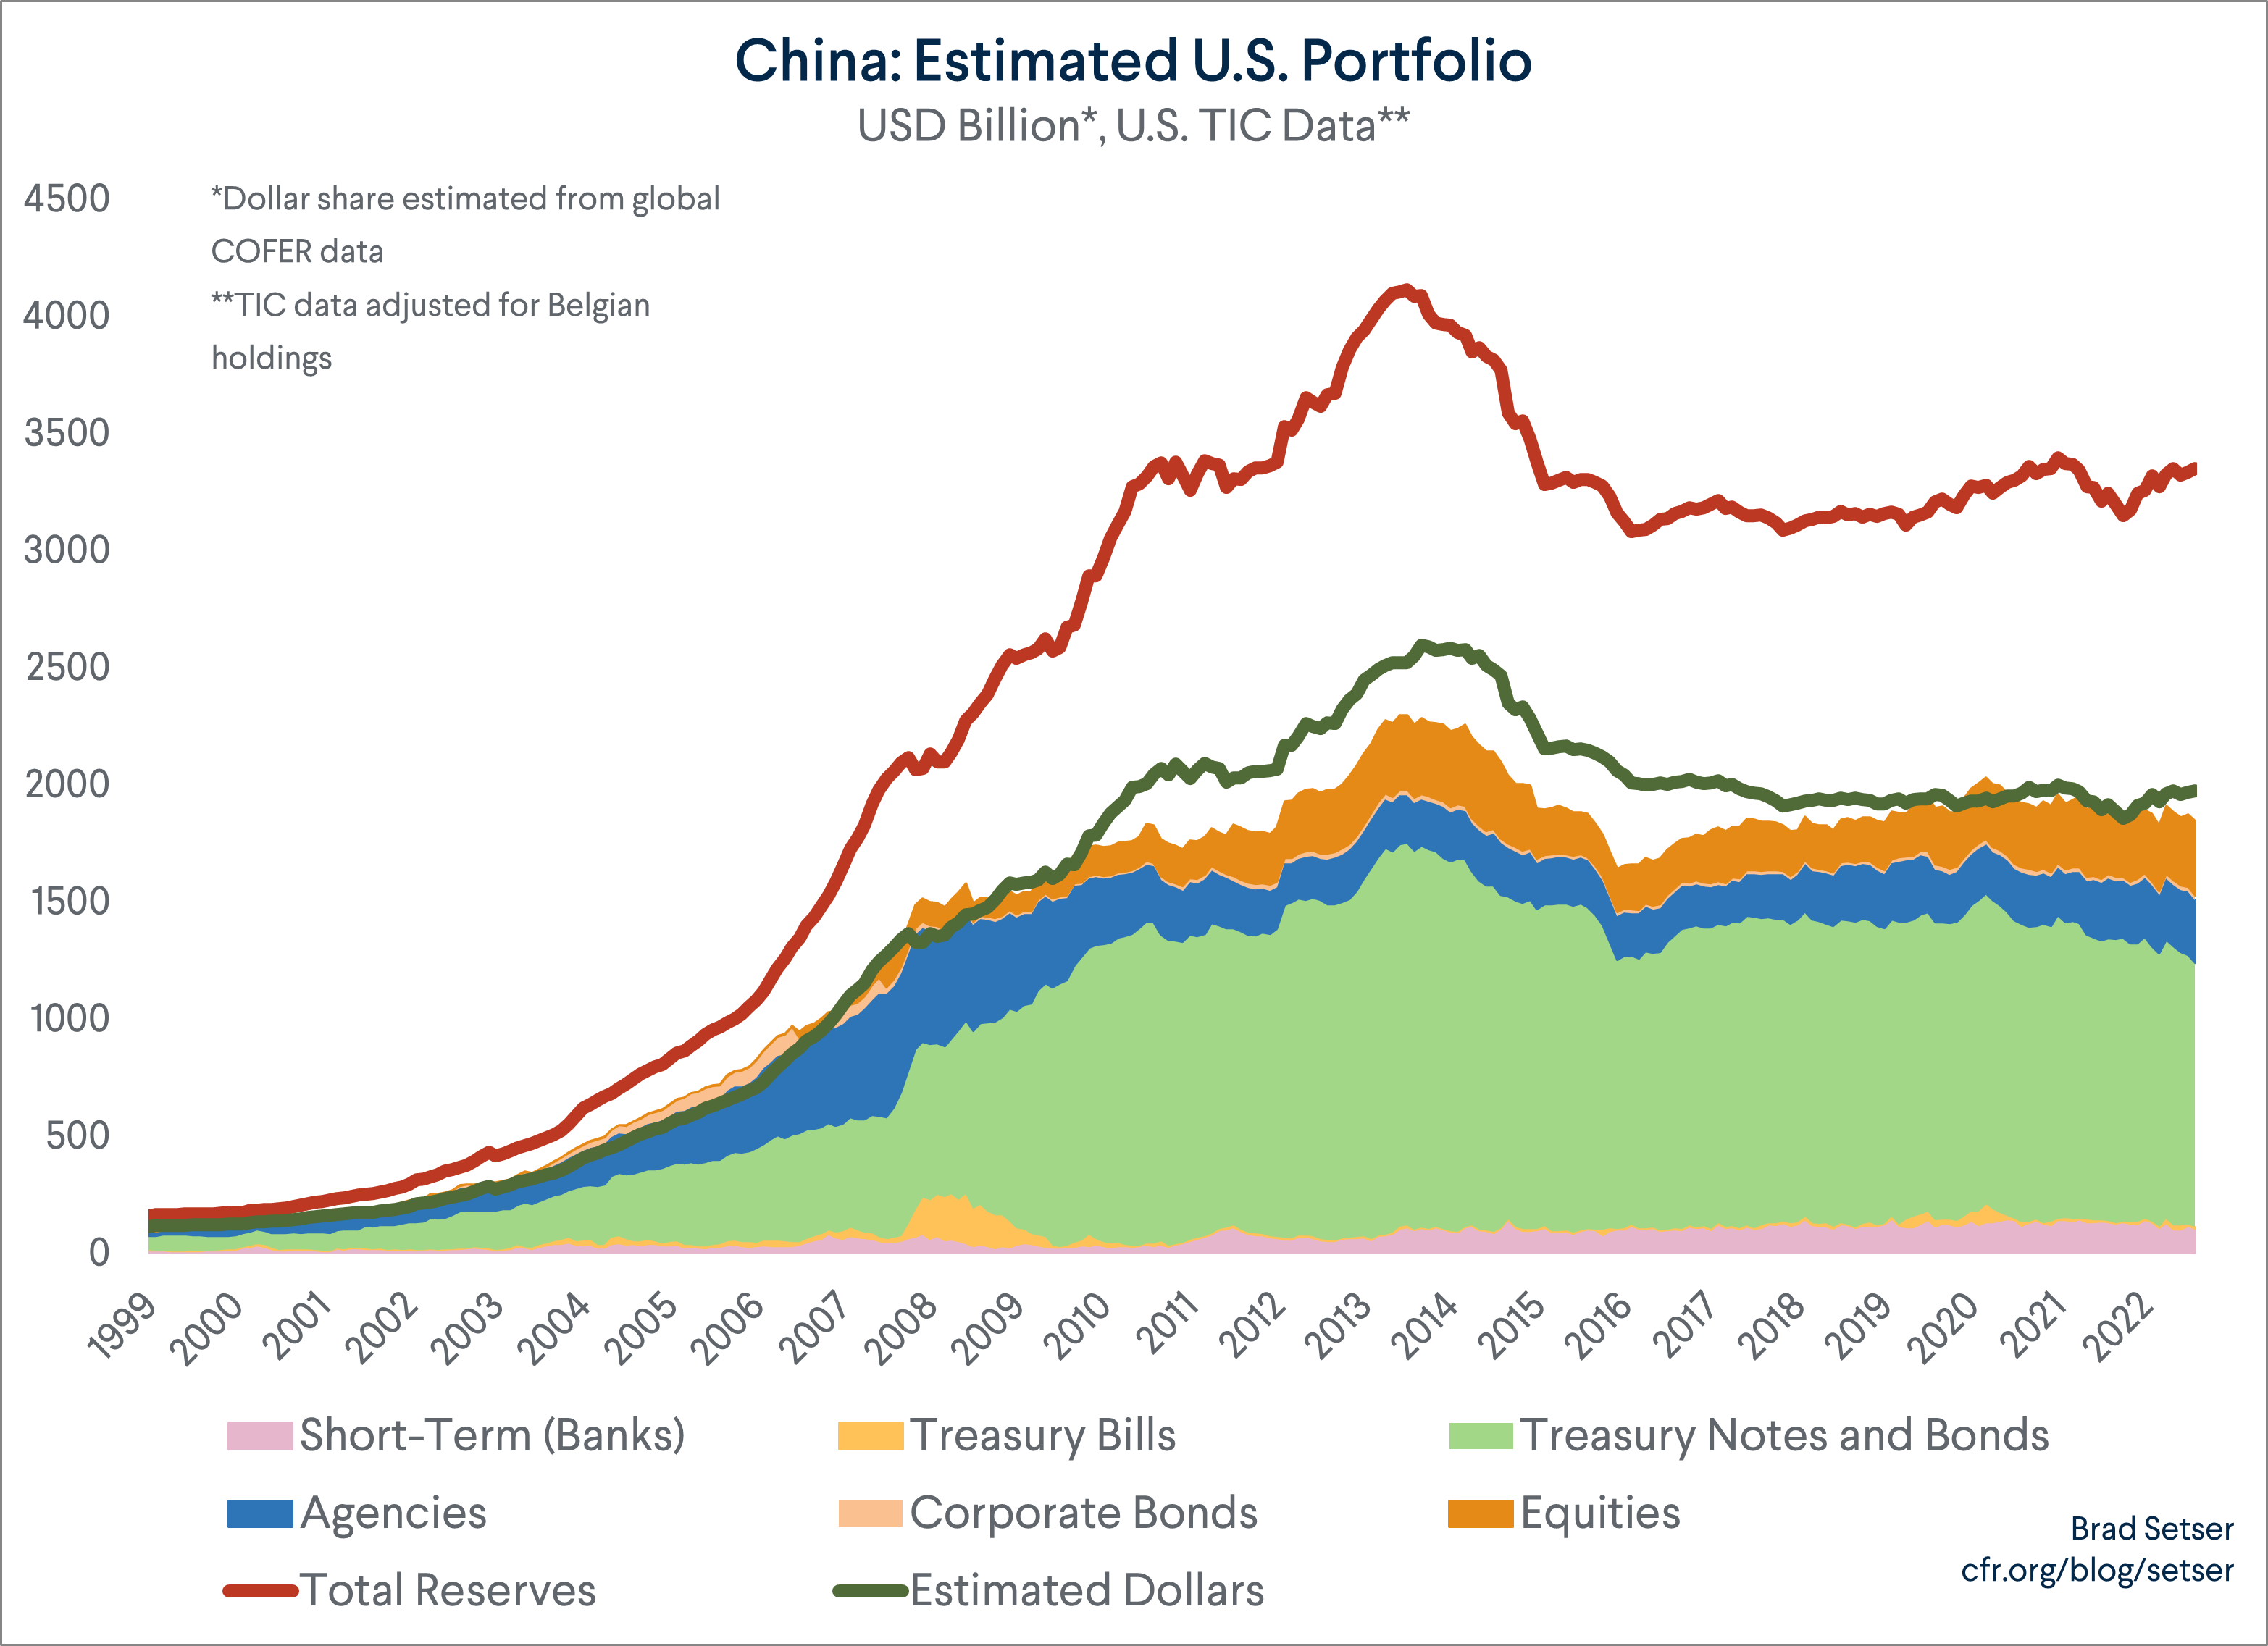
As I mentioned, the data on China’s total holdings, adjusted for Belgium, can be compared against China’s reported reserve share. It more or less confirms that China diversified out of the dollar between 2005 and 2015. In fact, it suggest that the diversification was mostly complete by 2012. China’s reserves actually seem to appear more cleanly in the U.S. data than the reserves of many other countries.
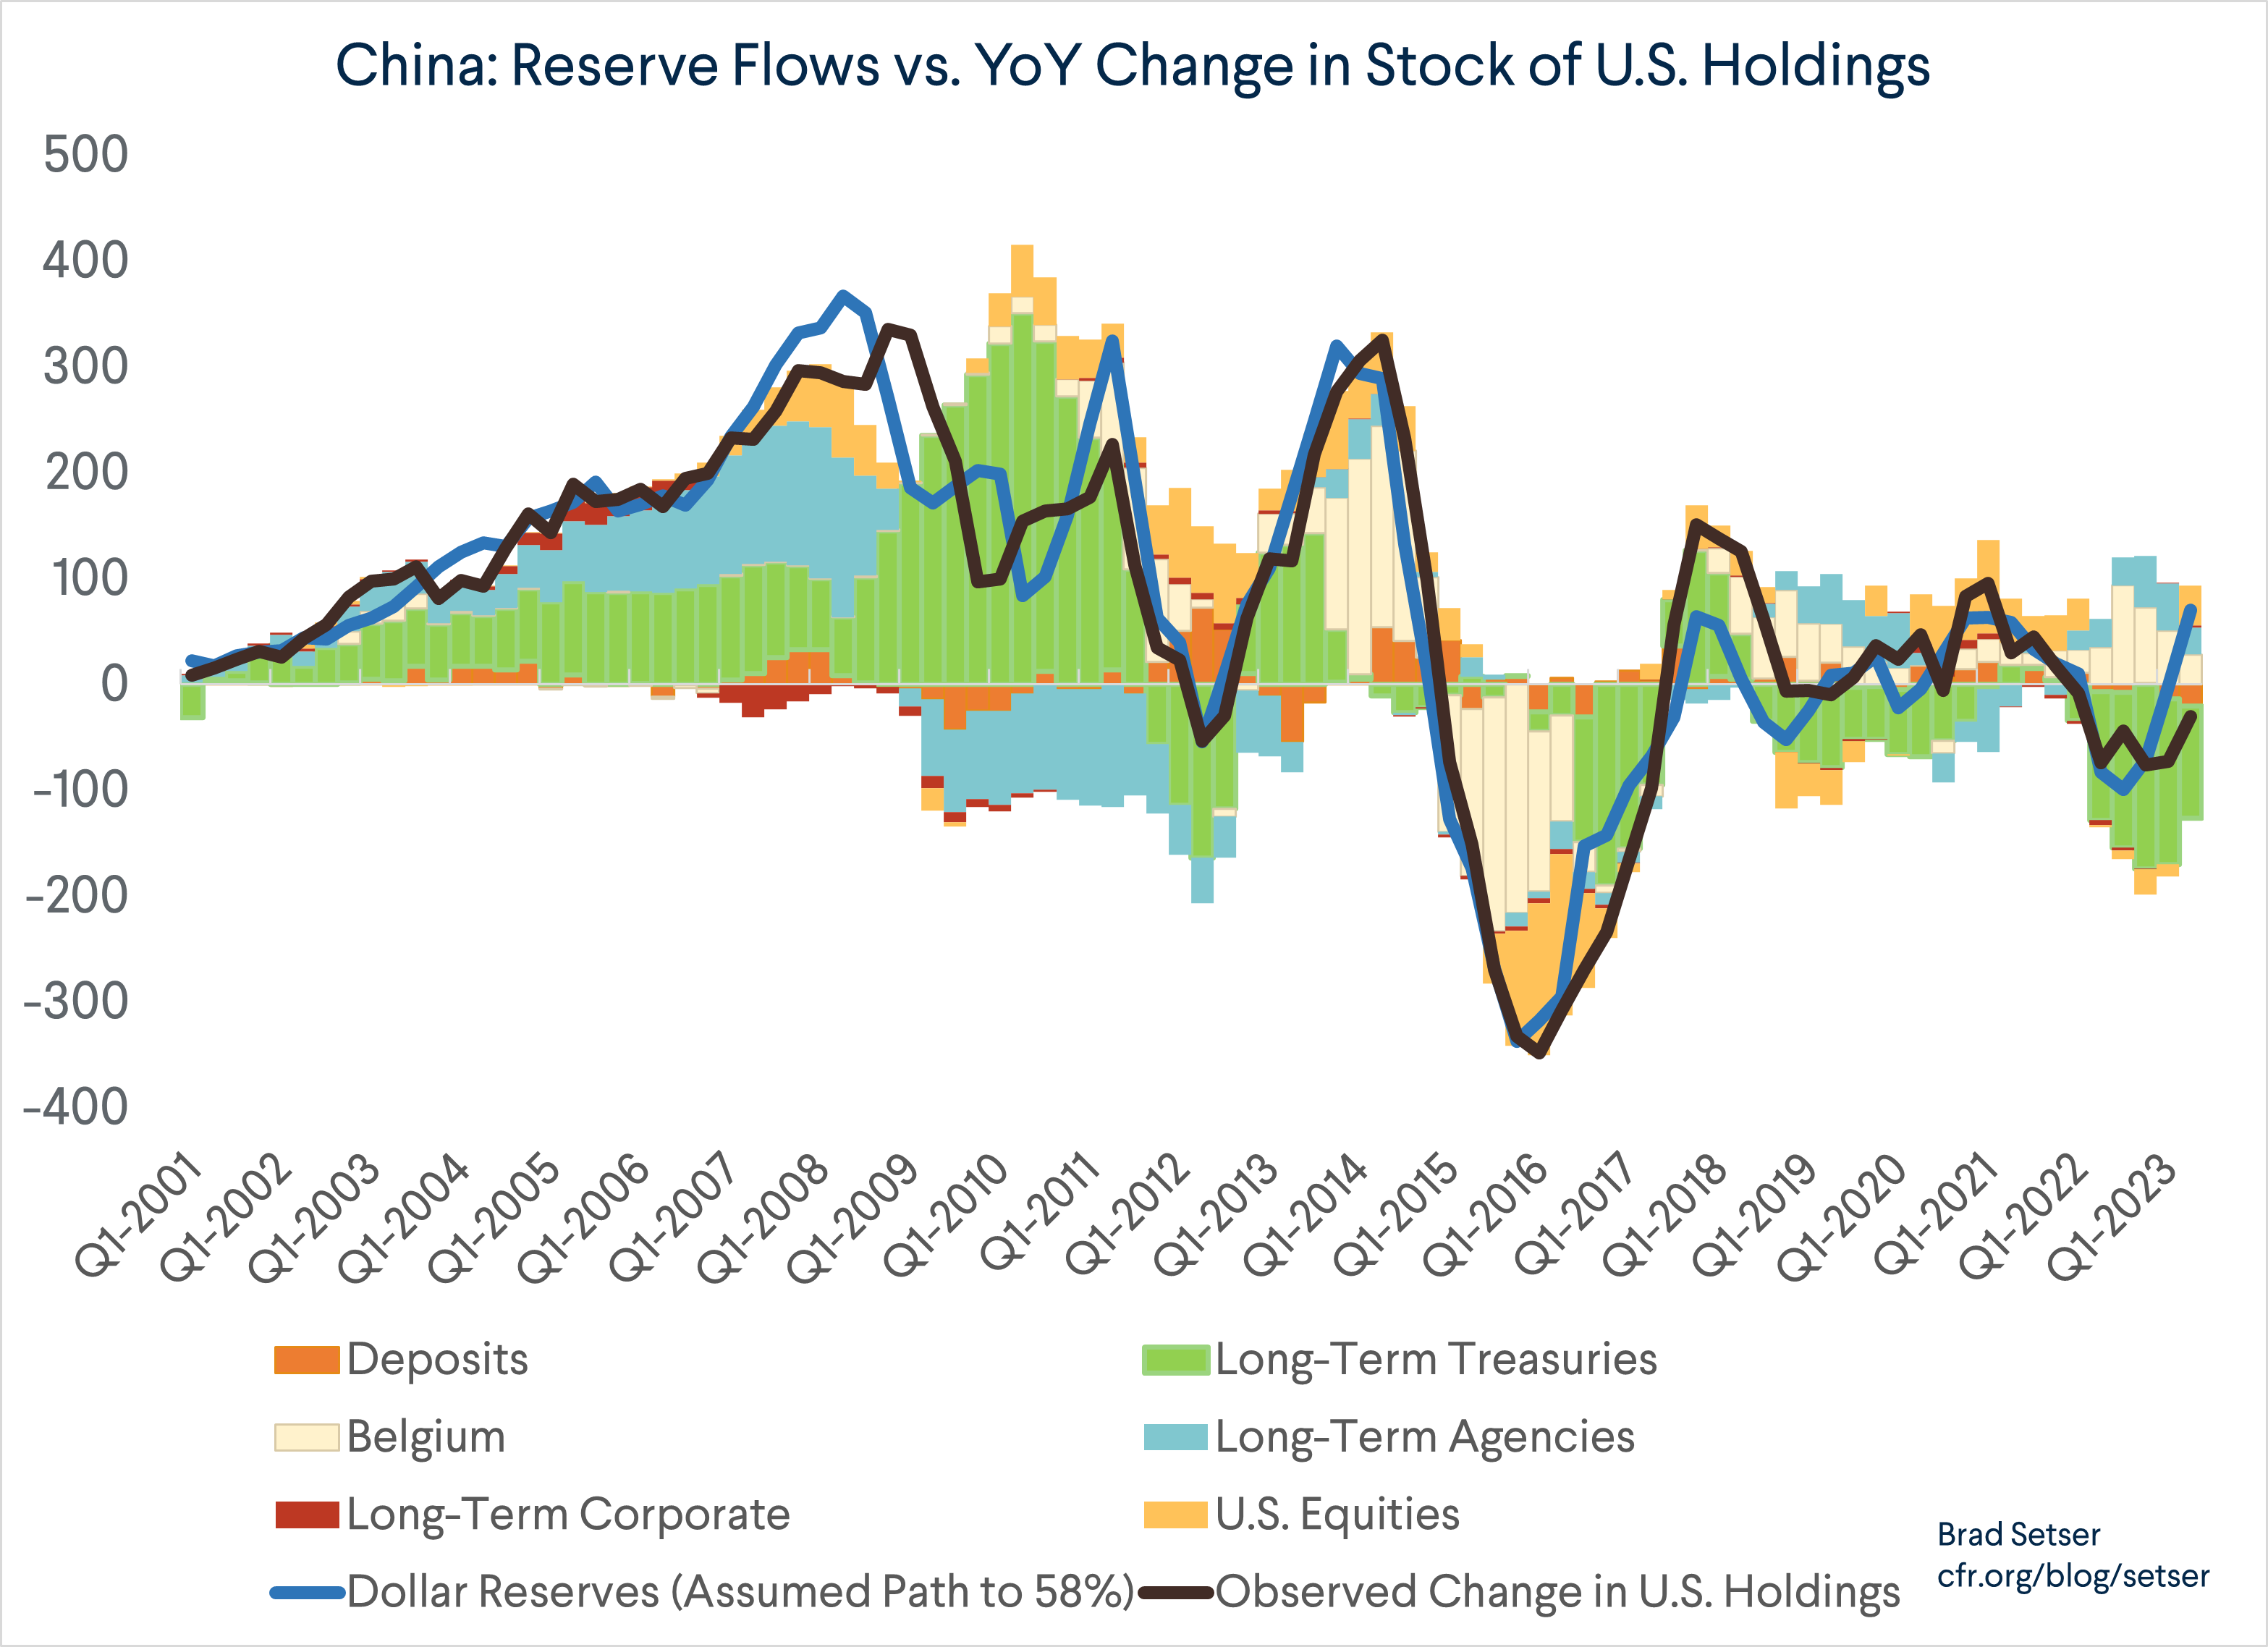
The change in the value of China’s U.S. portfolio can also be compared with the change that would be expected to maintain a 60 percent portfolio share of China’s reported reserves. The “fit” here has been quite good. Remember that in a constant portfolio share model, China is shifting toward reserve currencies that are falling in value against the dollar during periods when the dollar is gaining value, and shifting toward the dollar when the dollar is under pressure.
As this chart shows, including equities and adjusting for Belgium, the U.S. data actually has a good fit with the big changes in China’s reported reserves between 2012 and 2016.
The estimated flow (so adjusting for valuation) can also be compared with the flow that China reports (this uses the Bertaut Judson Federal Reserve data, which adjusts the custodial holdings series for valuation changes).
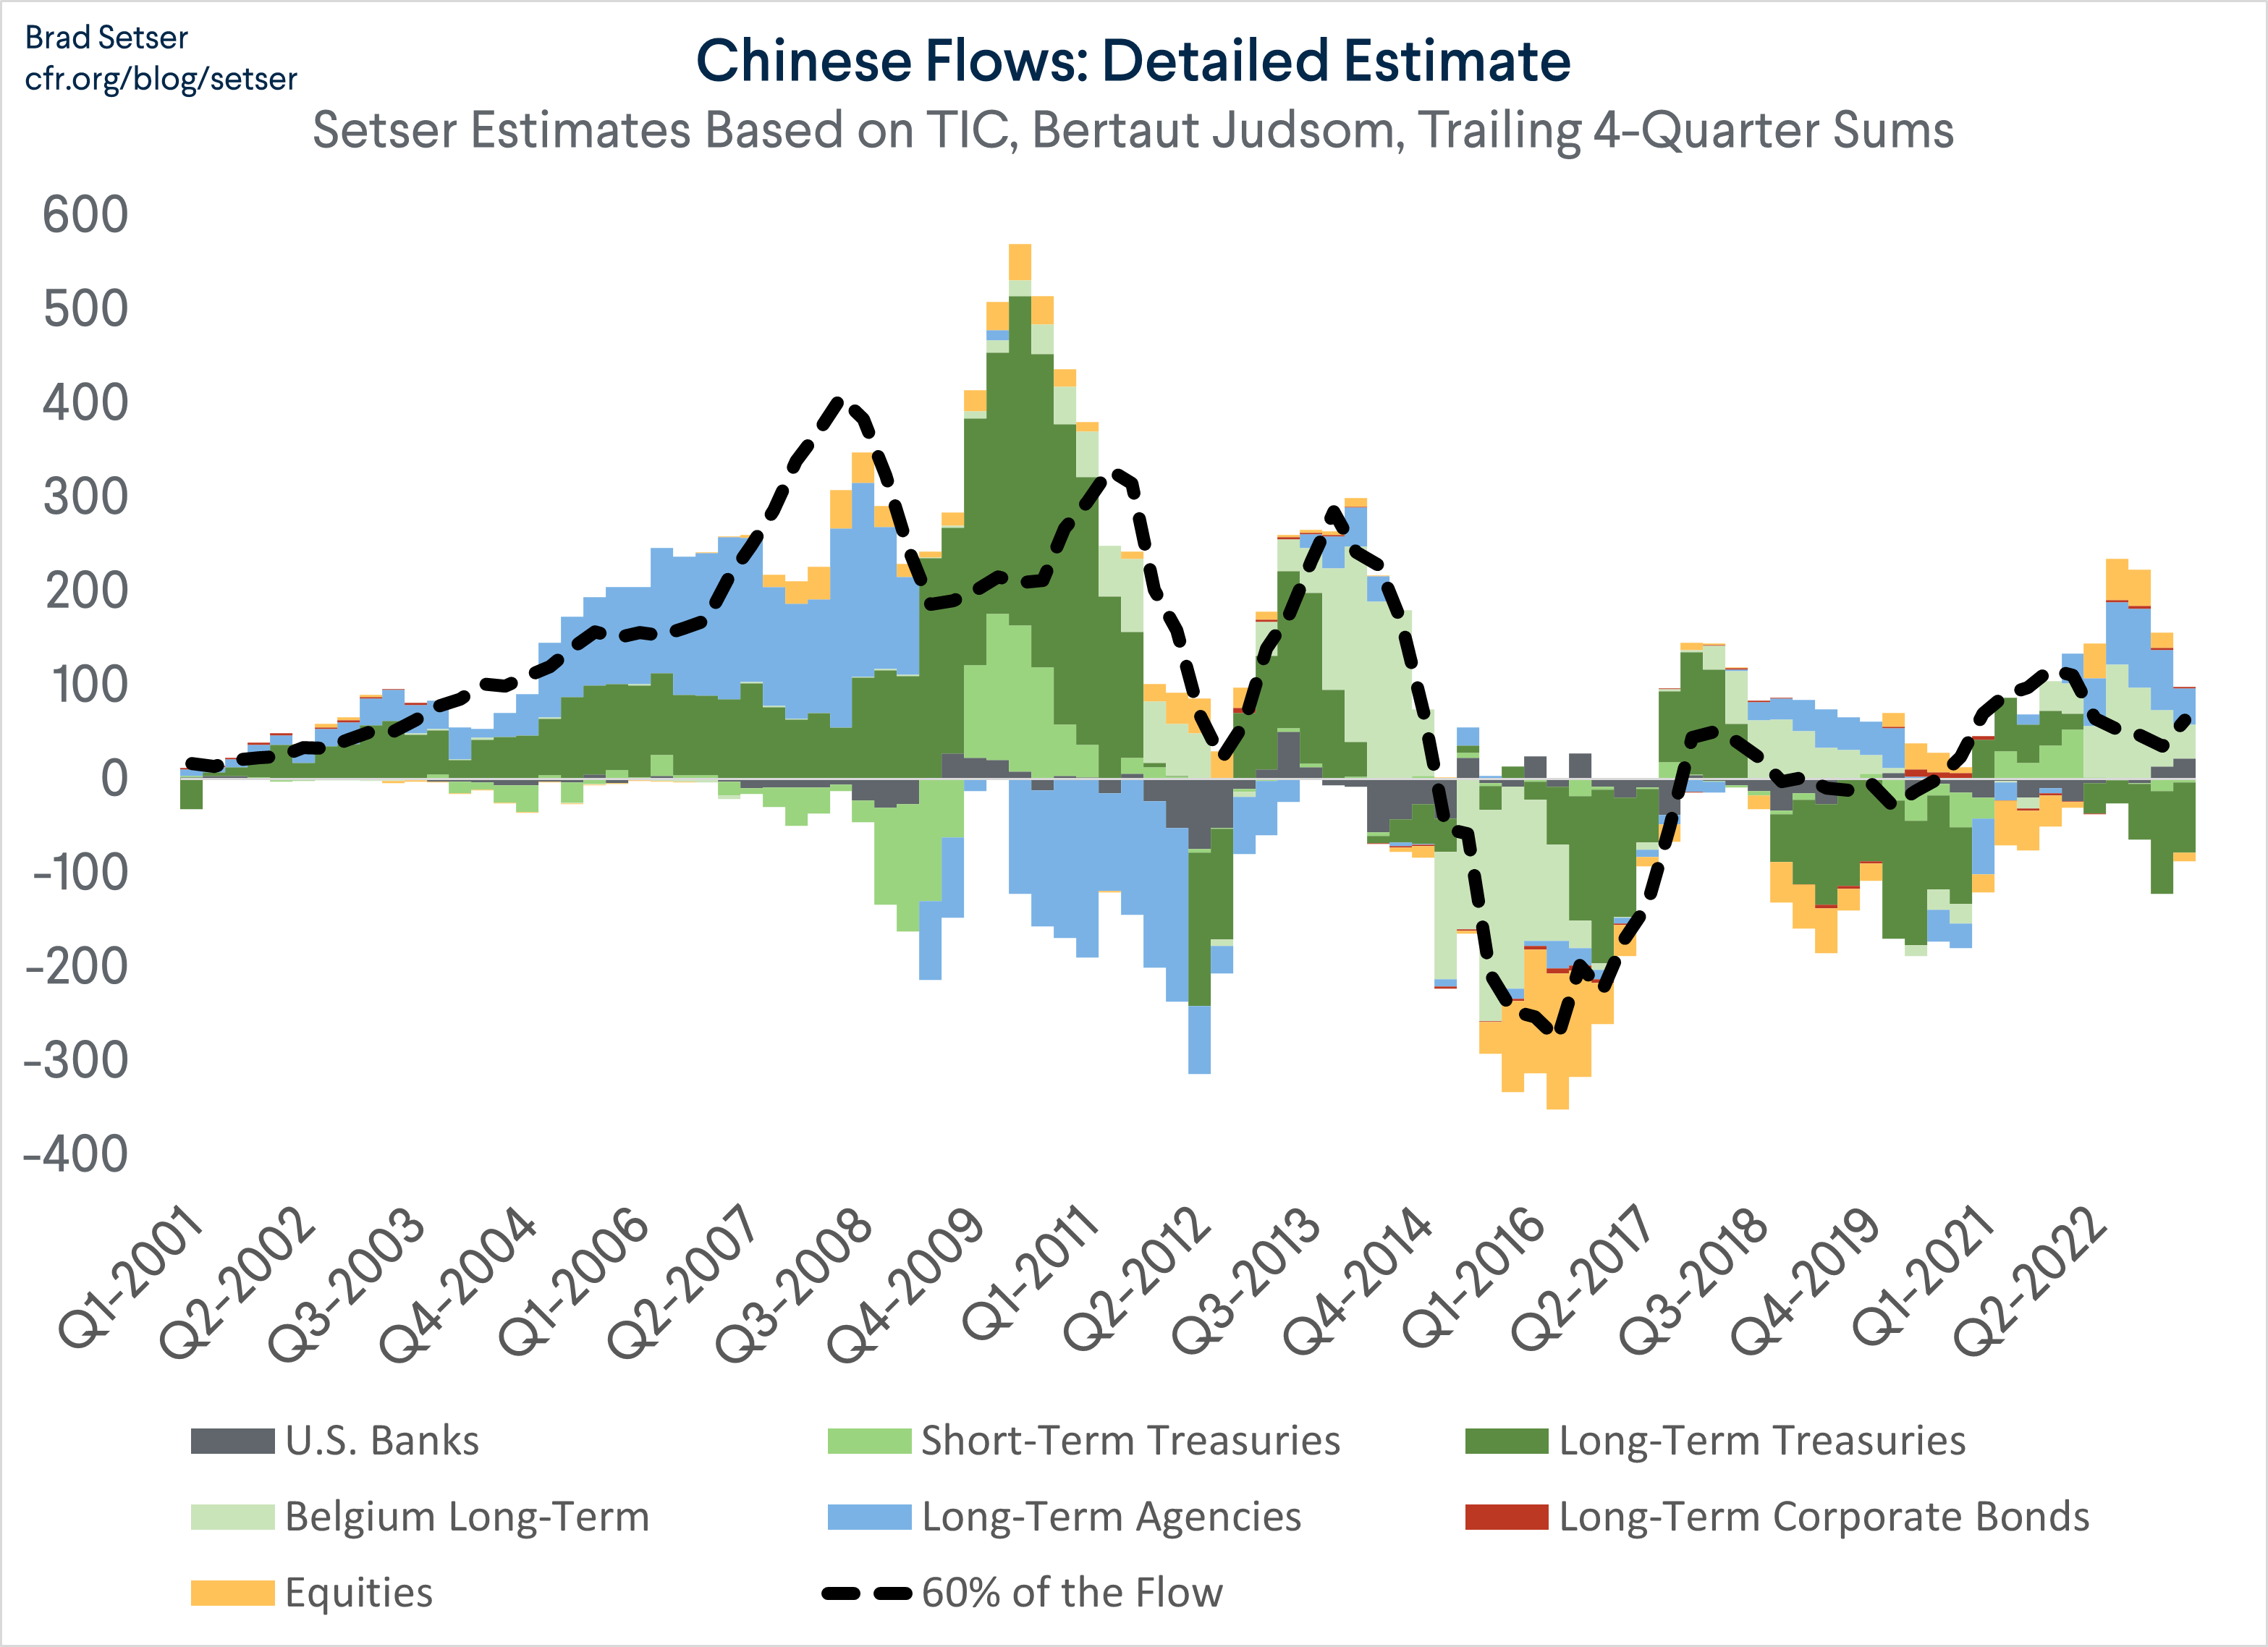
I am thus pretty confident that I can still track China’s reserve-related flows.***
At some point, these techniques will stop working – they require a bit of skill and accumulated institutional knowledge, and they hinge on being able to deduce the offshore custodians that China is using, and understanding that China’s U.S. holdings are still dominated by China’s reserve holdings. But for now, they still work – sophisticated reserve watchers know better than just to use the major foreign holdings data unadjusted.
Bottom line: the only interesting evolution in China’s reserves in the past six years has been the shift into Agencies. That has resulted in a small reduction in China’s Treasury holdings – but it also shows that it is a mistake to equate a reduction in China’s Treasury holdings with a reduction in the share of China’s reserves held in U.S. bonds or the U.S. dollar.
*The Fed doesn’t offer custodial services for corporate bonds, and Belgium and Luxembourg also dominate the global data on foreign holdings of U.S. corporate bonds.
**Kevin Gallagher reported that the China Development Bank (CDB) got over $100 billion in funding from entrusted loans ten years ago. In 2015, the CDB and Export-Import Bank of China received a capital infusion of almost $100 billion through the conversion of a portion of SAFE’s entrusted loans into equity, which I wrote about in June and was also covered by Reuters. In 2020, SAFE disclosed that it started its entrusted lending back in 2011. This isn’t even really a secret, though – China doesn’t like to draw attention to it – and the IMF hasn’t really bothered to investigate.
***Tracking the non-reserve flows is much more difficult. No one, to my knowledge, does it better than Brad Parks and the team at Aid Data, which tracks Chinese external lending in great detail based on disclosure by China’s borrowers. Almost all of the loans of China’s two big policy banks have been in dollars. Some recent support to troubled borrowers (the “Bailout Along the Belt and Road”) has taken the form of PBOC swap lines, which are obviously in CNY. The yuan works perfectly well for window dressing reporting (gross reserves) – particularly now that the yuan is in the SDR basket. Argentina also was able to use the yuan swap line to make a set of payments back to the IMF, as the IMF accepts payments in all components of the SDR basket (and in its own SDR for that matter).