Behavioral Economics in the Age of Big Data
Event date
Speakers
Presider
The Robert B. Menschel Economics Symposium generates critical thinking about the consequences of herd mentality behavior in global economics. The 2018 symposium will examine the insights that big data has provided into economic—and political—behavior.
This symposium, presented by the Maurice R. Greenberg Center for Geoeconomic Studies, is made possible through the generous support of Robert B. Menschel.
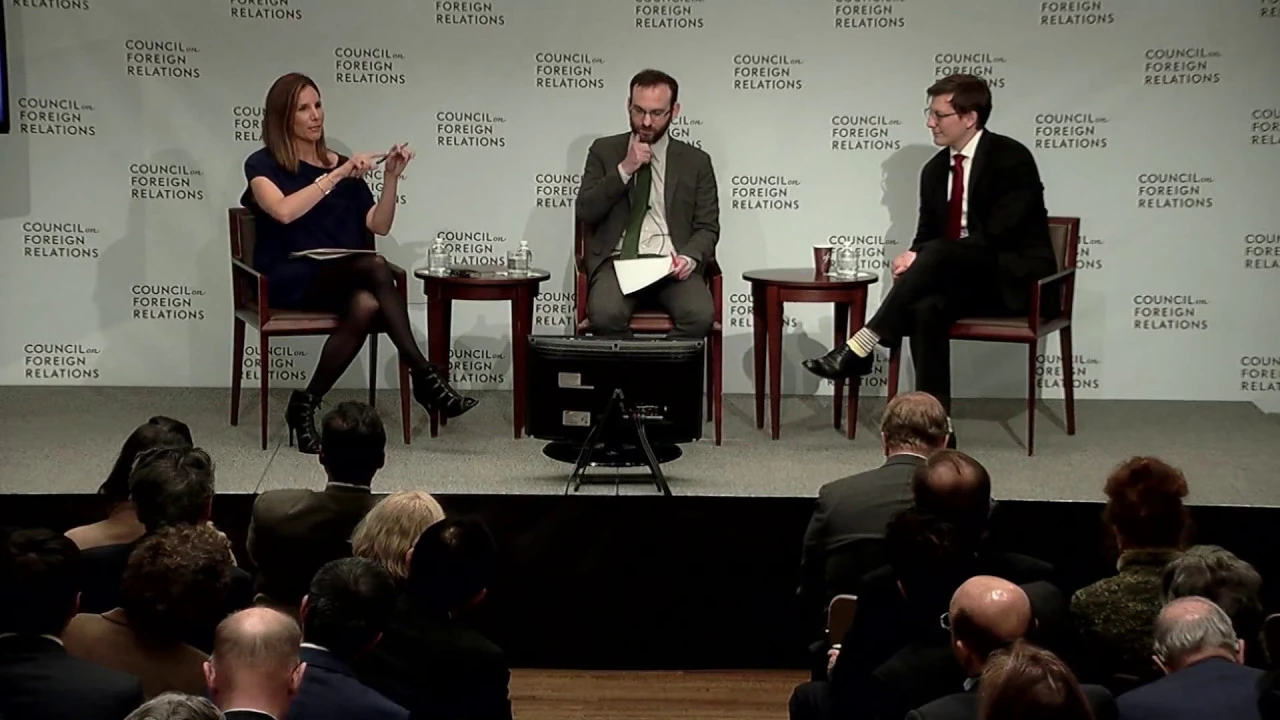
GALLAGHER: Good afternoon, everyone. Welcome to the second session of the Council on Foreign Relations Robert B. Menschel Economics Symposium, Behavioral Economics in the Age of Big Data. I’m Leigh Gallagher. I also want to, by the way, thank Robert Menschel for his generous support of this program. We’re all indebted to him for this. I’m Leigh Gallagher and I’ll be presiding over today’s discussion. And in the name of bipartisanship among your moderators, I am an Eagles fan. (Laughter.)
We are—at this time—whoa, sorry. We’ve got a great conversation today. Behavioral economics seems to be the hot new thing. I guess we could say that for many years now. But big data is sort of the latest wrinkle, and it has tremendous implications. So we have three fantastic panelists with us today. We have Hersh Shefrin, who is coming to us by satellite in California. Hersch are you there?
SHEFRIN: I am. Hello, Leigh.
GALLAGHER: Hi. Thanks for being with us. This is not even really a delight; this is very impressive. Thanks for being with us. Hersh is a pioneer in the field of behavioral economics. And our other two panelists are experts in data and what we can learn about behavior from it. Seth Stephens-Davidowitz worked at Google. Hal Varian mentioned him a few times. It should be noted that both Hal and Peter Orszag were at one point Seth’s boss. So when does that happen? (Laughter.) Anyway, Seth worked at Google as a data scientist and uses dad from the internet to gain insights into the human psyche. So he can tell us a lot about ourselves and our true nature. So that might be a little scary. (Laughs.) Dan Wagner was the chief analytics officer for Obama for America—the Obama for America campaign in 2012, and is now the founder and CEO of Civis Analytics, which provides data analytics for companies. So welcome to all of you.
Hersh, let me start with you. You are our behavioral economist on the panel. Can you just tell us—I guess define behavioral economics for us, maybe. But also, it seems that we are in this sort of era of behavioral economics. It wasn’t always so popular. Now it is. So give us some context for that. And also when big data started to enter the field, from your perspective.
SHEFRIN: Thanks, Leigh. I’d say as a definition, the way to think about behavioral economics is that it’s the study of how psychology impacts economic behavior through our motivations and our judgements, the way that we interpret data and then use data as a basis of making decisions. You know, I just want to add something quickly. A lot of people think that behavioral economics is about people being irrational. I’d say it’s more that people are imperfectly rational. And that if you think about the glasses as half-full, it will sort of help to think about behavioral economics as a way of pointing to how the glass can be a little bit more full as we move forward.
In terms of—in terms of behavioral economics getting hot, well, you know, it actually was hot in the days of Adam Smith. And one of your—one of your questioners mentioned John Maynard Keynes. He was a behavioral economist without doubt. If you read the General Treatise from 1936, the word “psychology” appears many, many times in that treatise. It’s just that economists got into the idea of thinking, after World War II, that psychology wasn’t important. And so it sort of wound up getting forgotten. But back in the ’70s, Dick Thaler and I started to think about bringing—ways of bringing it back, psychology back into economics.
And I say that probably a recognition that big data was going to be important, that started to happen in the late 1990s when people began to understand that if you wanted to do experiments that you could—you didn’t just have to rely on undergraduates as subjects for experiments, but you could start to use the internet, per se. And I think there was an inkling about that, but I don’t think we really saw how big a role it was going to play until a little bit of time had elapsed.
So I hope that sort of answers the questions that you had in mind. I can—you know, I can go on a bit if you want and talk about the connections I see between big data and behavioral econ. But let me just sort of turn it back to you to see how you’d like to proceed.
GALLAGHER: Sure. Sure, sure. That’s a great overview and we’ll definitely have ample opportunity to get back to you. I’d like to talk about some of those connections.
Let me jump over to Dan next. Dan, can you just give us a little bit of—tell us about your background, your work on the Obama campaign. And can you tell us also how behavioral economics plays into your work today?
WAGNER: Sure. So I disagree with Hersh a little bit, in that irrationality isn’t totally part of it. I think the most recent election is an example of behavioral economics as a demonstration of irrationality. (Laughter.) But that’s my point of view.
GALLAGHER: Hersh? (Laughter.)
WAGNER: OK, good.
GALLAGHER: OK. (Laughter.) He’s on video conference.
WAGNER: So beginning in the early 2000s, there was a movement within political science to try and understand some of the psychological attributes that were driving decision making around participating in politics and how people thought about politics in terms of candidates and parties. And obviously that has evolved considerably over time. And the way that we began to think about the role of behavioral economics was kind of dividing them between these kind of two classes of rules. Number one is, behavioral economics was essentially the study of decision making, taking into account psychological attributes such as social position, normative behaviors, et cetera. And data science was more or less fancy statistics using lots of data to figure that out.
Behavioral economics became the underlying theory that we were thinking about, consuming a lot of theories from academic journals, especially research around social pressure and crowd behavior around elections. And data science became our measurement vehicle to try and understand the behavioral—of these types of psychological attributes and actually defining behavior and opinion. One of the formative experiments that we did before the election is we began to try and understand what was motivating turnout. And we tried two pieces of content. And our question was, again, what motivates people to turnout. And so we began doing these largescale experiments, both offline and online.
And the most notable experiment that we did—again, assessing this question about what motivates people to turnout—is we had these two pieces of content. One was a persuasive message that provided—a kind of glossy piece of mail and digital—that had a picture of the candidate, his family, and gave a set of logical reasons for why you should vote for this candidate instead of the opposing candidate, both in terms of the national context and the local context, and providing you some personalization around him. The second was a letter from the state senator—or, rather, yeah, the federal senator in their state. It was kind of a boring kind of construction, but it referenced their previous participation in the last election, notified them that turnout in this election was going to be pretty high, and encouraged them to vote in this election along with their neighbors.
So we basically provided these two pieces of content. One was an exciting piece of persuasion and two was kind of a boring validation from their senator encouraging them to vote, and kind of referencing their previous history in voting. So I’ll do a little poll in terms of what people think, and I may have given away the result. But I think one is kind of persuasion and then two is the second piece. Who thinks one? Yeah, so this is a loaded question—(laughter)—so I’ll just go to the results. So at this time, this is kind of a big result in political theory, because our—both the kind of predominant thinking in the Democratic Party and—more so the Democratic Party than the Republican Party, is that communicating to logic and reason was the effective way to motivate people to turn out. Turned out to be a complete lie.
What motivated people to turnout was essentially the social pressure around participation. And kind of driving more or less, reinforcing this kind of herd behavior and attitude, especially towards people that were less likely—less habituated in voting. People that were already habituated in voting, it more or less became the normative religion to them. But people who weren’t habituated to voting were kind of directed by a different thing, and that was directed by a different theory.
And since then, the kind of replace—so, in terms of what this did and the relationship between these two things, behavioral economics set the standard of theory. Data science became the vehicle through which we are measuring that. And we’re measuring it through two ways. One was kind of the prediction, which is the experimental basis on which we measure these different interventions and the economics behind it. And then two is the attribution, which is ex-post how are you evaluating the effects of those different kind of experiments? The internet obviously being the biggest natural experiment in human history.
And so those kind of two standards of data science have helped us, both in context of elections but also in companies and governments, assess the kind of value of these different interventions that we create proactively or that we can see in terms of evaluating there the causal effect of those things ex-post.
GALLAGHER: So it can really help you figure out what buttons to push. And in the example of the previous tactics, we were pushing the wrong buttons to get the result.
WAGNER: Yeah, yeah. The idea of buttons, what buttons work, and then what buttons you should change over time. There you go.
GALLAGHER: OK. Well-put, OK. (Laughter.) Seth, tell us a little bit about your work both at Google—and you talk a lot about experimentation and what you have discovered in that realm. So tell us a little bit about that.
STEPHENS-DAVIDOWITZ: Yeah, so I’ve been doing research over the last six or seven years on what we can learn from people’s internet behavior, particularly their Google searches but also other sources. And I think there are really two advantages to Google searches relative to other traditional data sources. One is people tend to be really honest on Google. So they tell things Google that they might not—tell things to Google that they might not tell anybody else. (Laughter.) And this is different from surveys, the traditional look into people’s psyche, where people sometimes lie, and they tell what they think the surveyor wants to hear, not what is the truth.
Actually, the thing about turning out to vote, it’s really hard to predict before an election who’s going to actually turn out to vote in an election because more than 50 percent of people who don’t vote tell a survey they’re going to vote. Sure, sure, sure. I’m going to exercise my civic duty. Either they are lying to themselves or deliberately deceiving the pollster. We can actually see in Google searches weeks before the election—even by mid-October—there’s high predictive power in searches for vote and voting. So people who are searching how to vote or where to vote weeks before an election are much more likely to actually turn out to vote.
One of the things you saw in the previous election was that African-American turnout was going to be much lower than previous elections because in cities—it’s anonymous and aggregated data, but you see in cities that are 90, 95 percent black there was just a huge drop in searches for vote and how to vote and where to vote. And this is one of the reasons that Hillary Clinton did worse than the polls suggested, because a lot of the models—because you can’t trust what people say—just assumed the electorate would look the same as it did four years earlier. And the Google searches where people are more honest, where they’re actually looking for information they need, was saying that the electorate was going to look a lot different, that it was going to be a much small black part of the electorate.
So there are many examples. I’ve studied racism and sexual preferences where the data from surveys are very different from the data that you can get online. And I think it’s behavioral just because I think more and more of economists these days—I think in some sense we’re all behavioral economists. I think, you know, 30 years ago, 40 years ago when you went to get a Ph.D. in economics, so much of it was these models of human behavior, theoretical models, assuming that people are going to act in their rational self-interest. And I think more and more economics and all the social sciences are all about empirics and data.
So—and I think that’s because of behavioral economics, because we realized you can’t just put a model that assumes people are going to be totally rational. You have to actually see how they behave. And with all the data, we can do this. So I think—I don’t even think to myself: Is it behavioral, is it not behavioral? I just think, what are people doing.
GALLAGHER: Mmm hmm. And what are they not saying?
STEPHENS-DAVIDOWITZ: Yeah, what are they not saying, yeah.
GALLAGHER: So just—so when we all here type in something in Google and the predictive—it fills in for you. You know, if I type in, I don’t know—well, here’s an example. I wrote a book called The End of the Suburbs a few years ago. And I just—during my research I typed in the “the suburbs are.” And what came up was: horrible, boring—you know, it totally supported my theory, which is—(laughter)—no, I’m not an anti-suburb person. But, anyway, can we trust that? Is that really what the world is thinking?
STEPHENS-DAVIDOWITZ: I think—I think we have to be a little cautious. I was probably a little under-cautious. I was so excited when I first saw this data, and then you do see all these windows into people that they don’t normally say that I’m like, oh my God, this is accurate and everything else is garbage. And I think it’s not totally true. I think there is a pressure on Google. There’s probably—every data set is biased towards what’s socially acceptable. So surveys are biased towards what’s socially acceptable. Facebook and social media are really biased to what’s socially acceptable. People are—you know, exaggerate how good their lives are there. (Laughter.)
And I think—I think Google, because people are alone and they’re by themselves and they’re looking for different information, they tend to tell the things that they don’t tell anyone else. So if all day you’re saying how much you like your suburban life, then you kind of go to Google and just say the suburbs are horrible. (Laughter.) So it’s not—I don’t think it’s—that there aren’t people who like the suburbs. There’s definitely a different view of people, and you show them—which is kind of psychological, that people have multiple sides. My favorite example is you compare how people describe their husbands on social media and on Google. (Laughter.)
So on social media if you look at the top way people complete the phrase “my husband is,” it’s my husband is the best, my best friend, so amazing, a total joy, awesome. And then on Google, it’s my husband is a jerk, annoying, obnoxious. So it’s very different view of people. And I don’t think one—I don’t think one of them is right. I don’t think that marriage is all that the husband is a jerk, the husband’s annoying, I think—but I think they’re somewhat in between and that it is interesting that the two sources get such a different—show such a different picture of marriage.
GALLAGHER: So, Hersh, we can rely on data to, you know, to do all this—all of this work for us, but as long as there are humans involved, I mean, there is going to be some susceptibility to groupthink in economics. Is that right? I mean, talk to us a little bit about that, the overreliance on data.
SHEFRIN: I think that—well, big data is going to give us big advances. And I think that’s really going to grab our attention and make us very excited about the whole concept.
When Dan talked about what motivates people to vote and there being collective pressure, I think that collective pressure is at the heart of what constitutes groupthink and the way that groupthink and big data will come together to make decisions.
So I have this concern that big data, while it will bring big advances, will also bring big dangers and big mistakes because of the tendency to either exploit big data or to ignore big data. So the kinds of issues that, you know, concern me as I, you know, think back in the past—and in fact, it doesn’t have to be that long ago—you know, have to do with, you know, big disasters like the nuclear meltdown and Fukushima Daiichi or the Deepwater Horizon explosion in the Gulf of Mexico. Those sorts of—those sorts of—oh, or thinking about New York, how it is that the SEC missed Bernie Madoff after five investigations—not just once, twice or three times, but five. In all of those instances, groupthink played a really important role because collective pressure led people to make judgments that were different than they might have had they been, and I’ll say, perfectly rational.
So I think the interactions are going to be that because big data is going to be so powerful that when groupthink is a driver it can really magnify our vulnerability to what happens. Because in groups, we either want to please strong leaders—and I’ll say that I don’t totally agree with Dan’s initial comment about the nature of the most recent election, because I think we are now seeing groupthink fostered and encouraged as an active policy. But I think that we just have to be very vulnerable and aware as to exactly what can happen.
If you are overconfident about the strength of your organization to deal with the problems—for example, data breaches—then we’re going to see more problems like Equifax where we had both IT vulnerability, but we also had organizational vulnerability, and groupthink operated by making that whole organization feel that the risks were much lower than they actually were. So that one person—it only took one person to make a mistake and not pass along a critical IT update for 143 million accounts to be breached, one person. Where else did one person make a big problem? Ask anybody in Hawaii what it felt like—(laughter)—to think that you might have just 30 minutes left to live before a nuclear bomb was dropped on you.
So those kinds of—those kinds of issues are significant and important and they’re part of the human psyche. So it doesn’t—you know, it doesn’t—it shouldn’t surprise a behavioral economist who’s familiar with just how strong groupthink issues are to think about what would—what would be more effective in terms of encouraging people to vote.
And, you know, I’ll just say I wrote a Huff Post piece a week before the last federal election, because one of the things that worried me was that for psychological reasons the turnout for Hillary would be lower than people thought because they just weren’t excited by her. And what excites you, what grabs your attention, that really is critical. It’s what—it’s what speaks to your nucleus accumbens, what lights up in your brain, what generates dopamine. I mean, all of those things are absolutely critical. And it’s not what you think about rationally and coolly, but what mechanisms get activated neurologically that wind up being so important.
GALLAGHER: Dan, let me go back to you on that election point. Do you think that with the proper use of data we should have been able to properly predict where the results were headed?
WAGNER: Yeah. I mean, the question of behavioral economics is not so much what is the behavior, it’s to what do you attribute the behavior. And the big failure in the 2016 election was a measurement failure where turnout was a little piece of it, but when you actually look at the kind of distribution of votes that were lost between 2012 and 2016, the majority of that was not because people didn’t turn out, it was because many people changed their votes from candidate A, Barack Obama, to candidate B, Donald Trump. So that was a kind of, like, causal reason within these states that you saw such a drop in vote share in Michigan, Pennsylvania, and Wisconsin.
So when you—when you’re trying to understand that, the primary piece that’s interesting from a measurement point of view is, why was the measurement so wrong in those states? And there’s a few root causes for that, but the primary root cause is a lot of these people who supported Trump decided to not participate in the surveys because of a loss of trust in institutions broadly, feelings of deep resentments, feeling of mistrust. And so a lot of these folks were saw were kind of participating in kind of behavioral and social environments, but reduced their participation in a lot of surveys. And as a result, that was a primary kind of miss.
And if you look at what were the places where those measurements were most off—because you look at Virginia, it’s fine. You look at Colorado, it’s fine. You look at some other states, it’s fine. So why was it so off in Pennsylvania, Wisconsin, and Michigan? The reason is because you have the highest density of marginalized populations, not economically marginalized, but culturally marginalized populations that have the highest density of racial resentment, feelings of isolation, deterioration of communities, et cetera.
And as a result of their institutional feelings of isolation, the result of that is they didn’t participate in the primary measurement vehicle that we use to understand these folks. And that was why we missed. And that should have been known much earlier.
I think there’s been a catch-up in terms of how to evaluate that measurement bias over time. But we—we would have known had the measurement been correct, but the measurement vehicle that we used to understand the underlying psychology of why people were voting a certain way or why they weren’t was wrong.
Now, if you’re in a company, you should be freaking out because the same kind of measurement vehicle that’s traditionally used to understand behaviors and elections is the same type of measurement that’s used to understand brands, policy, et cetera. And if that measurement vehicle is broken for a huge percentage of your population, then you’re going to suffer the same kind of measurement issue about your products, your policies, et cetera when you have this kind of heterogenous difference in how people trust institutions and in the measurement vehicles that are behind those institutions.
GALLAGHER: Can you give us an example of a product that sort of misfired in the commercial marketplace because of that?
WAGNER: Well, I can’t—I probably can’t give a specific example, but here’s a—here’s a recent one that we kind of looked at a while ago. So you had that Audi commercial that came out in the Super Bowl a couple of years ago. Now, if you’re somebody in this room, which is kind of, like, you live in a city, you’re broadly educated, you have kind of a shared set of normative values around the participation of women in the economy—
GALLAGHER: What was the commercial again?
WAGNER: It was a—it was a—it was a little girl driving down in a soapbox car down a hill and her father was kind of congratulating her. She won and she beat a bunch of boys, right? Kind of, like, the message of that was female empowerment in an area that had been broadly owned by men, which is racing cars, right, of any sport that has the highest disproportion between male and female participation. It was just, like, driving yourself and nearly killing yourself in a gas-laden metal vehicle, right? (Laughter.) Why people do it I have no idea. (Laughter.)
And so, if you ask somebody in this room did you like that commercial, many of you maybe had been in tears, right? It was so wonderful, blah, blah, blah, blah, blah, right? (Laughter.) But if you do that experiment to a lot of people who exist in these marginalized populations and you conduct that experiment, afterwards they say, hell, no, I’m not buying an Audi.
Now, why is that? Why do they react to this message of empowerment so much differently than somebody else, right? Because a lot of it is, I think, they’re self-rationalizing their own tribal existence, right? Imagine a woman who’s in an abusive relationship with her husband, imagine somebody that, even the more common case, has been kind of left by somebody and kind of is existing on her own resources and her own rights. So what psychological context does she have when she looks at that commercial? She probably looks at it as, like, this is bullshit, this is complete and utter bullshit. This is a bunch of you urban fancy pants getting down and kind of placing your values on top of me. This is not what life is like. She’s not saying that logically, but this kind of secondary component of her brain is internalizing that and that’s reflected in the measurement in turn—
GALLAGHER: Right. But Audi is probably trying to target the urban, upwardly mobile—
WAGNER: Yeah, for Audi—from a consumer, like, from a consumer point of view—
GALLAGHER: —Super Bowl—
WAGNER: —it’s probably—
GALLAGHER: —is broadcasting to everybody.
WAGNER: Yeah, that was just a case of what we were looking at, right?
GALLAGHER: Yeah, right.
WAGNER: A lot of it is, like, the more common cases, the Budweiser commercial last year, which is the immigration example, which is they made it before the immigration fight was all-consuming, but it was about this German immigrant coming to St. Louis. And a lot of people like us, again, said, oh, my God, this is beautiful. But if you looked at the primary consumers of what that may have been, they may have reacted, a lot of them did react negatively to this commercial. It may have been effective in terms of increasing kind of brand among the people they were trying to reach—totally—but some people may—some people probably did react to that more negatively because how they essentially internalize their feelings about immigration.
GALLAGHER: Seth, any comments about that? I also want to ask you about something else.
STEPHENS-DAVIDOWITZ: Yeah. So it’s—I did a study that just reminds me so much of what Dan’s talking about, how think can backfire, where I was studying Islamophobia also using Google searches. So people—this isn’t even Islamophobia. It’s not a fear of Muslims, it’s more rage towards Muslims. People make some really, really nasty searches about Muslims on Google. They search things—this is disturbing—they’ll search things like—a small number of people search things like I had Muslims or kill Muslims or no Syrian refugees, really, really nasty stuff.
And even though these searches are a little strange, they actually do predict week by week how many hate crimes there are going to be. So when more people are making these searches, there are more hate crimes against Muslim Americans.
So after the—in December 2015 after the San Bernardino attack where two Muslim Americans had shot up and killed 15 of one of the guy’s coworkers, Islamophobia, anti-Muslim sentiment was at an all-time high, it was out of control. You saw this in Google searches, you saw it on Twitter, you saw it everywhere. And a few days later, Barack Obama decided he was going to give a speech to kind of calm people down and try to calm this almost mob mentality that had overtaken the United States. And he gave what I thought was a beautiful speech, kind of classic Obama. He talked about how it’s the responsibility of Americans not to give into fear, to appeal to freedom, how it’s our responsibility not to judge people of a different religion, how it’s responsibility to let other people into our country no matter their religion. And it got rave reviews, The New York Times said it was amazing, Newsweek said it was amazing, Boston Globe said it was an amazing speech.
So I was studying this Google search data, anonymous and aggregated, and they have minute-by-minute data, so you can look what happened during and after Obama’s speech to all these horrible, nasty searches by angry people about Muslims. And you saw not only did they not drop, they didn’t stay the same, they went way up and stayed up afterwards. So it seemed like everything Obama did, even though all the traditional sources were patting him on the back and saying great job and thought it was really moving, actually backfired.
But then there’s a—that’s a little pessimistic. I want to leave with an optimistic note. Whereas at the end of the speech, there was something he said, which may have been more effective, where he said that Muslim Americans are our friends and neighbors, they’re our sports heroes and they’re the men and women who will die for our country. And then you see literally seconds later a huge explosion of searches for Muslim athletes followed by Muslim—and then for the next days later, for the first—for the first time in many years, the top descriptor of Muslims on Google searches was not Muslim—was not Muslim extremists or Muslim terrorists, it was Muslim athletes, followed by Muslim soldiers, and they kept the top two spots for many weeks later.
And you see all around the internet these young men saying, Muhammad Ali was a Muslim? Shaquille O’Neal is a Muslim? Like, I didn’t know this. You know, their image of a Muslim American up until that point had been Osama bin Laden and these two people who had shot up San Bernardino. So I think you kind of saw in that study—and I’m not going to say from one little study that I’ve solved hatred in the world—(laughter)—but I do think the power of some of these data sources, if you kind of think what doesn’t work, what seemed to not work in this particular study, it was lecturing people, right? What you should do, here’s your responsibility, things they’ve been told a thousand times. What is more effective is maybe subtly provoking their curiosity, giving them new information.
And I think what this kind of says—and this is, like, classic behavior economics, in my opinion, because it’s something that—people are not necessarily rational and telling them arguments on why they should change their behavior is not necessarily the most effective strategy. I think it does show the power of some of these new internet data sources to kind of turn a lot of these questions that have been very, very difficult into real sciences.
GALLAGHER: That’s a nice note to throw it out to the members now. I’d love to welcome anyone who would like to ask a question of our panelists.
I just want to remind everybody that this meeting is on the record.
So just raise your hand. Please wait for the mic and speak directly into it and state your name and affiliation.
I think we have a question over there.
Q: I’m Ron Tiersky from Amherst College.
My question has to do with the fact that I think you are a little too critical of yourself and it doesn’t—it doesn’t quite work. You seem to be saying that you should have predicted, you should have been able to predict the outcome in 2016 election. I don’t know why people don’t say more about the fact that Hillary won 3 million more votes than Donald Trump. And someone will say, oh, our big-data predictions and all this. Why were we so wrong? As I understand it, it was a matter of a total of 70,000 or 80,000 votes in three states, which could be seen as a rounding error. So I—I’m wondering if the attempt at prediction is not—is not overdone. It could be that 70(,000) or 80,000 voters, I don’t know, argued with their spouse or something, something that was very short term rather than some long-term or medium-term factor that you could have predicted.
GALLAGHER: I guess, Dan, you may want to take that.
Without getting into a too-wonky discussion of the Electoral College, which is really also—
WAGNER: Yeah, well, I think the important concept here is you have the difference in the mean and the difference in the distribution. And the difference in the distribution is often or usually way more important. And so you have a—you have a heavy distribution in terms of the population of educated voters across the country.
You look at a state like Virginia or Maryland or Connecticut, a disproportionate number of those people went to college, they’re very high-income states, very immensely educated, and as a result they have a different set of normative values that exist in their communities. Almost every one of those states, the prediction was below what actually happened, right, almost all of them, California especially. But if you look in Michigan, Wisconsin, Pennsylvania, the prediction was way above what happened, right? So you have this weird case where there was a—there was a distribution of bias that was really weird depending on the concentration of educated or uneducated voters. Well, the mean was the same, right, which makes sense, but the distribution of bias was very different.
And because of some historical accident and a conversation that happened between Alexander Hamilton and George Washington and all these other people, like, probably drunk, we now have this—and where to put Washington, D.C., you have this Electoral College. And just by some accident of history with, like, autoworkers and whatever, you have a higher concentration of those voters in these states. And because the measurement was off in those states, the resource allocation was off, but the measurement wasn’t proper; thus, the Electoral College game, which is the only game that matters in an election, the placement was wrong. And as a result, we lost it.
But the important conclusion for measurement is it’s not how off—it’s not the difference in the mean, it’s the difference in the mean by state, so the distribution of bias over time. Again, like, that’s important—and Hal Varian talked a lot about this—in terms of, what is the distribution of this stuff over time? And how heterogenous are the tests or how heterogenous are these effects by population? And looking at that is more important than looking at just the means.
GALLAGHER: Right here in the front row.
WAGNER: Maybe that was too wonky, I don’t know.
GALLAGHER: No, that was good, that was good, very good.
Q: Hi, Susan McCaw, COM Investments.
This question is for Seth. Loved your book and I loved the way you used data to analyze what people are really thinking. But my question is that with the increasing use of artificial intelligence, what is the likelihood that some of this data gets polluted, meaning algorithms that are set up that might not allow you to analyze the data the way you have? Like, for example, in elections, let’s say there’s an algorithm written for people to write, you know, how to turn out to vote in urban areas, but that in actuality isn’t what they’re searching.
STEPHENS-DAVIDOWITZ: Yeah, I think it’s definitely a difficult—it’s a difficult situation. I kind of also agree with one of Hal’s points that, you know, initially, again, when I first saw this day, I’m, like, oh, my God, all the old economic measurements are out the window, let’s just use Google searches and tweets and we’ll measure all the economy. And I think I kind of agree with Hal’s point that it’s going to take many years of learning how to make sense of this data. And you do see changes in behavior over time that aren’t always—that aren’t always necessarily clearly driven by a change of behavior, a change of attitude that, you know, yeah, that is easily explained.
I don’t know. I think—I think what the particular—I think bots in general aren’t really included in the Google search data because Google has a, from what I understand, a many-billion-dollar incentive to realize what search it queries are bots and not include them in the dataset, though Hal could correct me if I’m wrong. So I think that particular element of it isn’t necessarily an issue.
I think there is an issue with autocomplete that it kind of brings people in a certain direction, but something that has a small lead as a search may get a bigger lead as everyone sees that autocomplete and they have ideas that they didn’t realize they had previously.
GALLAGHER: Hersh, can you weigh in on that also? Can artificial intelligence—can big data in the field of behavioral economics be hacked or be erroneously skewed?
SHEFRIN: That’s one of my biggest fears, is that we are vulnerable. And I think that, you know, these things come together. So the issues that Dan mentioned about not having the right metrics is one issue. The potential to be hacked, not just the data itself, but the underlying algorithms is second. And our tendency, which is to trust technology until something happens to convince us otherwise, all of those things come together in a natural way.
So it’s something where I think to remember what Andy Grove told us and the way he ran intel: Only the paranoid survive. (Laughter.) And I think that is great advice.
GALLAGHER: Who has a question?
All the way in the back there.
Q: Andres Small from Partners Group.
I guess this is a question for Dan. To dig a little bit further on your point about, your examples about social pressure being more effective than perhaps logic. But when I look at the voter participation absentia in the U.S., it hovers around 50 percent. It’s not—you could easily flip a coin and say, well, just as many people are not voting rather than voting, right? So how do you isolate that? And what makes you—what gave you the confidence that it’s a statistically significant factor or R-squared is high, all that?
WAGNER: So it’s 50 percent midterm elections and 65 percent presidential elections, just to—whatever. So how does that happen? So voting, like many civic duties, is more of a habitual thing and a religious thing than it is a logical thing. If you look at just the marginal impact of your vote, you know, it’s approaching epsilon, especially in the case of 185 million registered voters, 130 million registered—between 130 (million) and 140 million people will participate in a presidential election. Let’s say your state is off by a million votes. The marginal consequence of your vote makes no logical sense in kind of, like, fundamental mathematics.
So why do you participate? In terms of your civic duty, you do it as a religion and that religion becomes embedded in your habit over time. That religion is reinforced by the normative values in your community, right?
The participation rates, for example, in the 1950s were very high after the Second World War when civic participation in terms of a normative value was extremely high. That diminished in the 1970s and the 1980s and then it kind of skyrocketed in the 2008 election of Barack Obama when that kind of religion was accelerated. And so you have that habit in terms of, you know, how that really works.
One interesting piece is that, if you look over time, what are the groups of people that participate at the higher rates, highest rates? Number one is the Roosevelt generation of people who came about the New Deal and remained very loyal to those principles. So there’s kind of an age gap there or an age set there.
Another age set within—if you look at millennials, you’re, like, oh, these people are kind of wankers, they don’t participate. (Laughter.) But there’s one group of people that does participate and that is the group of men and women who are about our age, who basically turned 18—
GALLAGHER: About our age? (Laughter.) I don’t know if you want to say me.
WAGNER: Thirty-four to 36.
GALLAGHER: OK. (Laughter.) Thank you.
WAGNER: I may look like I’m 12, but I am old.
So if you look at that group, they came of voting age as the Iraq War was at its height, right? They came about, and that habit has essentially extended up to our age now. And if you look at this kind of discontinuity between the people before and after, their voting rates have actually—are much lower than that specific group among that age range just because those people have internalized those values into what they do while people before and after vote at lower rates.
And so while, mathematically, voting is kind of absurd, the reason why there is variability in this is the point at which you start voting and how that essentially gets ingrained in habit, and that varies much by when, that varies much about the context of the election and how that gets ingrained, that varies a lot by the community in which you participate.
A lot of these things are generational. I think a person in the previous said a lot of these habits become generational and that’s certainly the case to civic participation. And, quite frankly, there’s a lot of fear that a lot of these communities who are becoming generationally affected are lowering their participation in elections as opposed to rising, and so you have kind of this increasing proportion of people who are participating as a result of generational habits and a lot of people who aren’t, and that’s very disturbing.
GALLAGHER: I’d love to get to one more question, but I also want to see if Hersh or Seth wants to chime in about voting patterns, voting behavior.
No? OK.
SHEFRIN: Well, I just—I’ll just—I’ll just make a quick comment. Value expressiveness really is a critical issue along with social preferences. So I think that it’s, from a pure calculus perspective, it’s not in your self-interest to vote. But people do vote.
I think this point that Dan made about habits, that’s been part of what brought me into behavioral economics, was to understand the role that habits play, what it is that leads people to begin particular habits, because they need to have some reward. But the fact is that once you get going into a habit, it’s like you’re in a rut and you’ll tend to do it automatically, it doesn’t become difficult. So this is, I think, a really fundamental insight and I just want to reinforce it.
GALLAGHER: OK, great.
Who else has a question?
Right here.
Q: I’m Gerald Pollack.
Some countries, for example Argentina, have requirements that every citizen vote or there’s penalty for not voting. How would you judge the outcomes of such systems compared with our own?
WAGNER: I guess I’m up again. Sorry. So you have unintended consequences in some cases of that system. In some elections where you have that, Peru, et cetera, you have a lot of people who vote for third-party candidates, they write in Mickey Mouse, et cetera because you don’t have an even distribution of knowledge. And so a lot of people, it frankly kind of disengages them as opposed to engages them.
The fair compromise that I think would be the best—and if you look at Oregon in the United States has really kind of set the terms of this. You have automatic voter registration, which says that voting isn’t compulsory, but registration is compulsory. So there’s no kind of intermediate process to make sure that you validate your permission as a citizen to vote; but rather, everybody gets allowance and everybody gets a ballot. And as a result of what you’ve seen, you’ve seen skyrocketing voter participation relative to all other states and you’ve seen more interest in voting by those people in those certain states.
And so I’d say, in terms of a policy, you know, obviously, there’s kind of country biases and all that stuff. But if you look at just kind of, like, the experiments that people have done or matched cases, it seems like the case of Oregon is a better example of what policymakers should be thinking about, which you’re all registered, you all get a ballot, you have a choice in whether you want to participate, versus compulsory voting which traditionally, especially in Latin America, has had some weird unintended consequences, especially in elections where the participation is lower.
GALLAGHER: Anyone, another question?
Yes, in the back.
Q: Hi, Lauren Tannenbaum, Joe Smith Brand Strategy.
Dan, I think your point about if this—it’s actually not about politics.
WAGNER: OK. (Laughter.) OK.
Q: It comes off of your point of, if measurement failed so badly for us in politics, what’s it doing to corporations and brands? I work in brand strategy.
WAGNER: Yeah.
Q: I’m curious, from any of you, kind of, what do you see as a solution to that? If survey mechanisms are inherently biased and challenging and measurement is a problem, where do we go?
WAGNER: I’m going to make one small comment and I’ll turn it over to Seth because I think he’s smarter than me.
So the role of data science in these two—you have two sides: one is prediction and two is—one is prediction, two is attribution, right? Now, ideally, those two things will converge upon the outcome. Prediction was really wrong in this election. But ideally, you can make statistical adjustments based on kind of validation such that you can improve the correlation between outcome and prediction. And attribution is really the exciting thing that’s happening today, is you can build better attribution mechanisms between the outcome and some of the incredible bodies of information that are happening.
Unfortunately, with prediction, you only do the ex-post validation. With behavioral kind of data sets, you have incredible opportunities. So I would say, if you’re running a brand, those are the two things that you want to consider: How do I get my prediction as close as possible to the outcome, validating that over time in the same way to politics? And how do I build, especially in brands that are intermediated by retailers and stuff like that, how do I build a database of proper attribution that can assess my interventions upon that with some type of causal interpretation?
GALLAGHER: OK, we’ll have Seth.
And then, Hersh, we’ll go to you on this, too.
STEPHENS-DAVIDOWITZ: Yes, I think the big future of brands, of business and big data is rapid experimentation, following what people do, not what they say they’re going to do. So that was kind of the big shock when I first worked under Hal at Google when I went from an academic background where just about all the research that my classmates were doing and the professors were doing was small experiments asking people what they would do under certain situations. And when you go to Google—and when you go to Google, they just do rapid experiments all the time following what people actually do, what do they actually click on. It’s called A/B tests. And it’s really, really cheap and easy to do.
GALLAGHER: Are people familiar with the concept of A/B testing?
STEPHENS-DAVIDOWITZ: So basically, like, Facebook can do—Facebook can show two versions of the website. So to 500 users, a control group, they’ll show the same website and to 500 other users, the treatment group, they’ll maybe make one of the buttons red or they’ll change the font. And then they can measure how these two groups behave. Namely, how often do they use Facebook? What do they click on? Are they doing more of the things that we want as a company?
GALLAGHER: In journalism, I’ll just say, it’s done a lot now in the era of internet journalism. And it’s why we end up with some headlines like “10 things that go better with ketchup.” It’s, like, what’s clickable, you know, where are people clicking?
STEPHENS-DAVIDOWITZ: Yes.
GALLAGHER: So it’s really revolutionized, also in more substantial ways, but go ahead.
STEPHENS-DAVIDOWITZ: And the key is just how cheap and easy it is. It’s one line of code. And you can even just set it up so you can measure, you know, do 10 different versions of a headline in a journalism article. You can say, you know, 10 different—10 slightly different headlines and see which ones get more people to click on the article.
So I think that combined with following what people actually do, what they click on, what they buy, is really what’s going to be kind of the big use of big data in the corporate world. And it already is for the biggest corporations, but it hasn’t necessarily filtered to every other corporation yet.
GALLAGHER: Hersh, any thoughts on that, surveying?
SHEFRIN: I think there are always going to be type-one and type-two errors, so we just kind of have to get used to it. There may be opportunities for improvement.
One of the things that—I just wanted to link back to, you know, to Danny Kahneman who was the first economics Nobel for behavioral finance as a psychologist, not even an economist. But, you know, in his—in his book Thinking Fast and Slow—I’m not there, but if I was there I’d ask people to raise their hands if they know this book.
GALLAGHER: Let’s do it.
SHEFRIN: Oh, do it.
GALLAGHER: Who knows the book or read the book? Yeah, it’s a huge book. Yeah.
SHEFRIN: OK. So he tells us that inside our heads are two systems: It’s the fast-thinking system that is our intuition and the slow-thinking system that’s deliberate and conscious. And the thing is that our slow-thinking system, it really doesn’t have a whole lot in terms of resources relative to our fast-thinking system, which means that most of the time we really don’t understand what it is that we’re doing. (Laughter.)
So I think that what the internet is going to do for us and these new big-data, artificial intelligence routines will do for us is they’re going to help our slow-thinking, deliberate system understand that other part of us a whole lot better. You know, in effect, the internet is going to become our new shrink.
GALLAGHER: That’s a good way of putting it. (Laughter.)
Yes, right here in the front.
Q: Hi. I’d like to—Juan Ocampo.
I’d like to ask a question about herding, not necessarily in elections, but in general. What interesting things, that are less obvious with all the big data and the kind of—the underlying academic theories that you’ve been able to use so much, would you point out as being, you know, interesting and unusual about herding. For example, are there formulas that you can use to try and get a group of consumers to herd and like Beanie Babies, for example? Can you—how quickly can you detect whether in fact you’ve got a wave going, you know, this is herding versus that’s not? And finally, are there ways to extinguish a herd that’s going on and it’s kind of in the upswell? Can you cut it off?
GALLAGHER: Great question. Herd behavior is a huge part of this whole field. How do you create it, identify it, stop it? Who wants to take that?
Hersh, why don’t we start with you?
SHEFRIN: Sometimes you want herding. Sometimes you sort of need herding. It helps people to coalesce around a common set of ideas so that they don’t engage in excessive competition. So I don’t want to knock herding as a general concept. It helps build communities. It helps people find ways to come together. But like any good thing, too much of a good thing is not such a good thing. So I think that we can get excessive herding. And that’s where you sort of want to start to pay attention to interventions that take place.
I think that we’re really just at the beginning of trying to understand what it takes to slow down unnecessary momentum. It’s the sort of, you know, momentum that happens when people get over-focused and crowd behavior takes over and people sort of stop thinking, but let their emotions take over.
So the kinds of interventions that are going to be important are going to require ways of defusing the emotion of the moment to try and bring up that slow-thinking part of us rather than letting our fast-acting systems get carried away.
GALLAGHER: Seth, what about you?
STEPHENS-DAVIDOWITZ: Yeah, so one of the—one of my favorite studies was by a former colleague of mine Qing Wu and he studied, using big data, fashion herding. And basically, he wanted to see—he was using Google searches—of all the big fashion trends, where did they start and kind of is there a model to predict how these trends get going that eventually everybody is wearing. I know nothing about fashion, but—I don’t know, whatever fashion things are. He’s a big fashion guy, so he kind of could study these. He knew more about the subject.
And what I think I would have expected would be that there are these clear patterns, that fashion trends start in Brooklyn among a certain select group of people and then maybe, you know, as you kind of said, there’s some sort of clear distribution that says, oh, now everyone is going to herd onto it.
And what Qing actually found is that it’s almost entirely unpredictable, that sometimes they start in Brooklyn and sometimes they start in Salt Lake City and sometimes they start in Denver and sometimes they start in Kansas. They’re just all over the place. And sometimes they start and then they stop, and sometimes they start and keep going. So it was kind of—it was kind of pretty shocking to me that there are—sometimes you—the data tells you that things are just totally chaotic and there’s no science to it, which is interesting, although there’s less obvious things to do with it.
GALLAGHER: Yeah.
WAGNER: If we had time, I’d ask everybody who bought an $800 Canada Goose jacket, but I’ll—(laughter)—
GALLAGHER: We can ask.
WAGNER: —leave that.
GALLAGHER: Who has a Canada Goose jacket? I actually don’t. OK, only one.
WAGNER: This might not be the right population. (Laughter.)
GALLAGHER: OK.
WAGNER: So, you know, we’ve done a little bit of work in this, basically looking at mostly on kind of what hate gets distributed, unfortunately. But in terms of, like, what—if you take a social node in that you look at what kind of distributes itself from that node out to the population, especially from, in this election, from the most important example being a Russian, you know, how did they interfere in the Russian election? They kind of insert something into the network and that distributes itself in the network.
So what types of things? And I think this is going to be something that these folks are working on that is super interesting, especially about the interference of foreign powers in our election, but also for brands, et cetera, is there’s a lot of underlying psychological drivers that make somebody share stuff. Right? And I think that’s something that’s really understudied right now.
Three things that we know of: feeling cool, feeling funny and feeling accepted. Right? We know those things are drivers. We don’t know the kind of relative magnitude of those different things, but I think Twitter in terms of identifying a network of where these things originate and from where they kind of are shared out to people is the best laboratory that we have in terms of sharing is the behavior and the root cause of that is the content itself and saying, what is the underlying psychology of that comment? Is it funny? It is acceptance? Is it looking cool, right? So how do you kind of rank order yourself in a social organization relative to your network?
And then I think what we need to think about is, what are some more of those drivers and how do they in terms of rank order and sharing, which is kind of the primary way that you kind of voice yourself within a community, whether it’s a Canada Goose jacket or bitcoin or whatever? Bitcoin is different. There’s some technical terms.
GALLAGHER: Bitcoin.
WAGNER: But Canada Goose, yes.
GALLAGHER: I think we have room for one more question—for one more question.
Right here in the middle-to-back, right there.
If you could just wait for the microphone. Yeah. There we go.
Q: Hi, thanks. My name is Georgia Keohane at Pershing Square Foundation.
I wanted to get back to another bad data and sort of decision-making behavioral economics question. So I guess to the extent that we hope that new and better data will allow us to make better decision-making and sort of remove irrationality, my question is, in cases where we’re not—we don’t necessarily have good data or any data—so you’re a bad credit risk, you have a bad credit score, not because you’re actually a bad credit risk, but because you don’t have a credit history, and/or your bail is set here, you know, based on your previous arrest records which tell you much more about sort of what you look like necessarily than you’re a flight risk. And how do we think about some of the new data sources that you described to actually supply us the right data or good data or small data to allow us to make better decisions that are actually rather than worse decisions?
GALLAGHER: Different new sources of data.
STEPHENS-DAVIDOWITZ: Yes. I think—I think what’s going to happen is that there are going to be fewer cases where you don’t have information about people. So there’s going to be something about everybody that’s predictive of how good a credit risk they are, how good an employer they are.
I think there are dangers to this, too. There was a recent study where they said they could predict people’s psychology and IQ based on what they like on Facebook. And there are really, really subtle patterns. So some of them are not surprising, like, you’re more likely to be neurotic if you like Nirvana or something, like, OK, that makes sense. (Laughter.) And I think you’re more likely to be intelligent if you like Mozart, which I guess, OK, I get it. But then they had one where you’re more likely to be intelligent if you like curly fries and, like, significant, one of the biggest correlations with intelligence is liking curly fries on Facebook. (Laughter.) And then it’s just, like, well, OK, like, it may.
And that’s just—the way the world works, people who like curly fries and people who don’t like curly fries are not identical. They’re not identical populations. There are things that are different about them. And we don’t know exactly the reason, but for whatever reason, intelligence correlates, it doesn’t necessarily cause, but it correlates with—(laughter)—with intelligence.
So I guess the idea would be that—it gets to big ethical questions, I think which also your question touched on. Which is, sometimes we don’t—there are—I’m sure there are many intelligent people who don’t like curly fries and we don’t want to necessarily penalize them, you know, if some company is putting on advertisements and they say, oh, wow, let’s target curly fries people, they would get a slightly higher intelligence in their employee group, but it would probably unfairly punish people.
So I think it helps in that there’s so much more information about people, but it also raises big ethical questions of what information we should use and what information we shouldn’t use.
GALLAGHER: OK. We’re just about out of time, so, Hersh and Dan, I’ll have you quickly just chime in on any new data sources that you see.
SHEFRIN: I just want to say that with new neural network algorithms, it will be possible to tease out patterns that I think will be informative and may make things better. But just don’t expect perfection. There will always be type-one and type-two errors. And if you knew more, you would have been able to make a better decision. You know, the bail decision that your questioner asked about, for example. It’s just the way that, you know, that life is. We’re just going to have to live with some limitation, but I think that big data has its advantages and we will see advances on that.
GALLAGHER: Thanks.
And, Dan, final word to you.
WAGNER: Very much the kind of network thing I think is interesting. I think if you’re a business, the most important—I think the most important data is kind of boring, is going to be consumer data that provides a means of reinforcement. So a lot of AI, machine learning, the most—a lot of the most important work for a business is essentially reinforcement learning, which says I predict something, I enable some action, which is some placement of resources, I do it, I measure what worked, and I adjust my processes based on what I learned. Right?
And I think Google does this, Facebook does it, Amazon does it. The businesses that are going to improve are those who are going to essentially, number one, implement that process, number two that can learn from that process, and, number three, are the ones that can embed small experiments in that process to improve in this kind of sequential tournament of resource placement over time.
And a lot of businesses for the very first time, especially those that are direct to consumer, are creating the underlying data that has the potential for reinforcement learning, right? A lot of people don’t have the staff to do this or a lot of the primary components. But if you’re a business, I would think this would be the primary data source and maybe it is just kind of captured in your servers right now. But if you’re a business, I think this is the way that you become competitive, or you’re going to be in a rough spot.
GALLAGHER: Great, excellent.
Well, from curly fries to epsilon, please join me in thanking our wonderful panelists.
And thanks to all of you for being here. (Applause.)
(END)