
President Trump loves talking about the trade balance.
So do I, though, I hope, in a somewhat different way. In fact, I spent the mid-2000s arguing that the U.S. trade deficit was too large, and that it reflected dangerous imbalances in the global and U.S. economies. Today’s U.S. trade deficit is smaller—3 percent rather than somewhere between 5 and 6 percent of GDP. But I still think it is a variable worth watching.
There are those who don’t. They note, correctly, that a widening of the trade deficit (as happened in October, in a reasonably big way) can reflect a strengthening economy, as higher imports are often a sign of stronger demand growth—and thus the trade deficit isn’t always a sign of economic weakness.
And I sympathize with those who find it difficult to report on the monthly trade deficit in a smart way, as the monthly release is quite noisy (aircraft exports jump around from month to month as do net oil imports, the seasonal adjustments needed to smooth the soybean harvest and holiday imports are large and can generate noise, etc) and, well, the data itself really should be looked at as part of an evolving time series, not as a monthly snap shot (Calculated Risk does the world an invaluable service by putting the monthly release into context).
Yet I think the trade balance matters for three reasons:
- Changes in net exports can have an impact on GDP—in q2 and q3, for example, net exports are the difference between 2 to 2.5 percent growth and 3 percent growth. A big rise in the trade deficit in q4 is the most plausible risk to the current q4 growth forecast. And I will certainly be watching to see how the actual trade data evolves in response to Trump’s mix of deficit-financed tax cuts and a trade policy that in principle aims to bring the trade deficit down.*
- The trade balance has an impact on the composition of employment—across sectors, but given the United States’ economic geography, also across regions. The U.S. isn’t a homogeneous service driven economy. Some parts of the country rely more on goods production than others. And the impact of a negative shock on any given region can be persistent: factories are closed and the relevant sector-specific skills atrophy (link).
- A 3 percent of GDP trade deficit isn’t necessary quite as sustainable as some now think. U.S. net external debt is now close to 50 percent of GDP, and either a small widening of the trade deficit or an increase in interest rates (relative to the growth rate) would put the U.S. back on a trajectory where external debt to GDP is heading up.**
GDP impact
A widening of the trade deficit can reflect an acceleration in domestic demand growth, and since most domestic demand is met by domestic supply, is thus can be a sign of accelerating growth.
But that doesn’t mean the trade deficit doesn’t matter.
An acceleration of demand that isn’t matched by a widening of the trade deficit results, mechanically, in a faster expansion.
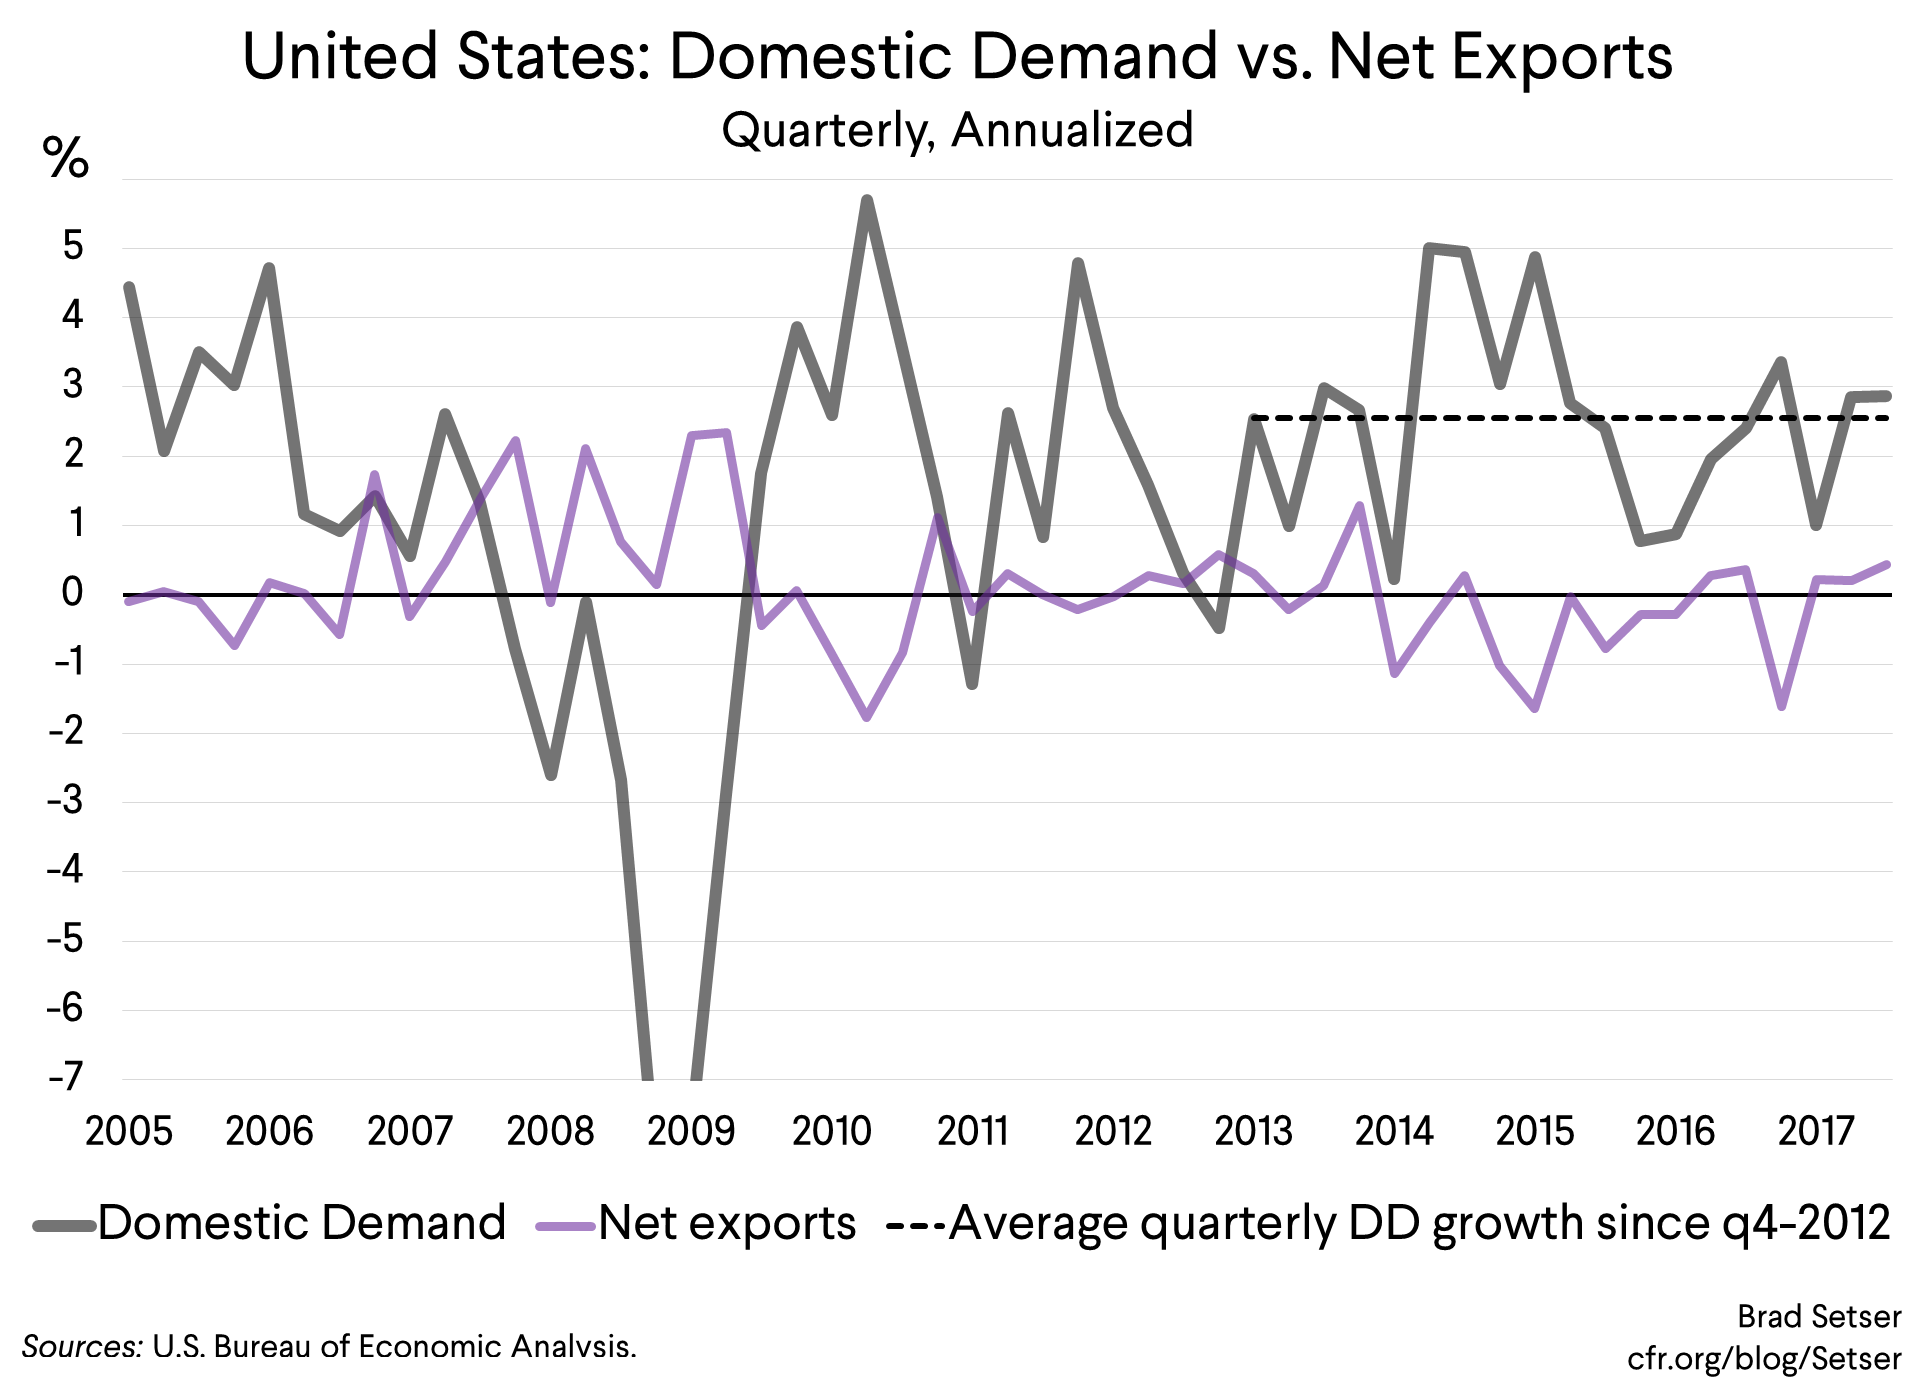
That’s what happened in the U.S. in q2 and q3 of this year for example. Domestic demand growth contributed just under 3 percent to U.S. growth without any drag from trade. The increase in the October deficit—if sustained (a portion of the rise in the deficit looks to reflect a dip in aircraft exports that likely will be reversed, but a portion looks real)—could pull down q4 growth a bit. China’s strong November export number at least makes me wonder whether the October spike in the deficit will fade.
And a large drag from a widening trade deficit can materially slow an economy’s momentum.
From the end of q4 2013 to the end of q4 2016, net exports subtracted about 1.5 percentage points from U.S. growth (that’s the period of the strong dollar), or about half a percentage point a year. At least in 2014 and 2015 the U.S. economy still had some slack, so a smaller drag from trade likely would have meant a faster pace of growth.
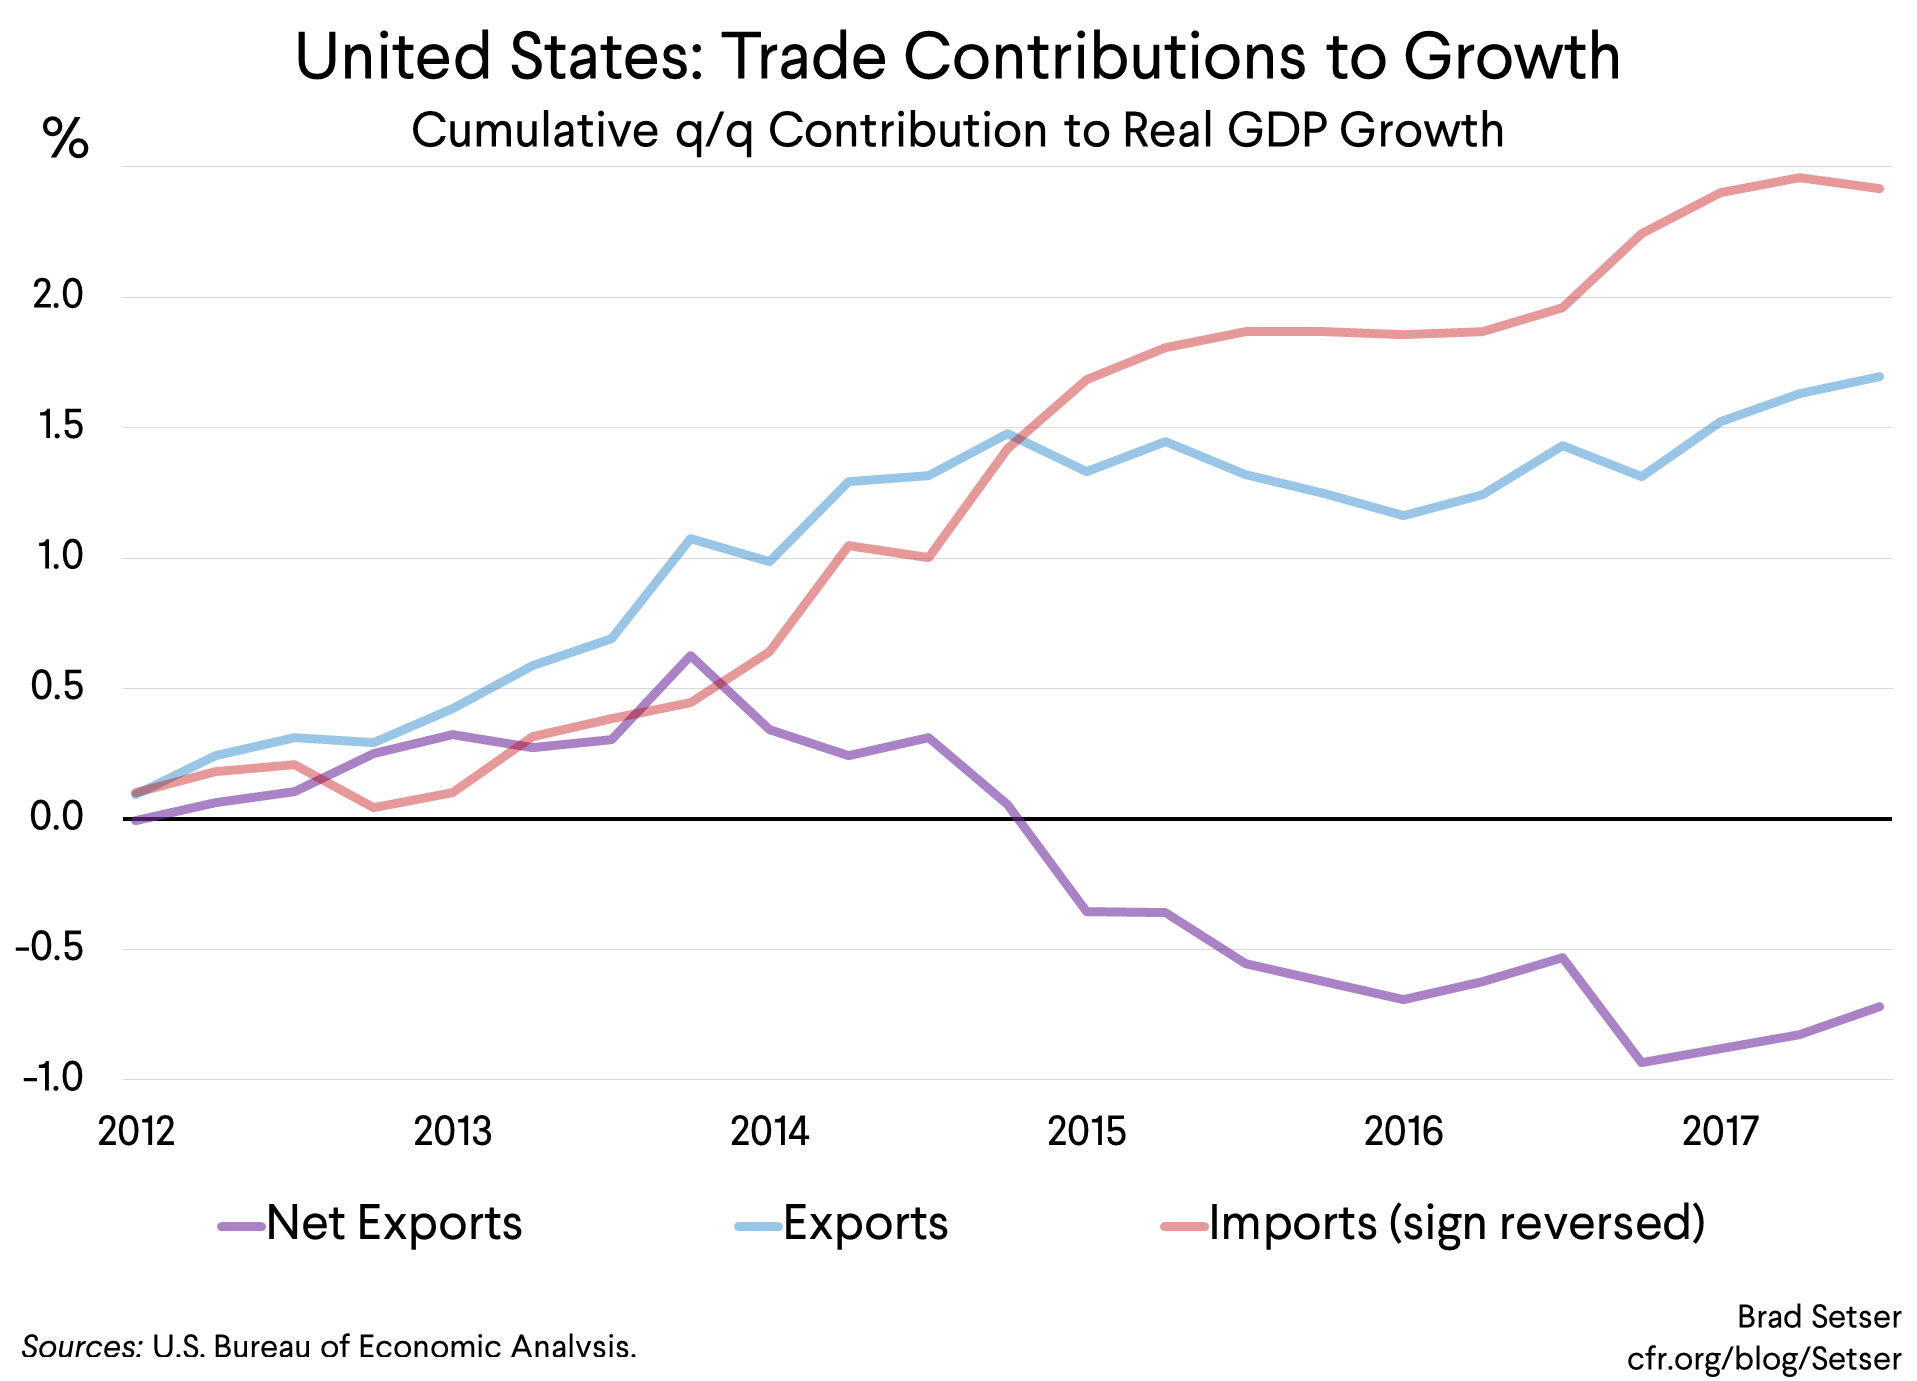
Absent a drag from net exports (which largely took the form of a fall in exports) over those three years, the 2.7 percent average annual contribution of demand over those years would have been consistent with growth of closer to 3 percent of GDP rather than growth closer to 2 percent of GDP.
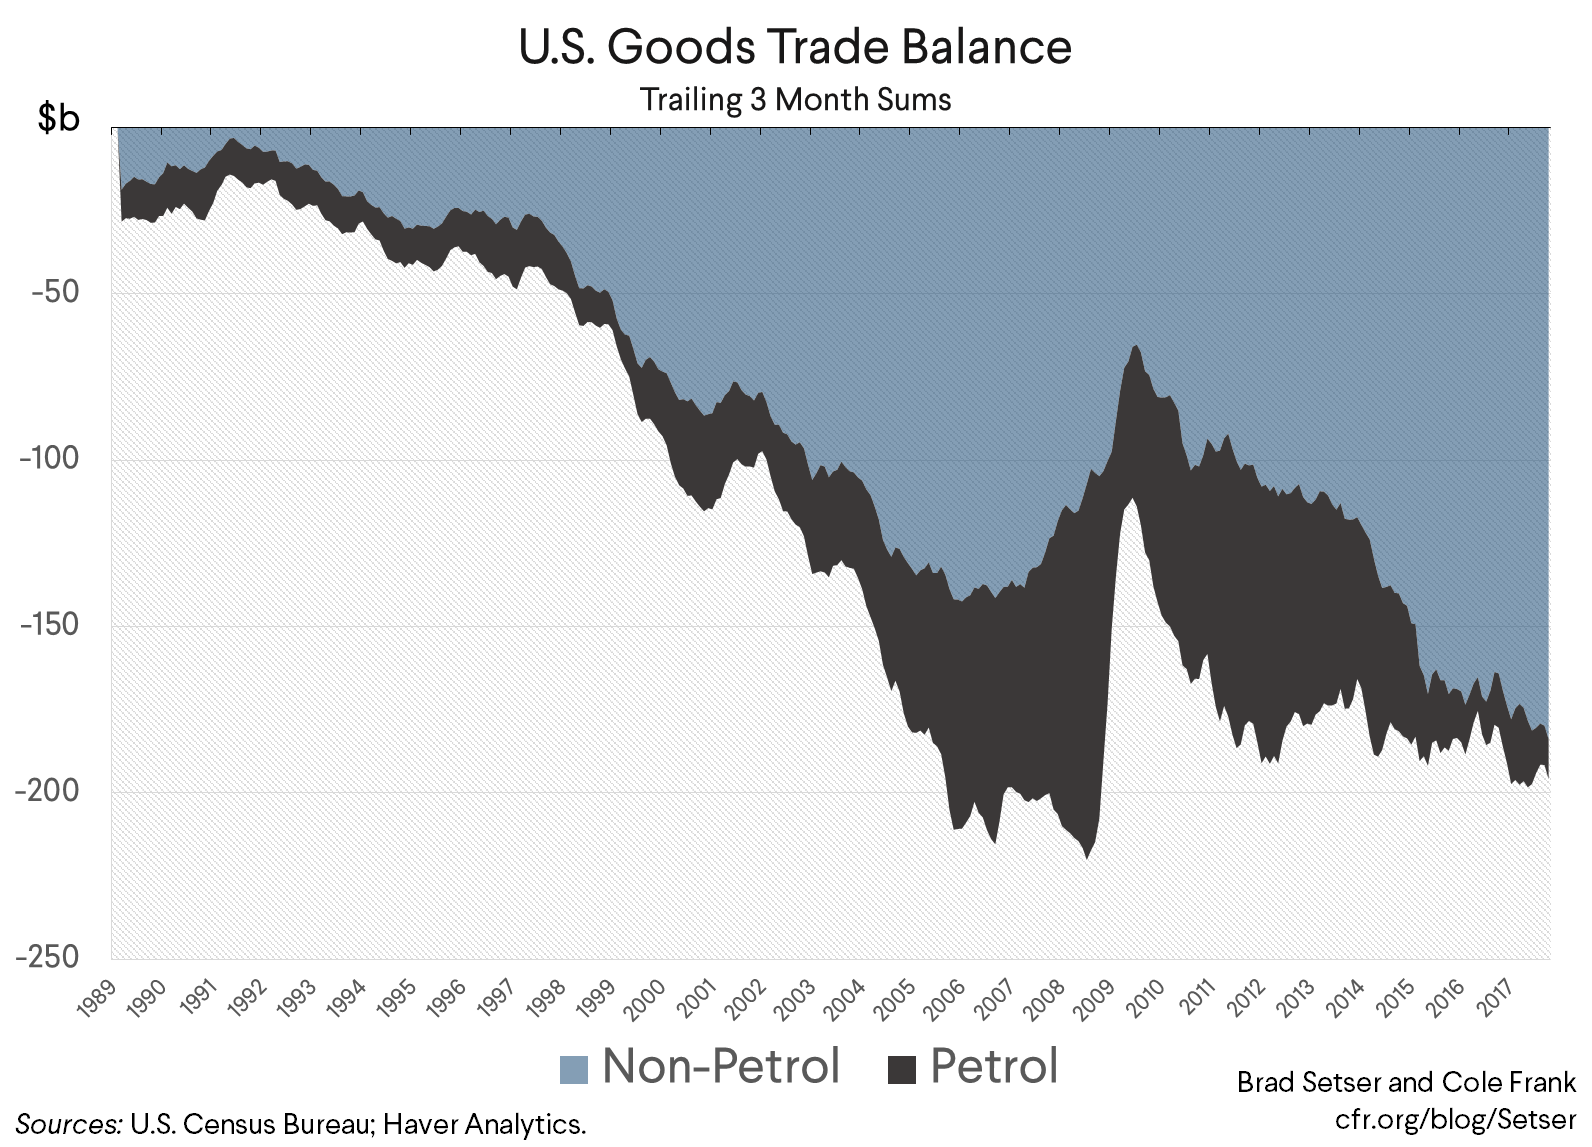
I actually think the change in the “real” trade balance (especially the non-petrol balance) during this period didn’t get enough attention—in part because the “headline” trade deficit was more or less flat because of the fall in the price of oil.
In fact, domestic demand growth in q2 and q3 wasn’t that different from its 2014-2016 average. What pushed growth up to close to 3 percent was the absence of any drag from net exports
More generally, though, a widening of the trade deficit isn’t always “good” economic news. Sometimes a widening of the deficit can reflect excessive domestic demand growth (overheating)—as may happen in the U.S. next year if the tax cut supercharges demand. The strong demand growth itself may be unsustainable.
And a falling trade deficit doesn’t always reflect a fall in the pace of domestic demand growth.
It can reflect strong export growth.***
And a fall in imports can reflect rising domestic production not a fall in domestic demand—think of how the rise in U.S. tight oil production impacted the balance of payments.
The U.S. historically has been a demand-driven economy not an export-driven economy. And the bulk of the adjustment that led the trade deficit to fall from its peak came during the crisis—net exports helped keep the U.S. out of recession in 2007, and helped buffer the impact of the collapse in demand after Lehman. But net exports didn’t do much to drive the post-crisis recovery (to my disappointment).
The U.S. export sector (sadly) is also quite small, so mechanically it is hard to get a big boost to growth from exports. But there are certainly many economies around the world that have grown through a rise in exports and an expanding trade surplus, not an expansion of domestic demand. Germany and Korea at times, for example.
The composition of employment matters, and it in some sectors, it is heavily influenced by trade.
Today the U.S. is at or close to full employment even with an ongoing trade deficit. The trade deficit thus impacts the distribution of employment, not the absolute level of employment.
As many have noted, high productivity growth in manufacturing has reduced manufacturing’s share of employment around the world. Manufacturing’s share of employment has been falling in most advanced economies (Korea is an interesting exception, it saw an absolute increase in manufacturing employment as exports drove its recovery from 2009 to 2012).
But there is substantial variation in manufacturing’s share of employment across the advanced economies. Germany and Japan have a lot of industrial robots. They also have a much higher share of their workforce employed in manufacturing than the U.S. or the U.K (Manufacturing is twenty percent of employment in Germany, compared to around ten percent in the U.S.)
Why?
Largely because both run substantial trade surpluses in manufactures (Japan to pay for its commodity bill, Germany to pay for its commodity and vacation bill and then some) while the U.S. and the UK run large trade deficits in manufactures. Variation in the trade balance—not technology—clearly explains much of the current variation in manufacturing’s share of employment. A swing from a 5 percent of GDP deficit in manufacturing (the U.S.) to a 4 percent of GDP surplus in manufacturing (the eurozone right now) is implausible, but it would have an impact on the number of manufacturing jobs.
So I do think that it is important to recognize that the adjustment that has brought the U.S. current account deficit down from its 2004-2005 peak has not come through a swing in the manufacturing balance. It has come rather through a rise in the offshore income of U.S. firms (this is where the tech sector shows up in the BoP most strongly, thanks to the impact of tax-shifting strategies)—which enters into the income balance, and thus the current account—and above all through a swing in the petroleum balance.
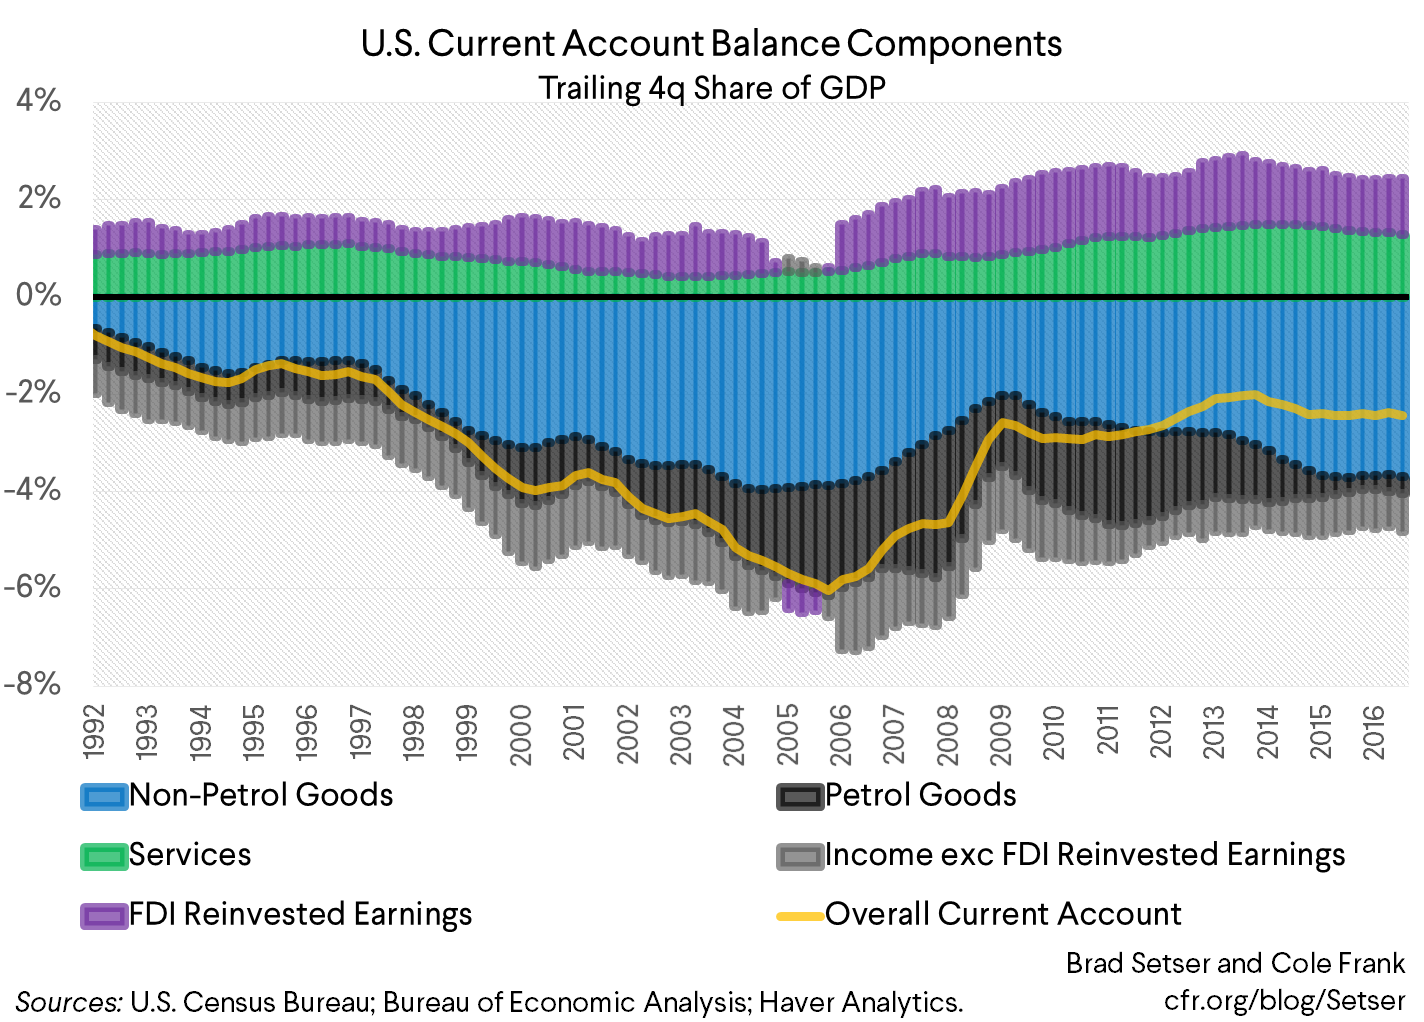
This in turn has had an impact on the United States economic geography. There is a reason why the fall in the trade deficit hasn’t led to a renaissance in the manufacturing-heavy areas of the country—and why regions like the Bay area that specialize in creating IP (alas, mostly for export to low tax jurisdictions) have boomed.****
Finally, external debt dynamics.
Back in 2004, Nouriel Roubini and I argued that a 5 to 6 percent of GDP trade deficit implied an ever rising external debt stock, and that an international economic system built about around undervalued exchange rates in Asia and heavy household borrowing in the U.S. (to keep demand growth up in the face of the drain on demand from the trade deficit) wasn’t sustainable.
I think we were broadly right—a 5-6 percent of GDP trade deficit does lead to steady increases in the U.S. external debt stock (the net debt position has risen in line with the sum of current account deficits, even if the net equity position has swung wildly thanks to changes in currencies and equity prices). And the internal financial imbalances—the big run-up in housing debt—needed to sustain household spending and thus demand growth in the face of the ongoing drag from a large trade deficit ultimately gave rise to the crisis.*****
We did though get one thing very wrong: we worried that rising external debt would ultimately raise the United States’ external cost of borrowing. That didn’t happen. Net external debt-to-GDP has gone from 20 to 50 percent over the last ten plus years. But the average rate the U.S. pays on its external debt has gone from around 4 percent to around 2 percent—so the interest burden of the U.S. debt stock has stayed roughly constant (see my paper with David Kamin for details).
That’s a bit too good to last. The Fed is tightening, and if Trump’s tax cuts lead to strong demand growth next year, the Fed may tighten more. Even with a flat yield curve, the interest costs of the United States external debt will start to rise.
That makes the stability of an ongoing 3 percent of GDP current account balance a bit precarious. ******
Right now, a sizeable trade deficit is consistent with a close-to-stable external debt-to-GDP ratio because the offshore income U.S. firms generate offsets the interest burden, and nominal growth exceeds the nominal interest rate the U.S. pays on its external debt—creating favorable intrinsic debt dynamics.
A change in either—a wider trade deficit on the back of tax-cuts, or a fall in the gap between real growth and real rates as the Fed tightens—and U.S. external debt would start rising again against its GDP.
And personally I think external debt tends to be more of a source of risk than domestic fiscal debt (think about Japan, or look at this Banque de France paper)—even if the U.S. can support a high level of external debt more easily than most because of the dollar’s global role, and isn’t as prone to being buffeted by sudden swings in global capital flows. I don’t think it would be healthy in the long-run for an economy with a 50 percent net external debt-to-GDP-ratio to run trade deficits of 4-5 percent—which is why I will be watching to see if the pending tax cuts raise the trade deficit.******
One last thing. A trade deficit can happen with a low absolute level of trade (exports and imports of 10 percent of GPD), or a high absolute level of trade (exports and imports of say 30-40 percent of GDP). Measures that raise trade integration should raise the absolute level of trade more than they change the trade balance. And the same applies to measures that reduce the level of trade integration. The Trump Administration may discover this should the overall trade deficit rise even if the U.S. ends up withdrawing from NAFTA or takes aggressive action against China at some point in the next year or two.
* The tax cuts that emerged from the conference committee are more front-loaded than before, and thus could have a bigger near-term impact (the JCT score implies a 1.3 to 1.4% of GDP widening of the fiscal deficit in fiscal 2019). Based on standard models and coefficients, I think it is reasonable to expect a widening of the trade deficit of between 0.3 and 0.5 percentage points of GDP over the next several years. The IMF’s standard model would imply a bigger impact, but I would shade that estimate down the nature of the tax cuts.
** Martin Sandbu has argued that current account deficits can be financed with equity. True enough. But in the U.S. over the last twenty years they haven’t been—so I view this as more a theoretical possibility than the likely baseline. And I do think that the relying on equity is a bit more complicated if the source of the equity is an economy like that of China, where a lot of offshore equity investment comes from state firms.
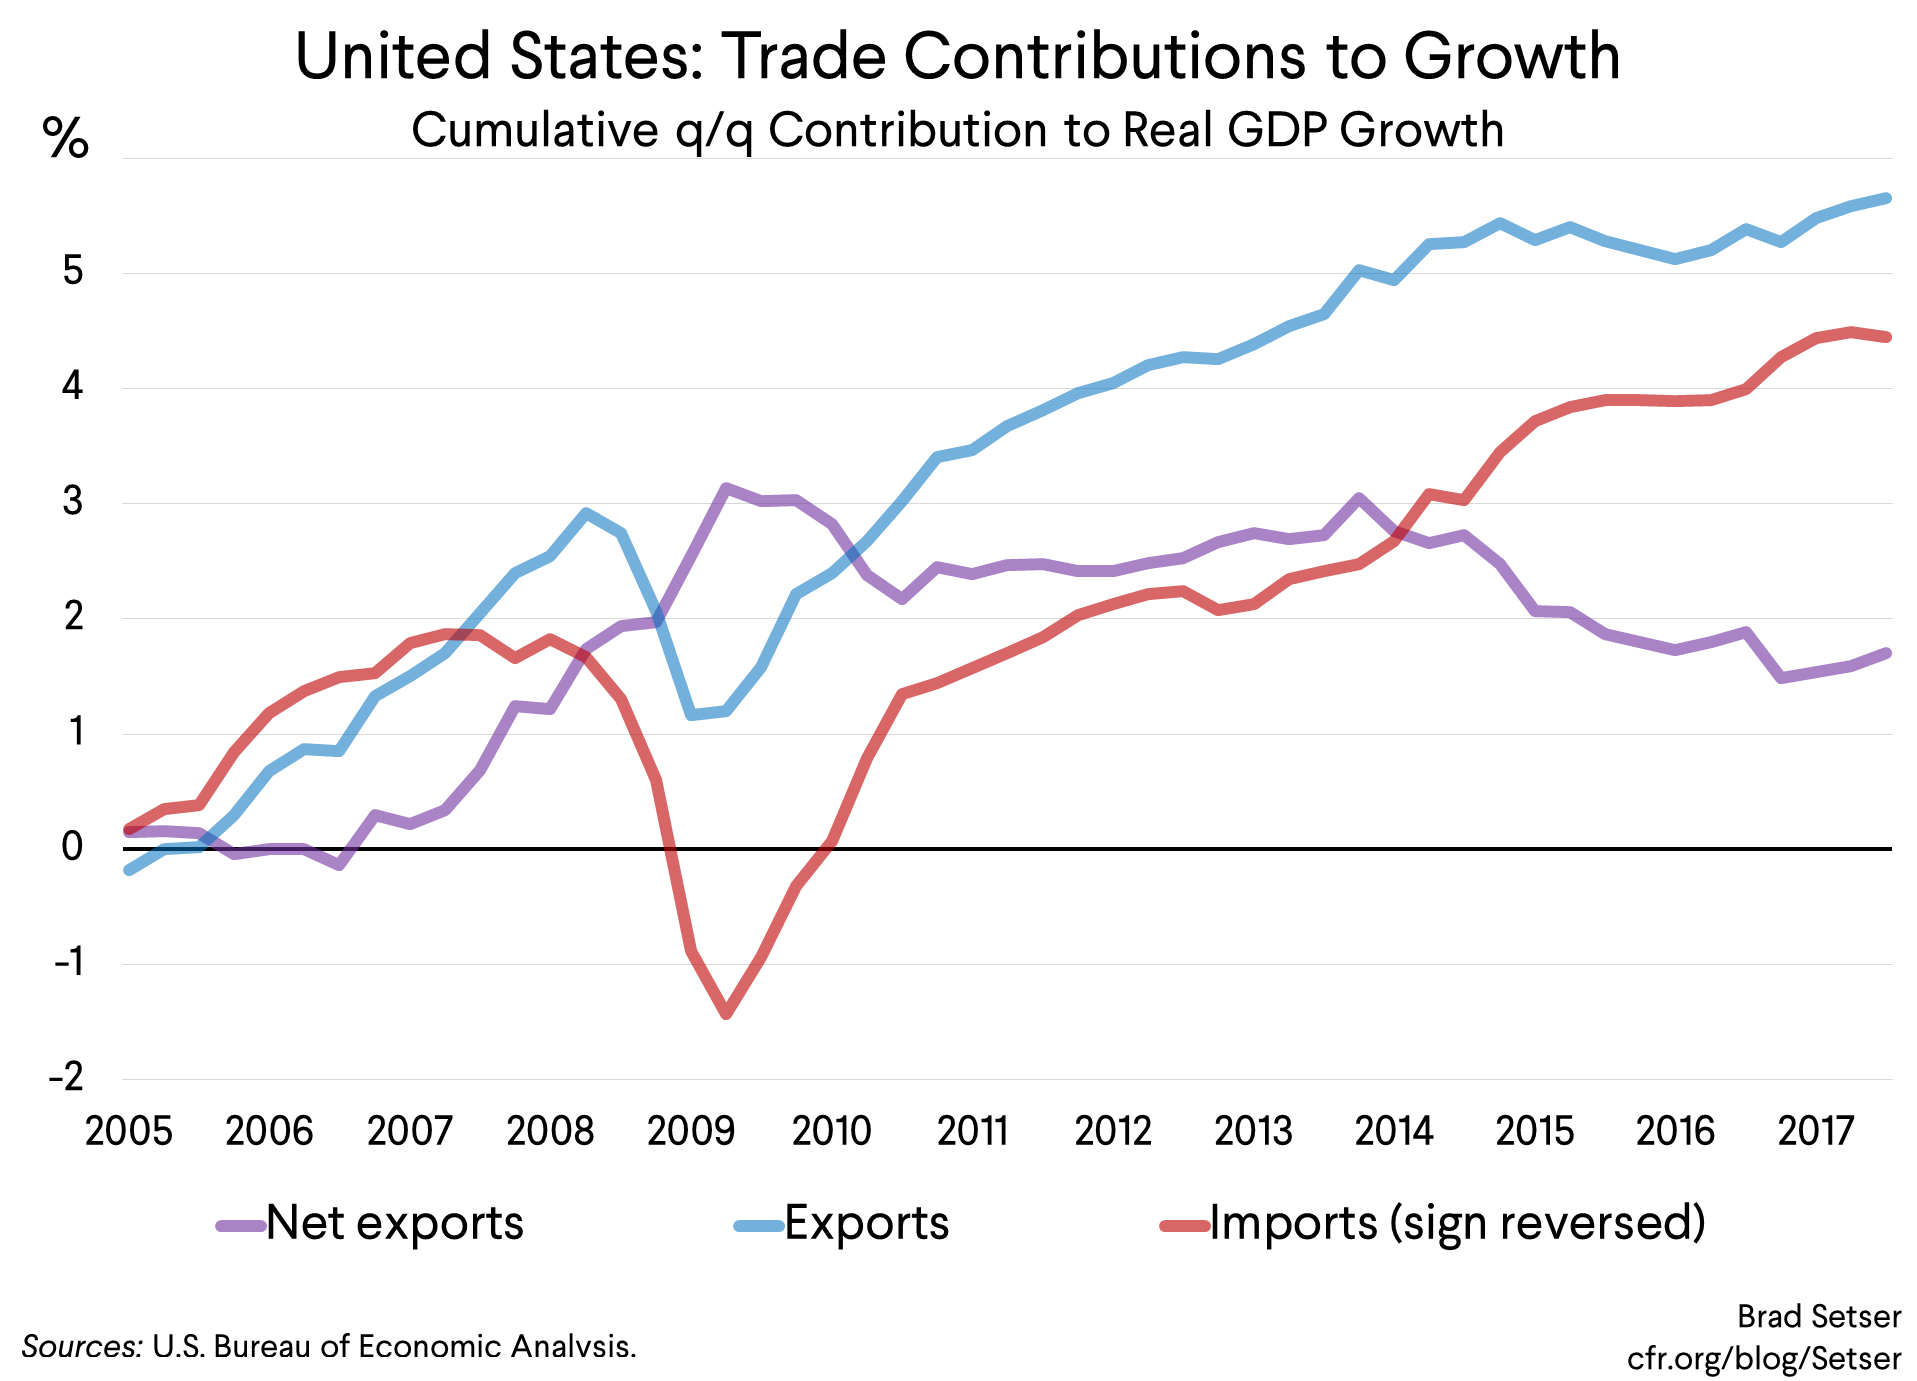
*** There is an alternative way of looking at the contribution of imports and exports to GDP growth. Imports can be deducted from domestic demand, to estimate the “domestic” impulse to demand. If the contribution from demand growth is say 2.5 percentage points of GDP, then on average imports would typically deduct something like 0.5 percentage points from growth—leaving a 2 percentage point contribution from domestic demand to domestic output. Exports then should be added to the total. In my hypothetical example, a 0.5 percentage point contribution from exports would balance the demand the U.S. shared with the world through imports. Plotting the contributions this way—rather than just looking at domestic demand versus net exports—highlights the relatively large role exports played in U.S. growth in the period from 2005 to roughly 2010, when the U.S. and the global economy adjusted to the dollar’s weakness.
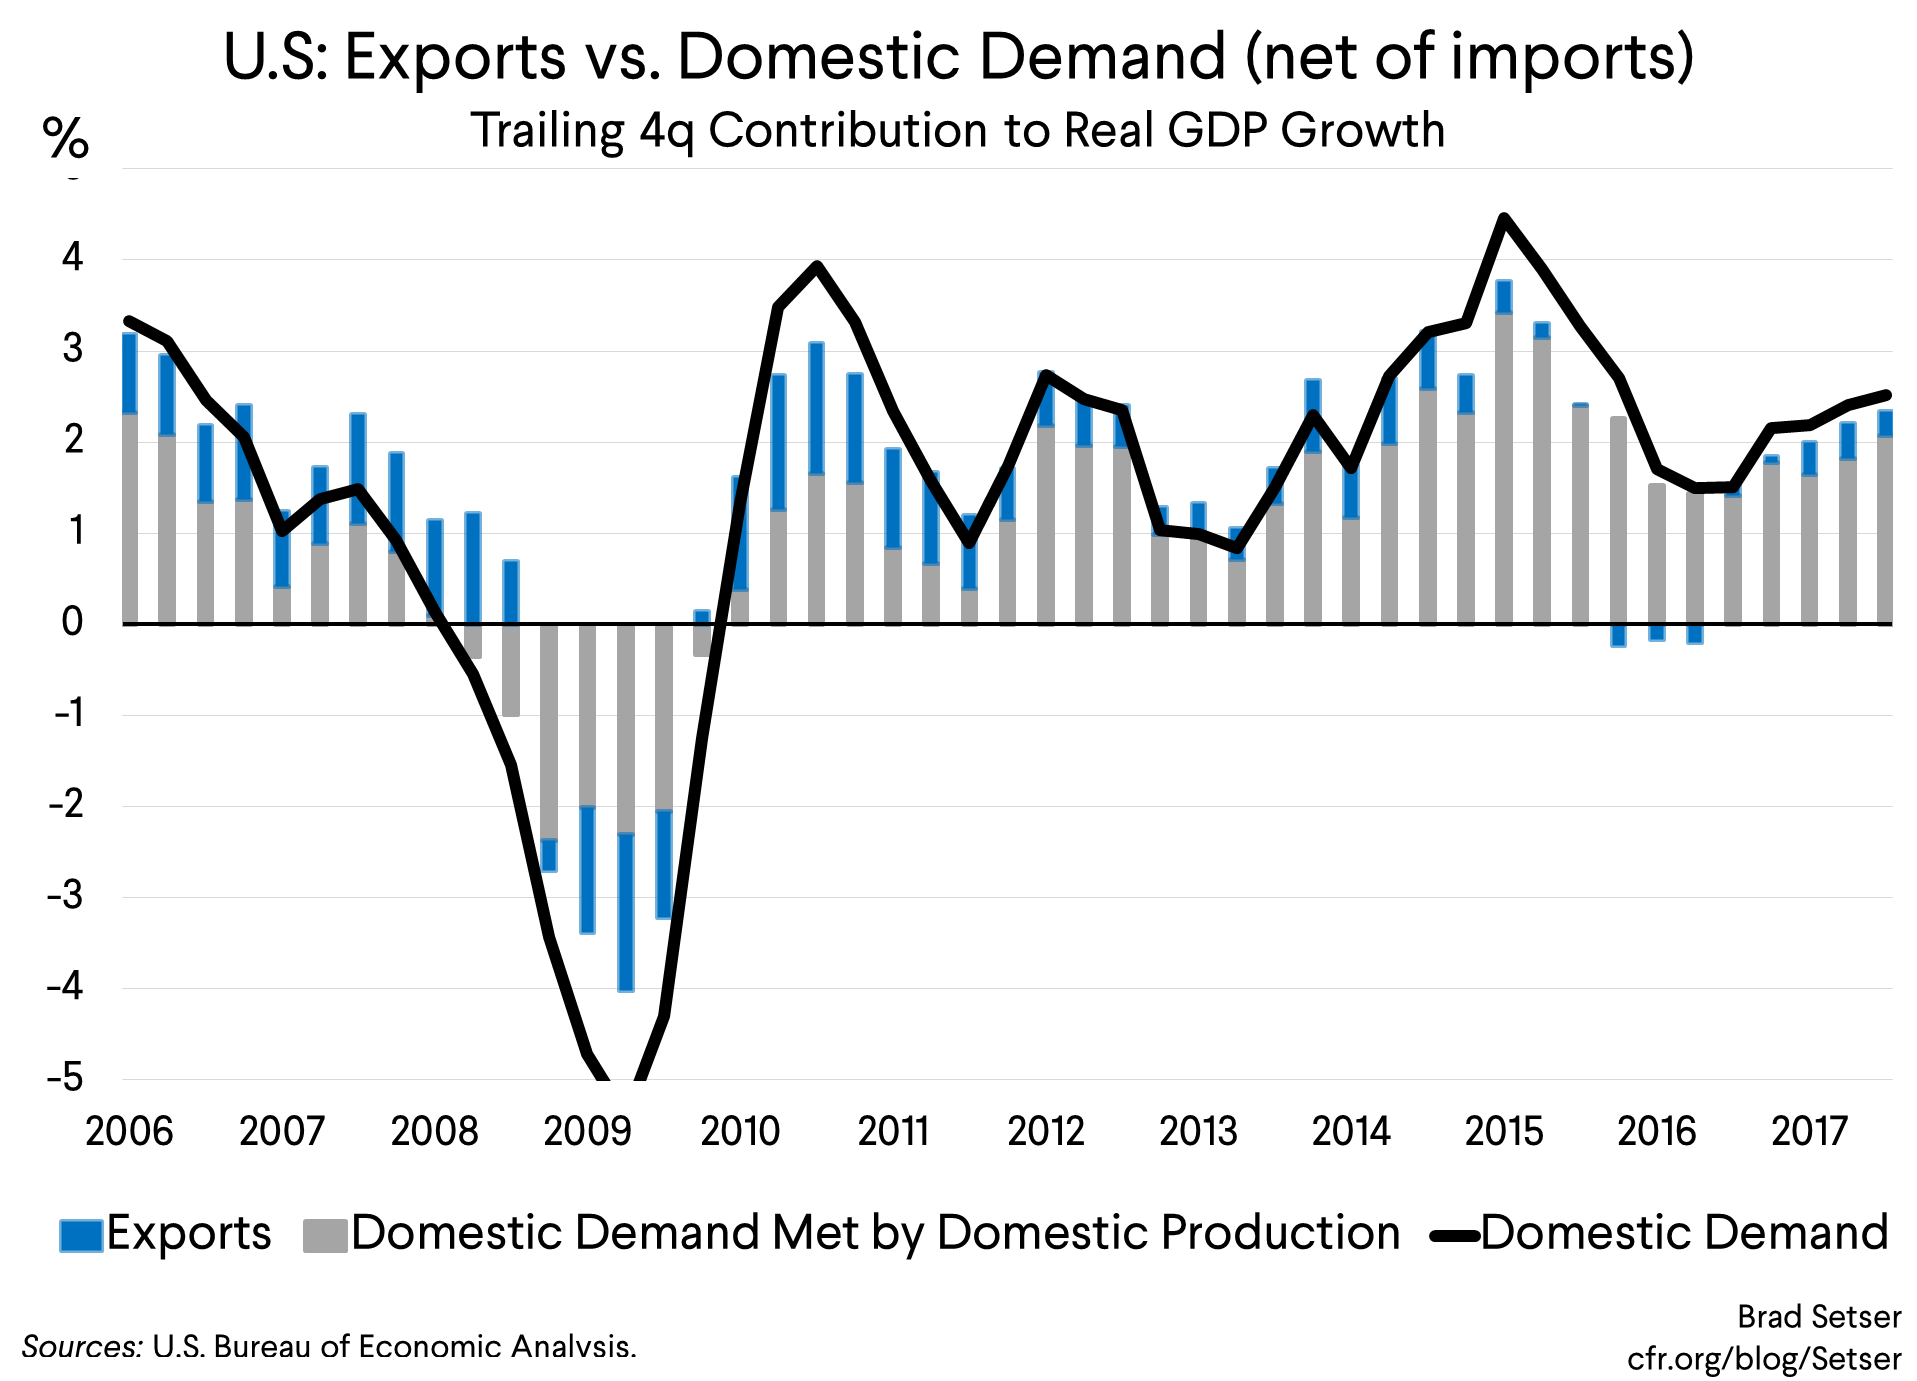
Conversely, the contribution from exports has fallen after the dollar’s 2014 rise. The objection to this breakdown is that some imports are components for export. That’s true, but empirically—despite all the talk of the importance of supply chains—it isn’t that important for the U.S. (exports aren’t that large versus GDP and the imported content of U.S. exports, per the OECD, is modest, so the bulk of U.S. imports meet U.S. domestic demand).
**** Goldman and Deutsche Bank have both argued in the past week that the U.S. trade deficit is significantly overstated because of profit shifting. I obviously agree, but don’t think that materially changes the argument I am making here. The main impact of the most common profit shifting strategies has been to shift income from the export of intellectual property (a services export) to the income balance. That has no impact on the goods balance, as it essentially reallocates a portion of the income surplus to the services surplus. Some other strategies (offshore manufacturing by the pharmaceutical sector) do raise the goods balance. But the big increase in reported profits in low tax jurisdictions came from 2000 to 2012, not in the past few years. The associated adjustment thus would affect the services balance more than the goods balance, and the impact on the goods balance would come largely before the impact of the dollar’s recent appreciation. And such strategies have no impact on the overall current account deficit, as any reduction in the trade deficit is offset by a reduction in the surplus from income on direct investment.
***** The true trade deficit that is; a portion of the current trade deficit in my view comes from tax-shifting strategies that understate exports so as to inflate offshore income, and the tax reform might cause some changes as firms try to optimize their new tax burden. But the relevant variable for external debt sustainability in my view is the non-interest current account (which includes offshore profits) and is now around 2 percent of U.S. GDP.
****** See Blanchard and Das. They emphasis that calculations of external sustainability are subject to uncertainty because returns on foreign assets and cost of external borrowing can change unexpectedly. But absent a positive shock to the U.S. net external position, their baseline suggests the dollar needs to depreciate to assure U.S. external sustainability.