Disaggregating the Fall in China’s Current Account Surplus Since 2007
China’s current account surplus is almost certainly about $100 billion larger than officially reported, and the falling current account surplus masks a persistent manufacturing surplus.

China’s current account surplus has fallen from 8 percent of China’s GDP to between 1 and 1.5 percent of China’s GDP —or from $350 billion dollars to between $125 and $165 billion (the total has bounced around a bit from quarter to quarter recently).
The current account balance even turned negative in the first quarter of 2018 (the first quarter is typically the seasonal low for China’s exports and its surplus).
Some analysts are now projecting that China may even run a current account deficit this year.
Hold on a second.
Two things are missing from this analysis.
- China’s current account balance isn’t accurately measured. China’s surplus is probably about a percentage point higher than reported. China has a ways to go before it “really” runs a deficit.
- The current account is no longer a good proxy for China’s impact on its merchandise trade partners, and particularly for China’s impact on global trade in manufactures.
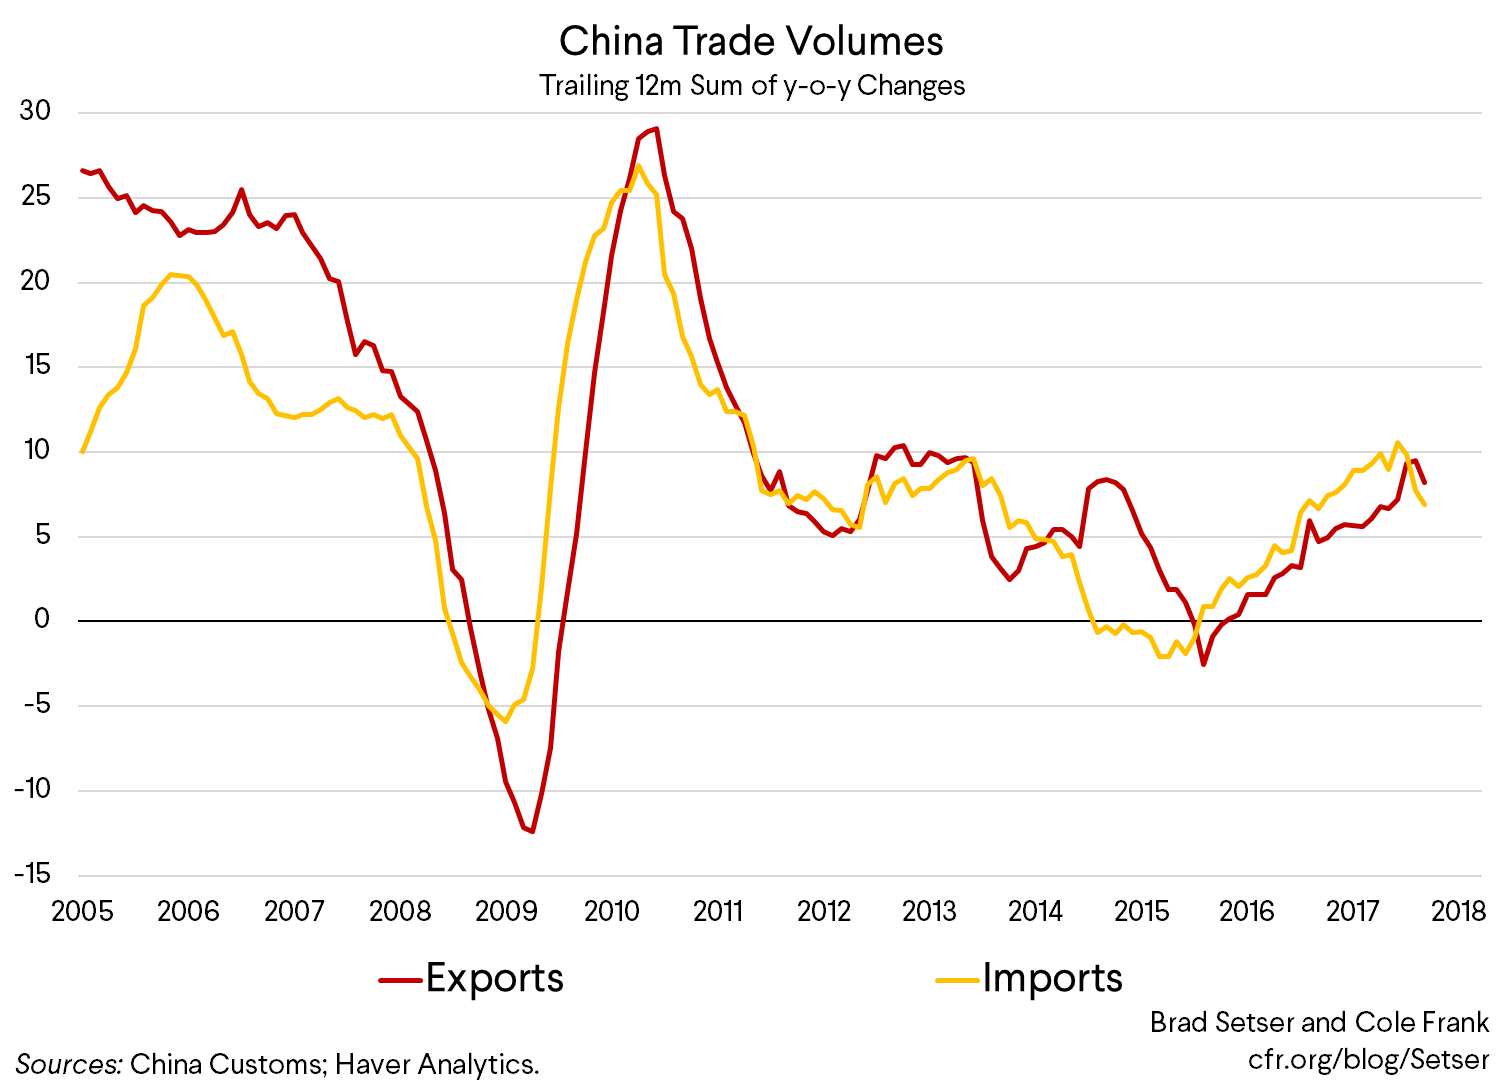
Absent the rise in the price of oil, forecasting a fall in China’s current account surplus also seems a bit risky, as Chinese goods export volumes are now rising as fast as import volumes in the year/ year data (policy tightening and all) and exports to the U.S. are currently surging (Trump’s stimulus has mattered more than his rhetoric).* But, well, China does import a lot of oil these days, and higher oil prices will have an impact on the current account balance of the world’s largest oil importer. A $20 rise in the price of oil will knock at least $60 billion off China’s current account surplus, all else equal.
Let’s take each point in turn.
The current account isn’t accurately measured.
China broadly speaking exports manufactures and imports commodities and vacations.
Services trade, excluding travel, is actually pretty close to balance (China exports a lot of construction services to the emerging world for example).
And the income balance isn’t far from balance, as the earnings of firms like GM in China more or less offset the interest SAFE receives on its Treasuries (and the interest it doesn’t receive on its bunds!).
In the official data, the tourism (“travel”) deficit really jumped in 2014. And that jump isn’t really believable, given the other available data (counterparty data on Chinese tourism spending abroad, data on the number of Chinese tourists travelling abroad).
The rise in the tourism deficit in 2014, of course, is linked to the introduction of a new methodology for calculating tourism outflows. That methodology pushing implied per tourism spending abroad up to levels that don’t really make much sense unless they include some disguised outflows—see Anna Wong [PDF].
To get a simple measure of the “real” current account surplus, I extrapolated tourism spending for 2014 using the pre-2014 trend and then added in subsequent changes to get a plausible estimate (e.g. I assume Chinese tourism imports increased by $20 billion not $100 billion in 2014, and then increased by another $20 billion in 2015, stayed more or less constant in 2016 and and increased by $20 billion in 2017, e.g. I took out the big 2014 jump in tourism imports, but the subsequent rise). That puts the current account in the $200—250 billion range ($250 billion in the four quarters through q4, $200 billion in the four quarters through q1—there has been a lot of volatility recently), or around 2 percent of China’s GDP.
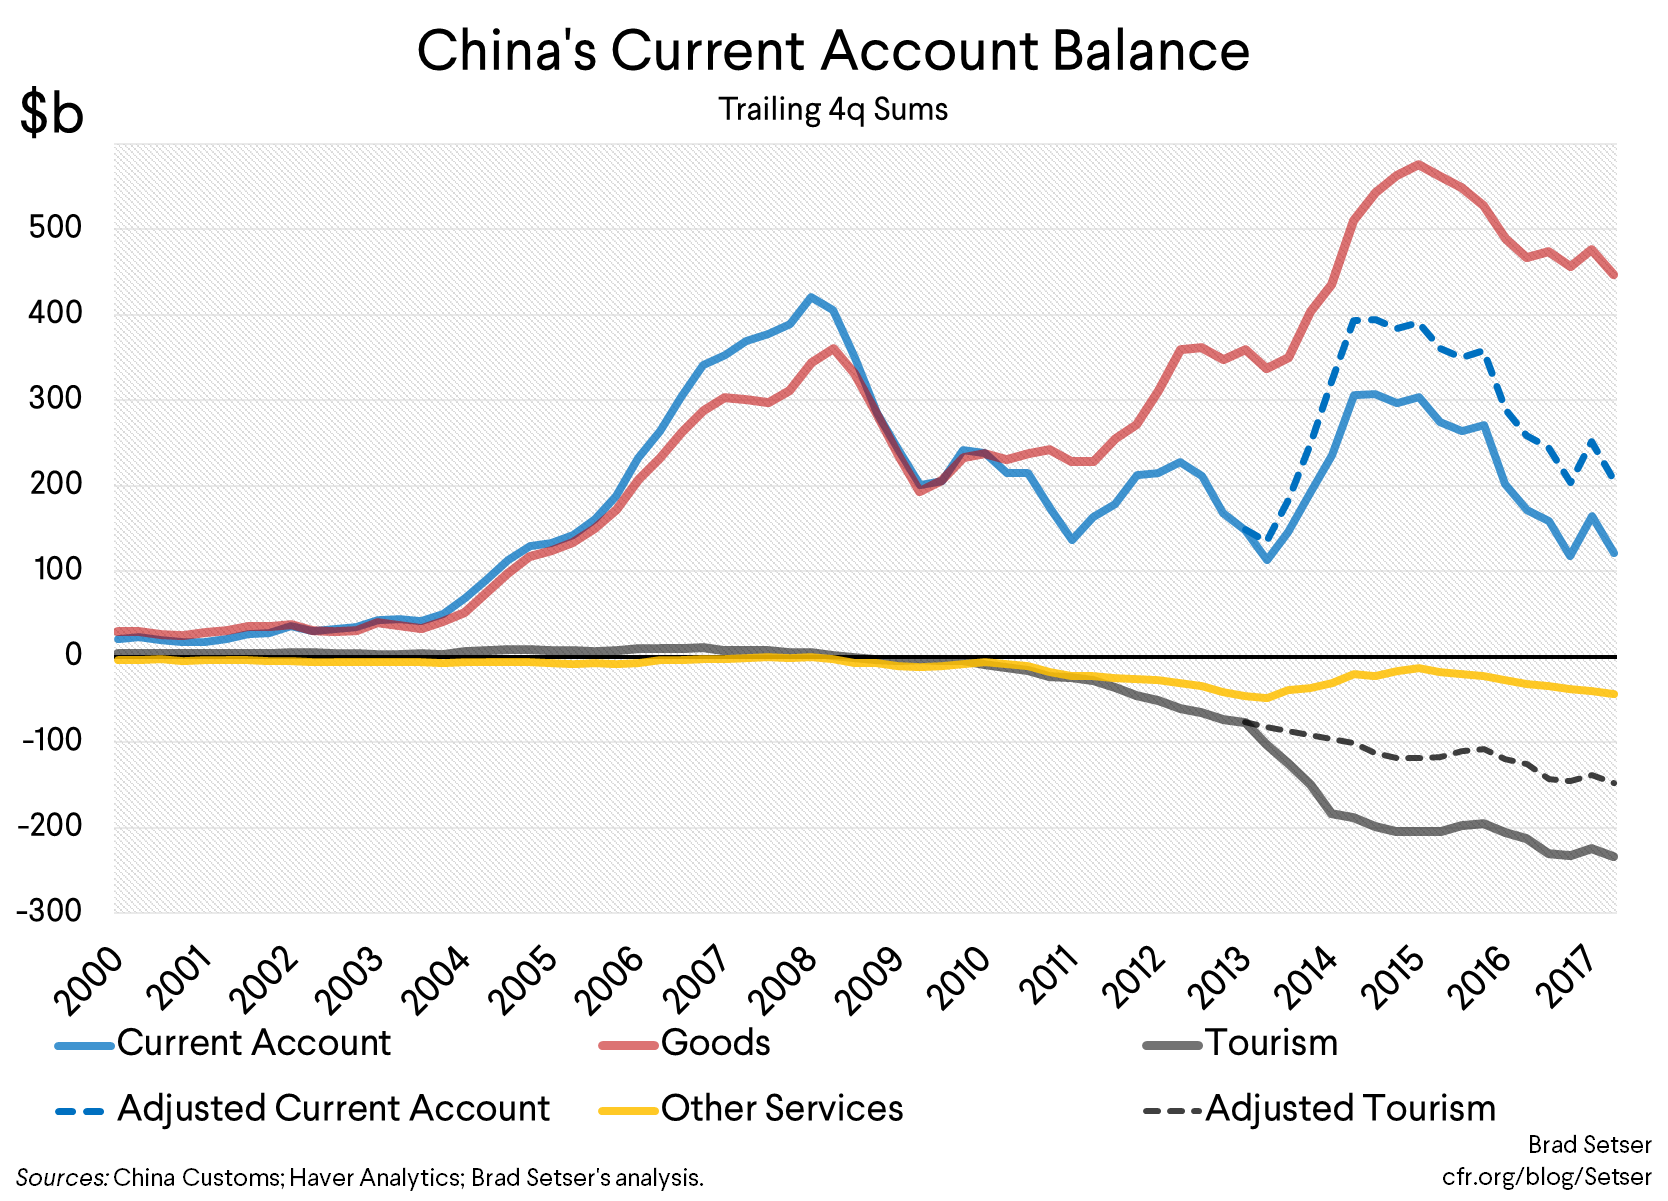
The surplus was, in my view, above 3 percent of China’s GDP in 2015,a nd more or less back at its pre-crisis level in dollar terms.
The much disliked stimulus (see the IMF’s Article IV [PDF]) raised imports and commodity prices, so it helped bring the surplus down in 2016. For real—unlike the rise in tourism in 2014, the rise in Chinese imports that drove the fall in the goods surplus in in 2016 checks out. Still, I worry that if the stimulus is withdrawn absent other policy changes, the overall surplus will rise.
In dollar terms, China’s surplus fell from around $350 in 2007 (the rise to over $400 billion in 2008 reflects the fact that the crisis lowered China’s import bills before it lowered China’s exports, as holiday purchases were already booked) to $200—250 billion today (a fall from 0.65 percent of world GDP, exlcuding China to somewhere around 0.35 percent of World GDP).
That’s a real adjustment, and it certainly contrasts favorably with the rise in the surplus of China’s neighbors after the crisis. But even in the face of a massive investment stimulus, China has continued to run a sizeable external surplus.
The second point: the adjustment didn’t come through the goods balance, and certainly not through the manufacturing balance.
While the tourism deficit is a bit overstated, there is little doubt that there has been a rise in the tourism deficit since 2008, and that the tourism deficit has created a real deficit in services. After the crisis, China clearly liberalized outbound travel in a bid to help hold its surplus down and to give Chinese residents a perk—just as it shifted at the margin from adding to its reserves and buying U.S. bonds to lending through China ExIm and the CDB and others to a host of emerging economies. (See the CGD study, and the IMF’s growing concerns). That has had a powerful impact on Asian tourism exporters, like Thailand—and a measurable impact globally.
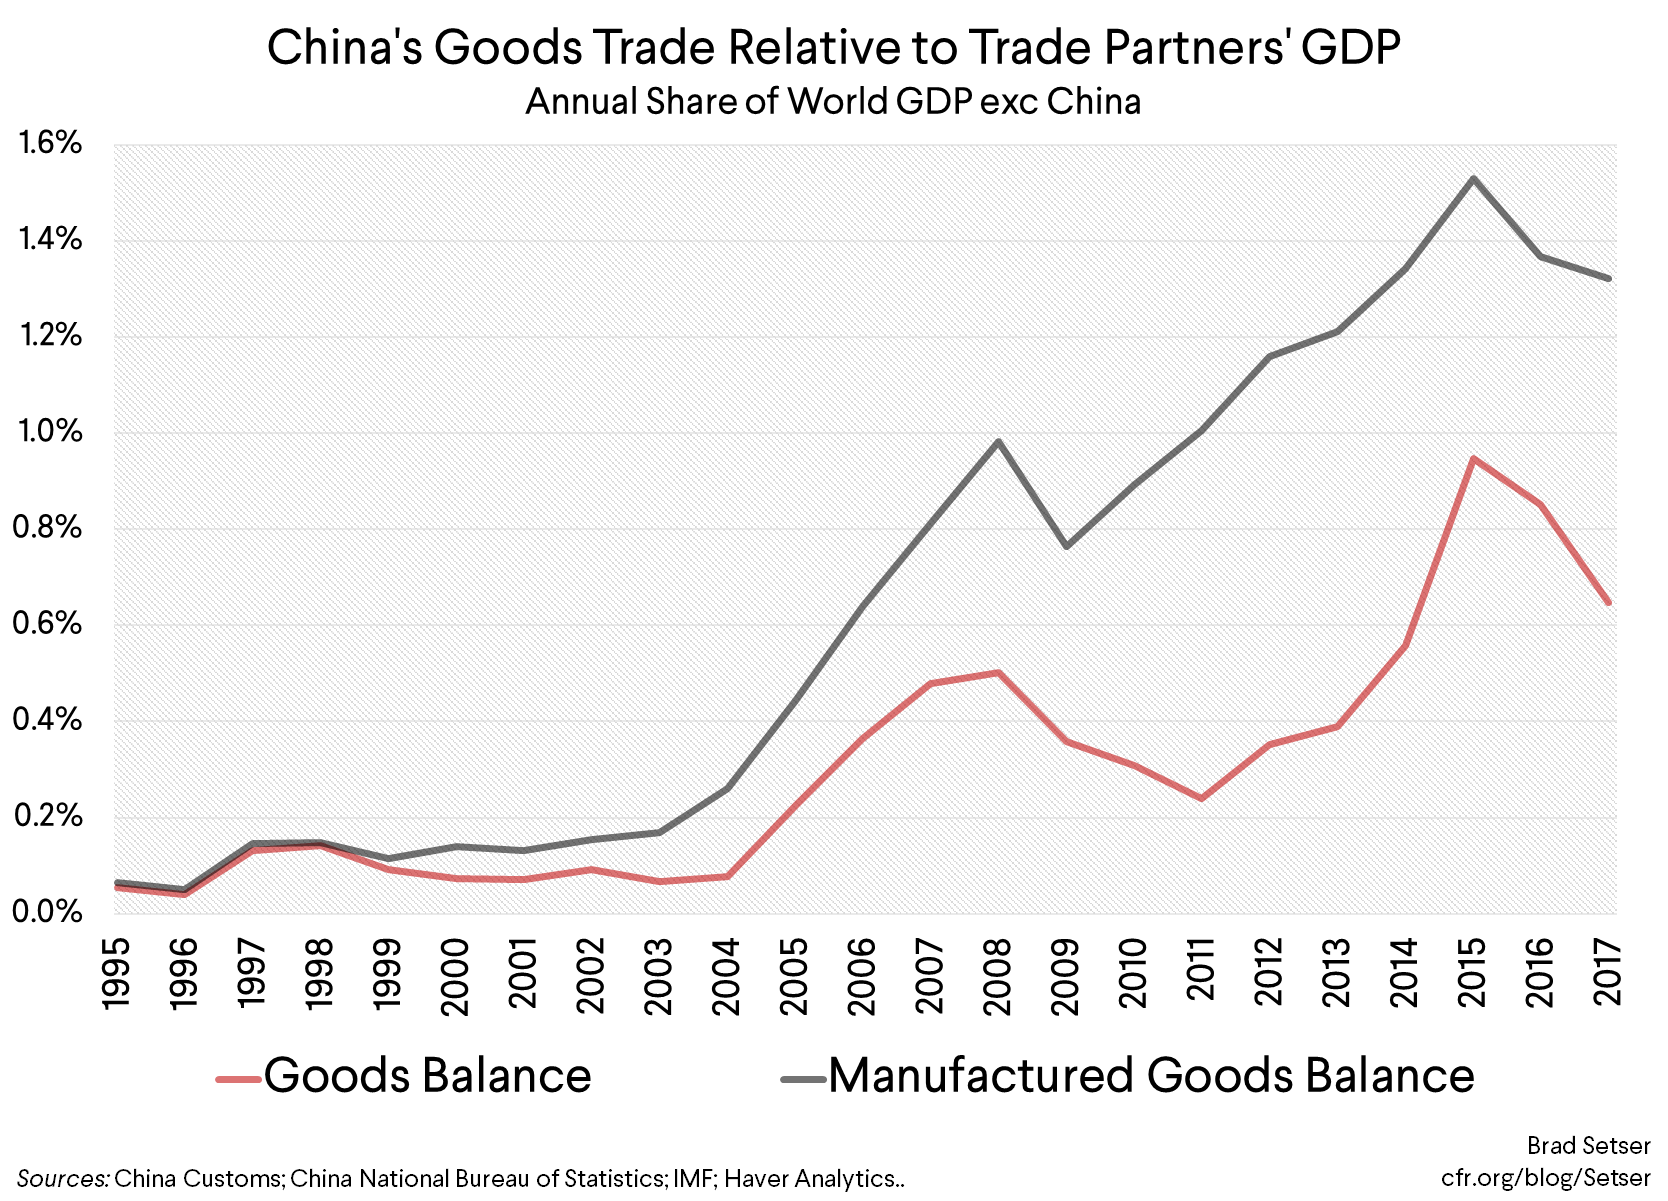
However, China’s goods balance, as a share of the GDP of China’s trade partners, hasn’t really come down. It is actually a bit higher than it was before the global crisis. And China’s surplus in manufacturing is substantially higher than it was before the global crisis when measured relative to the GDP of China’s trading partners (i.e. world GDP, excluding China).
Workers in the manufacturing sector around the world thus have reason not to be all that impressed by China’s adjustment. It hasn’t helped them. Not in aggregate.
To understand the rise in China’s overall surplus with the world after the crisis, it helps to go back and look at China’s trade in relation to its own economy.
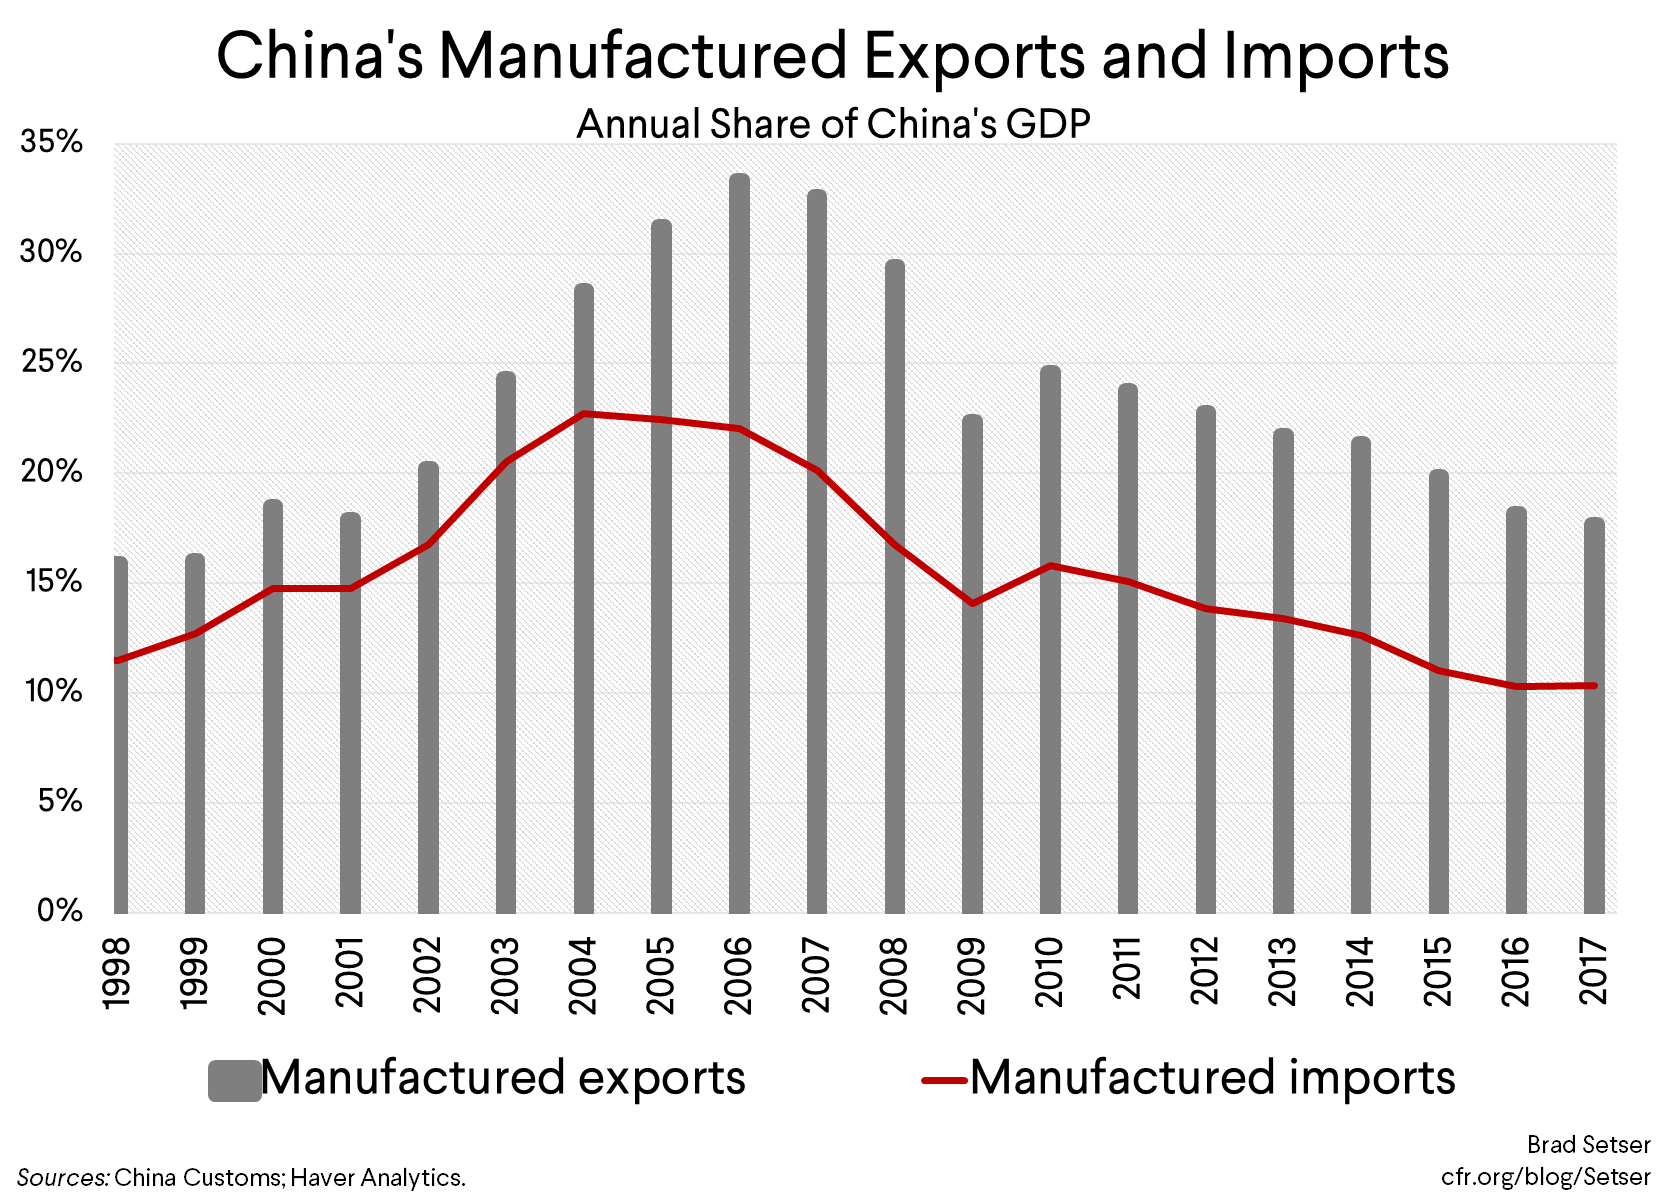
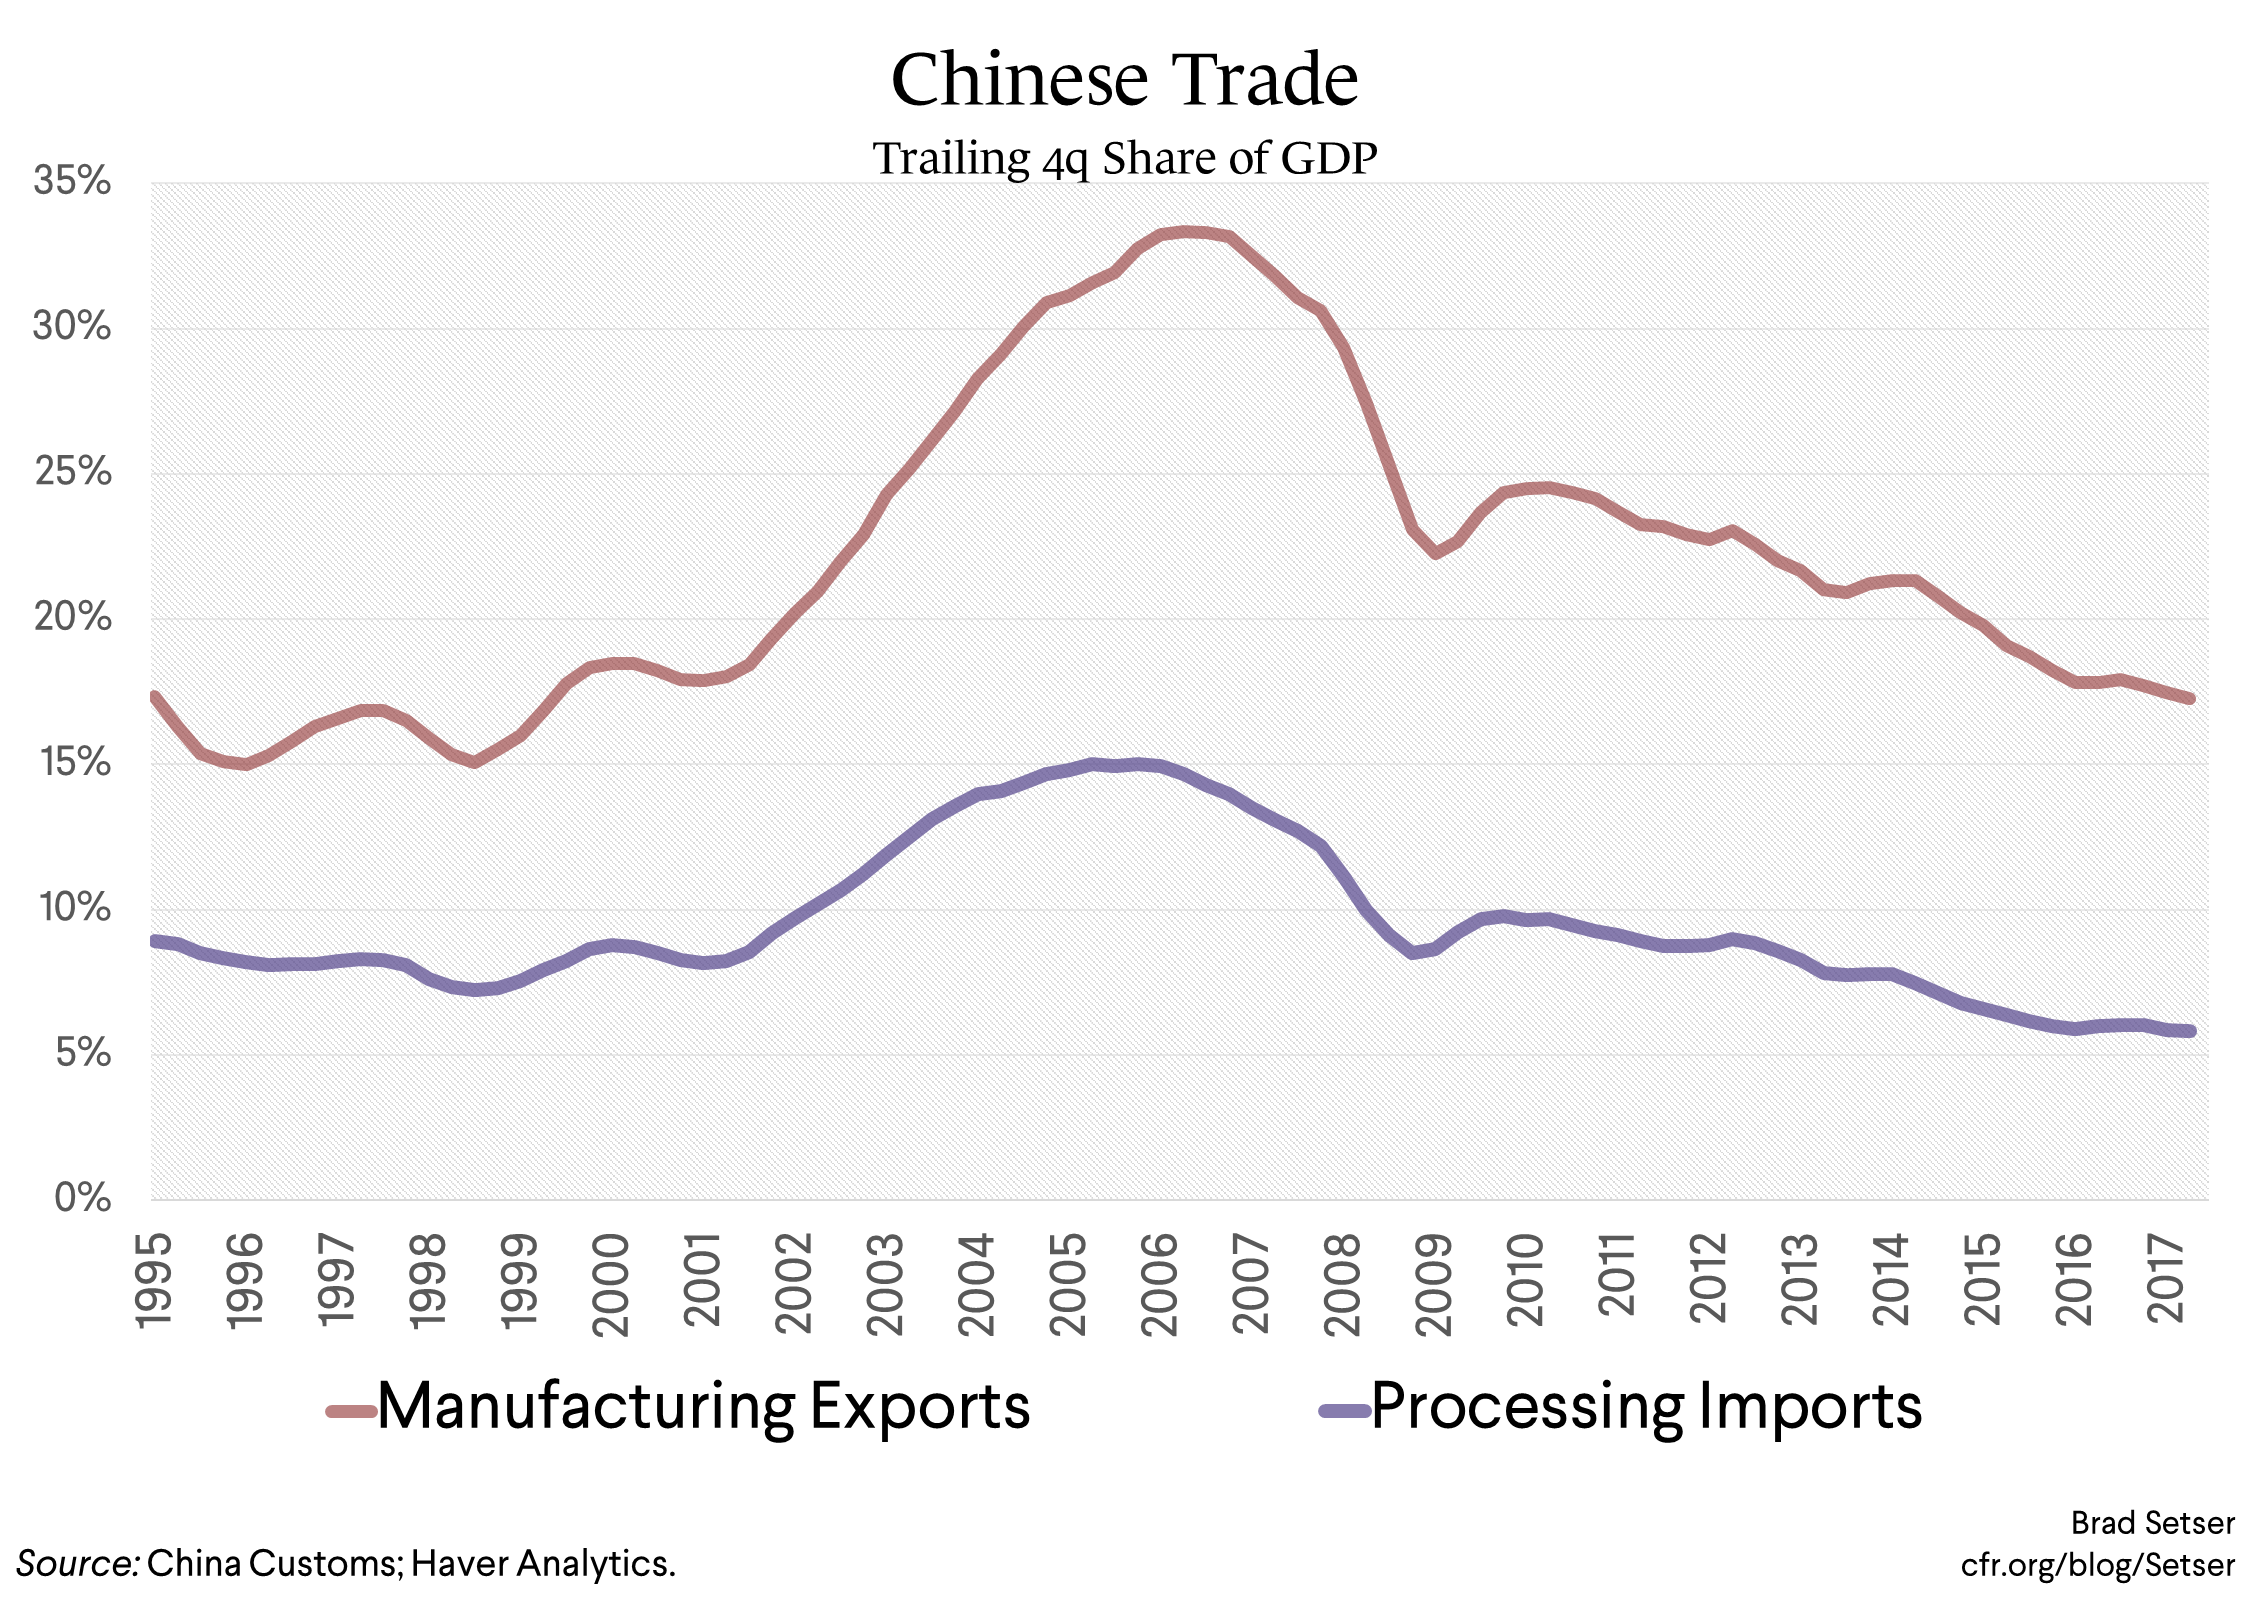
There was an important shift around the time of the global crisis: China’s manufacturing exports stopped rising relative to China’s own GDP. China’s currency appreciation did have an impact here—I agree with Dr. Summers.
But China’s imports of manufactures also fell. Pretty sharply. They are now lower than they were in the late 1990s (before China joined the WTO).
That’s because the imported content of China’s exports has fallen. The OECD put the import content of exports at around 30 percent in 2014 (versus 15 percent for the U.S). I think it is probably now closer to 25 percent.** “Assembled in China” oversimplifies.
And the Chinese content of China’s own consumption of manufactures has increased.
A big surge in investment typically is import intensive. And China’s investment surge was commodity intensive. But it turned out not to be all that capital goods import intensive—in part because China has rigged its market for capital goods to favor domestic producers. China for example squeezed out imports as it expanded its high speed rail network, as it built out its wind turbine sector, and as it built up its solar capacity. See Matt Klein in Barron’s.
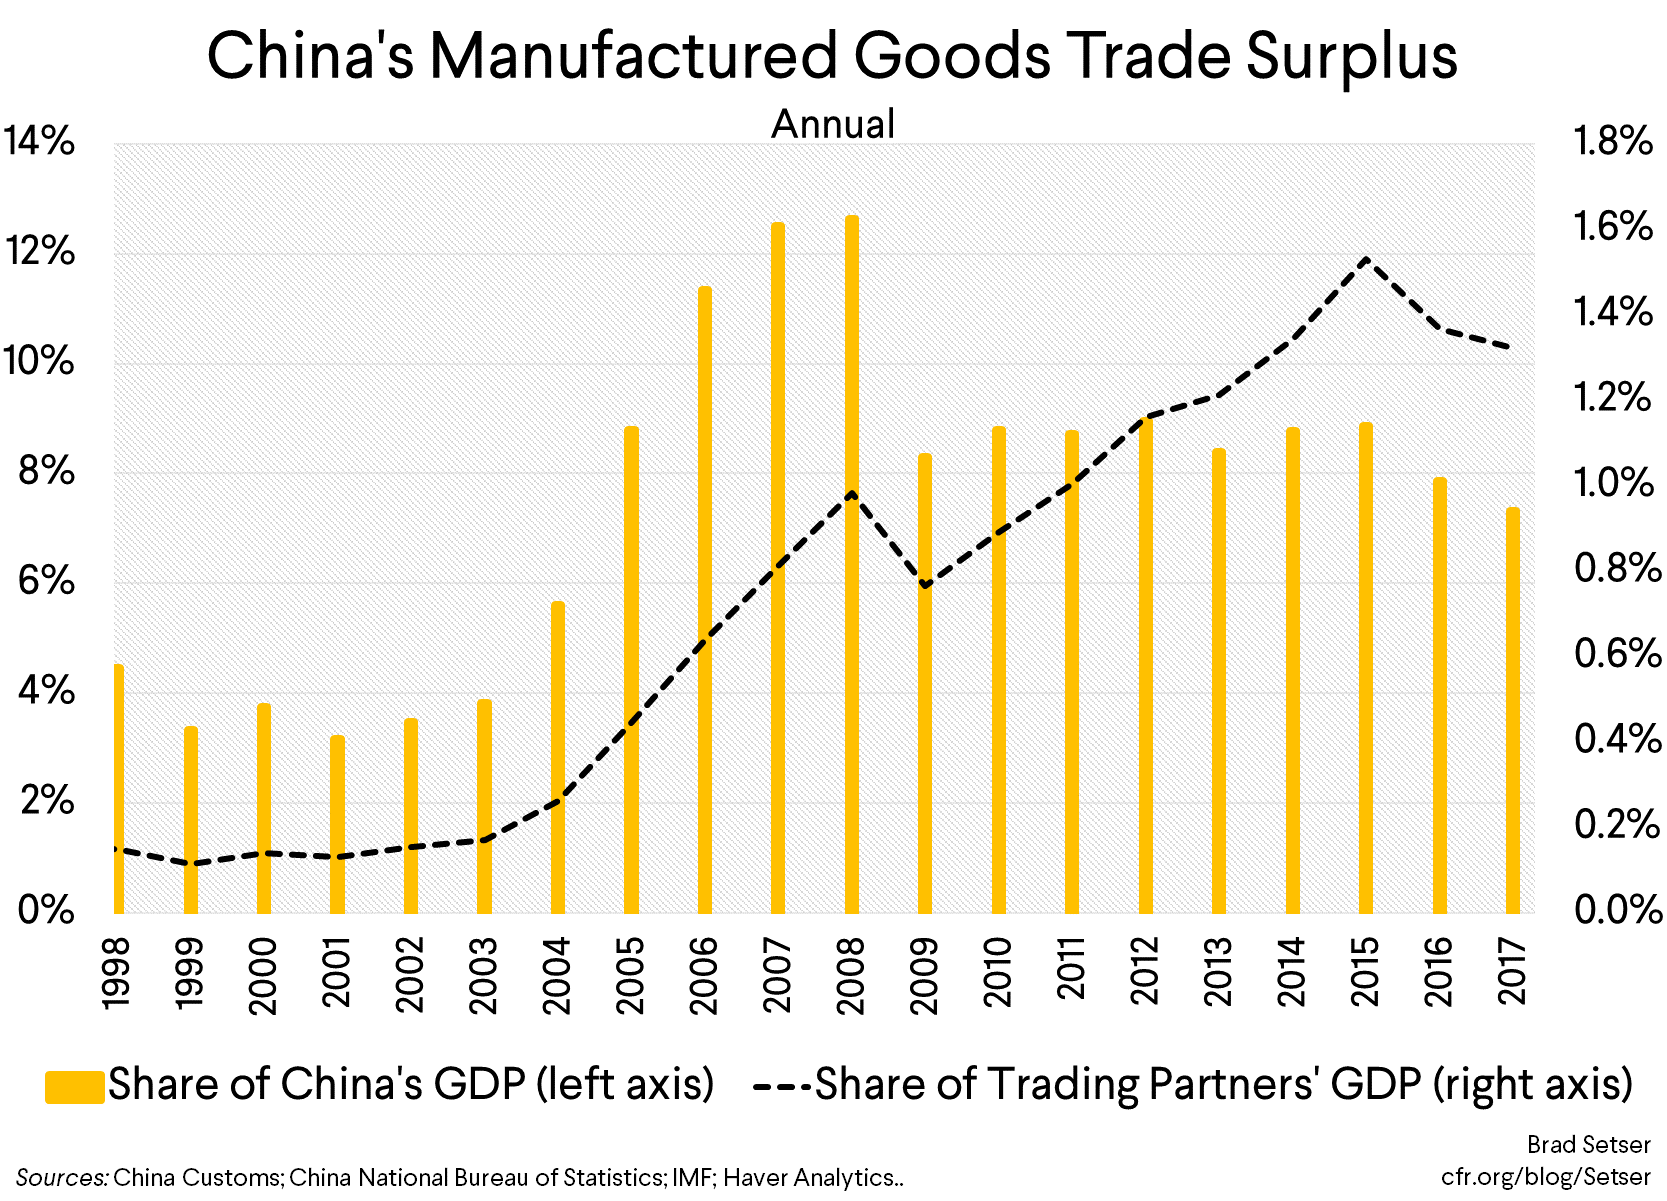
Because imports fell so much relative to its GDP, China’s manufacturing surplus stayed between 6 and 8 percent of its fast rising GDP—and continued to rise relative to the GDP of its trading partners—for most of the post-crisis period. It then dipped in 2016, thanks to the stimulus. (Look at the ECB’s big report [PDF]—Chinese import volumes lagged its GDP growth)
China’s manufacturing surplus thus remains one of the largest in the world (measured relative to its GDP), not all that different from Germany’s to be honest. It just is offset by very large commodity imports, and a decent deficit in travel.
I think this all has important implications for the ongoing U.S.-China trade talks, but those implications will have to wait for another post. The scenarios I buried at the end of my last data-heavy post didn’t get much attention.
* Here is a chart showing the year-over-year change in export and import volumes, with estimates for March and April 2018 based on the yuan-denominated trade data and a roughly estimated price index. The average of changes over the last 12 months is a measure designed to capture broad trends: it is slow to capture changes in trends. Higher frequency measures suggest a fall the pace of import growth, and forward looking measures suggest a slowdown in the pace of export growth. This also in an area where China’s own data should be much better: China only publishes year-over-year changes in volumes, not a true volume index.
** The ratio of processing imports to total manufactured exports fell a bit after 2014, suggesting a rise in China’s value-added.